
Recommended
More Related Content
Viewers also liked
Viewers also liked (19)
Similar to Managed Futures: Potential to Profit During Market Declines
Similar to Managed Futures: Potential to Profit During Market Declines (20)
Recently uploaded
Recently uploaded (20)
Managed Futures: Potential to Profit During Market Declines
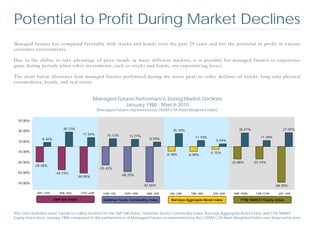
- 1. Potential to Profit During Market Declines Managed futures has compared favorably with stocks and bonds over the past 29 years and has the potential to profit in various economic environments. Due to the ability to take advantage of price trends in many different markets, it is possible for managed futures to experience gains during periods when other investments, such as stocks and bonds, are experiencing losses. The chart below illustrates how managed futures performed during the worst peak-to-valley declines of stocks, long-only physical commodities, bonds, and real estate. Managed Futures Performance During Market Declines January 1980 - March 2010 (Managed Futures represented by CISDM CTA Asset Weighted Index) 50.00% 28.12% 25.18% 26.41% 27.05% 30.00% 17.54% 15.12% 13.77% 11.73% 11.49% 8.46% 8.59% 10.00% 5.59% -10.00% -5.15% -8.78% -8.99% -30.00% -23.88% -23.74% -29.58% -35.42% -50.00% -44.73% -50.95% -48.25% -70.00% -67.65% -68.30% 9/87 -11/87 9/00 –9/02 11/07 –2/09 11/00 -1/02 10/97 –2/99 6/08 –2/09 1/80 –2/80 7/80 –9/81 2/94 –6/94 9/89 –10/90 1/98 –11/99 2/07 –2/09 S&P 500 Index Goldman Sachs Commodity Index Barclays Aggregate Bond Index FTSE NAREIT Equity Index This chart illustrates worst 3 peak-to-valley declines for the S&P 500 Index, Goldman Sachs Commodity Index, Barclays Aggregate Bond Index, and FTSE NAREIT Equity Index since January 1980 compared to the performance of Managed Futures as represented by the CISDM CTA Asset Weighted Index over those same time.