Download to read offline


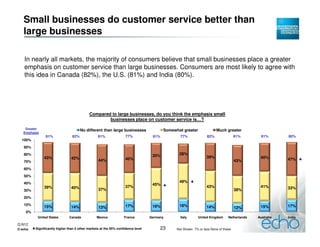

The document summarizes the results of a research study that surveyed over 10,000 consumers across 10 countries about their perceptions of customer service. Some key findings include: - Fewer than one-third of consumers in most countries think businesses have increased their focus on customer service during difficult economic times. However, more consumers in India and Mexico believe businesses have made an extra effort. - Around half to three-fifths of consumers feel businesses generally meet their expectations for customer service, but at least a quarter feel expectations are usually missed, over half in France and Mexico. - Two-fifths or more of consumers in most countries think businesses are helpful but don't go beyond what's required to keep customers


![Report viettrack july 170811 eng final [read-only]](https://cdn.slidesharecdn.com/ss_thumbnails/report-viettrackjuly170811engfinalread-only-130116214640-phpapp02-thumbnail.jpg?width=640&height=640&fit=bounds)


