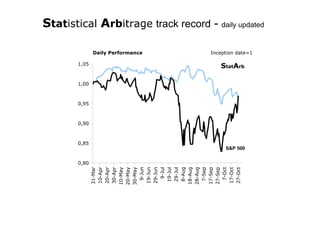
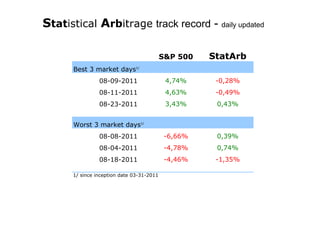
This document summarizes the performance of a statistical arbitrage strategy compared to the S&P 500 index since inception on March 31, 2011. The statistical arbitrage strategy has underperformed the S&P 500 on a cumulative and annualized return basis, but has significantly lower volatility, beta, and maximum drawdown. It has experienced negative returns on the S&P 500's best up days and positive returns on some of the S&P 500's worst down days, demonstrating an ability to achieve alpha in volatile markets.