Download as PDF, PPTX

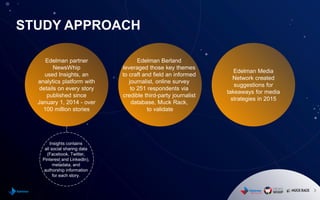
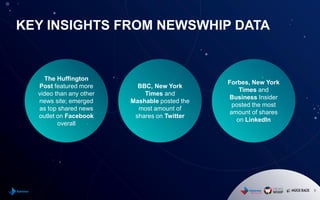
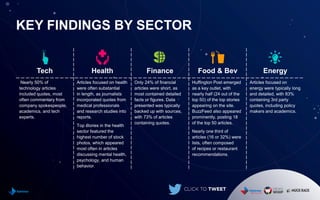

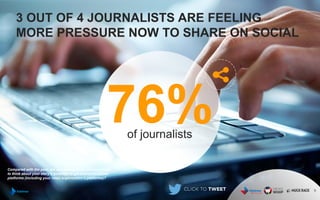
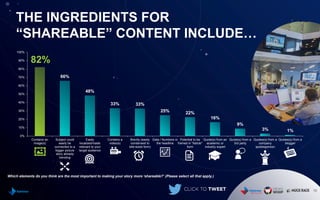
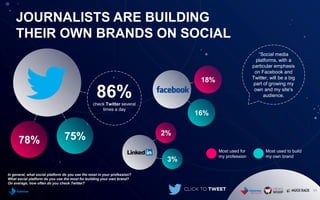


The 2015 Edelman Media Forecast reports on social news consumption trends and its impact on storytelling. Key findings indicate that Facebook is the leading platform for social media interactions and that most engaging articles come from non-legacy media publishers, with HuffPost dominating. Journalists now feel increased pressure to create shareable content, emphasizing the importance of visuals, relevance, and engaging narratives.