Download to read offline


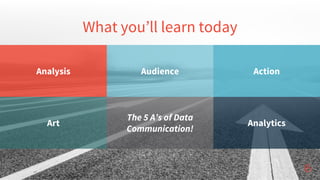


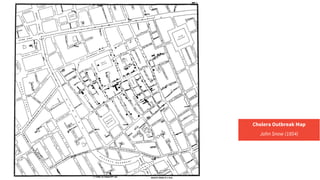

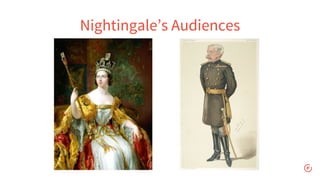
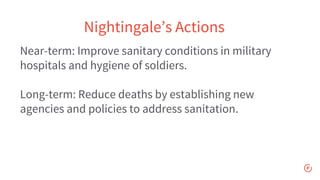

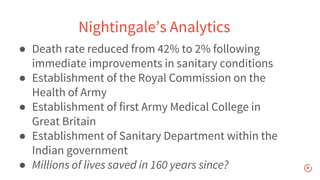


The document discusses how to effectively communicate data through analysis, understanding your audience, determining the desired action, using design principles, and measuring success. It outlines the "Five A's of Data Communication" and provides examples from Florence Nightingale's work in the Crimean War, where she used statistical analysis and visualizations to advocate for improved sanitation in military hospitals. The document encourages understanding audiences through research and provides tips on determining the best approach for data communication based on goals, data characteristics, and delivery method.


![[DSC Europe 25] Danilo Djukanovic - From Vibes to KPIs: Turning Culture Into ...](https://cdn.slidesharecdn.com/ss_thumbnails/inqestws5wf0cik2glgv-3-danilo-djukanovic-from-vibes-to-kpis-presentation-260114111931-dacff81f-thumbnail.jpg?width=640&height=640&fit=bounds)


![[DSC Europe 25] Dragan Jerosimovic - The Anatomy of a Narrative Simulation.pdf](https://cdn.slidesharecdn.com/ss_thumbnails/vzputuprdqr6zwbrwdcw-1-dragan-jerosimovic-the-anatomy-of-a-narrative-simulation-260114111931-9d04fba2-thumbnail.jpg?width=640&height=640&fit=bounds)


