Download to read offline
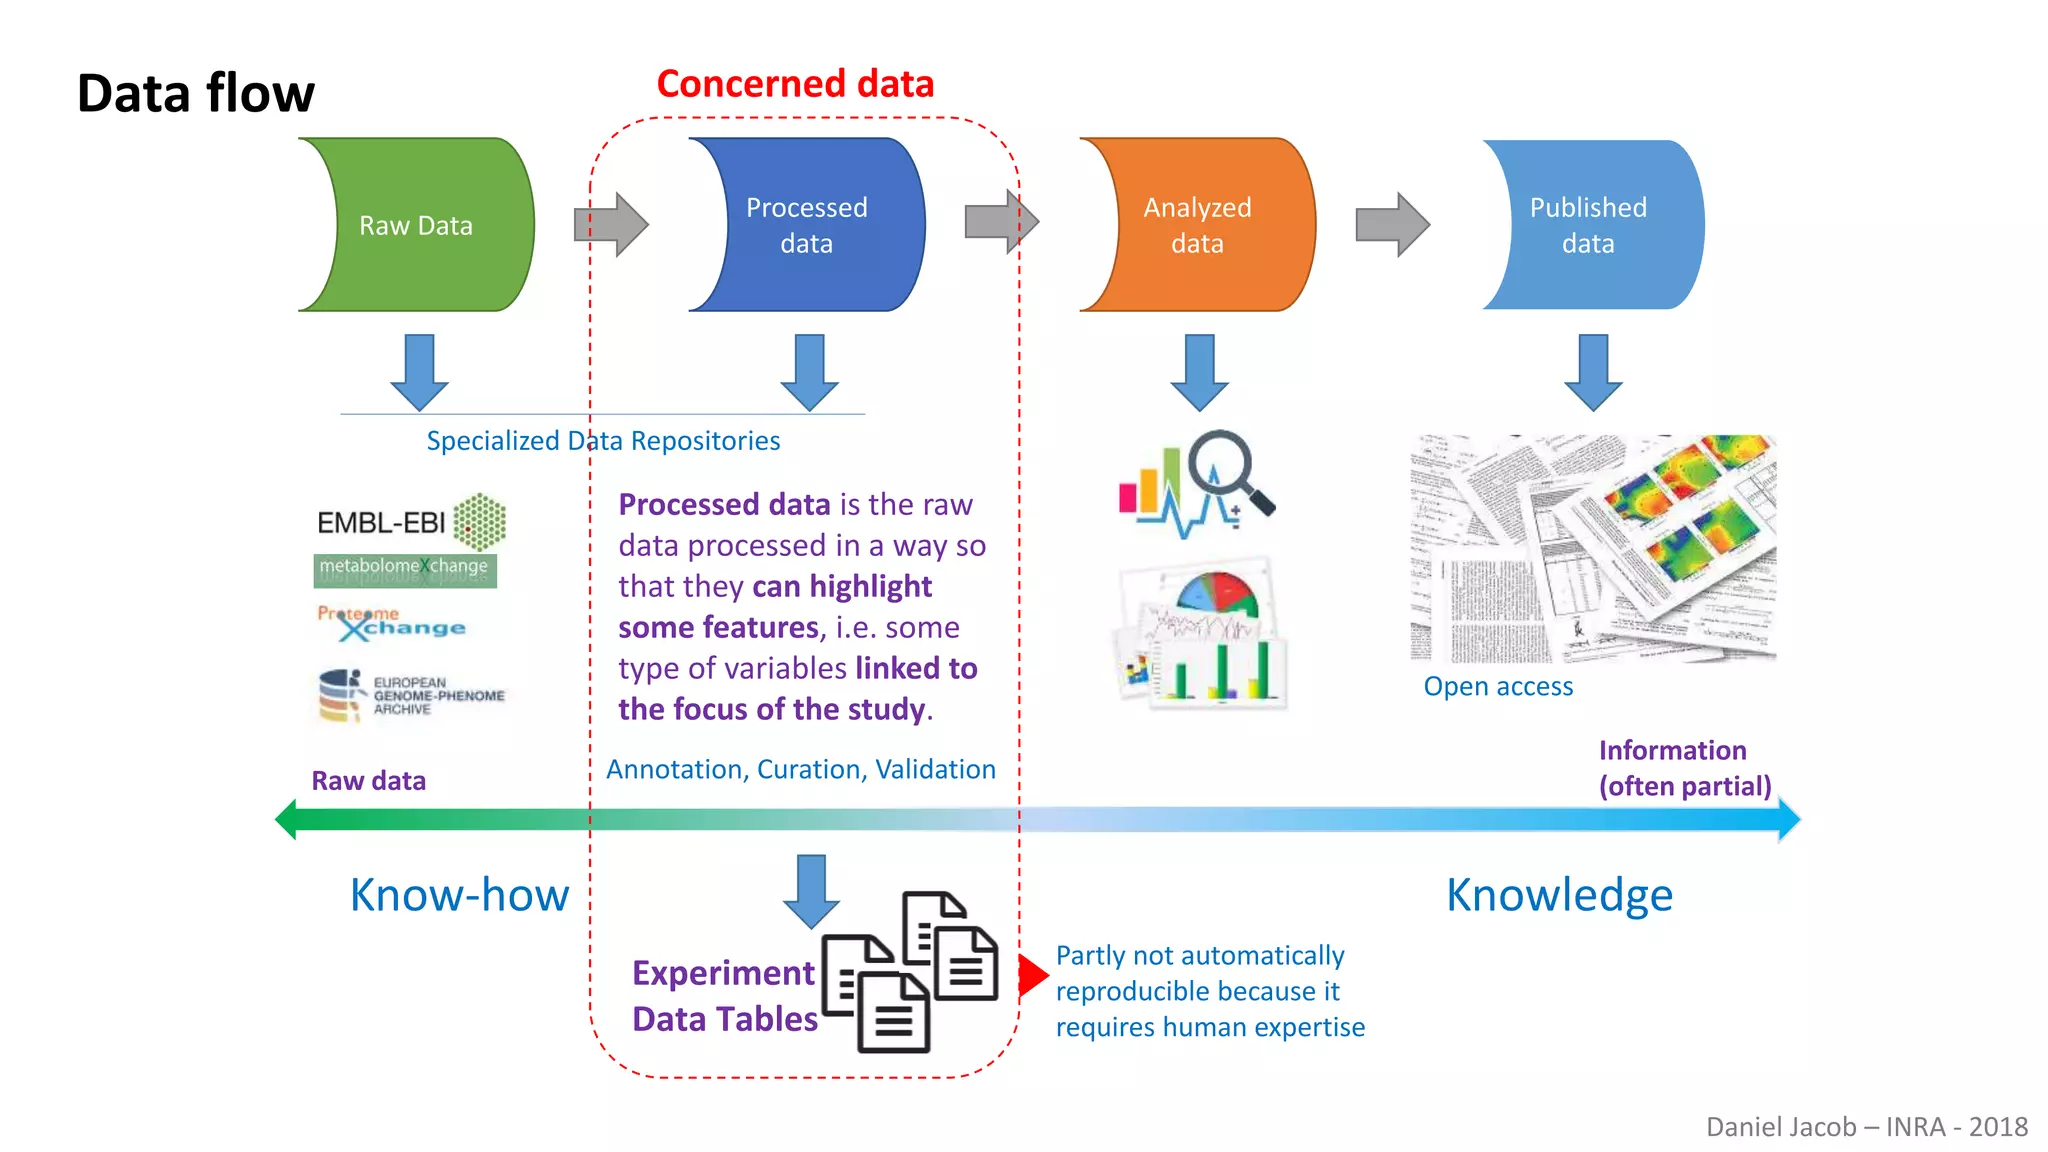
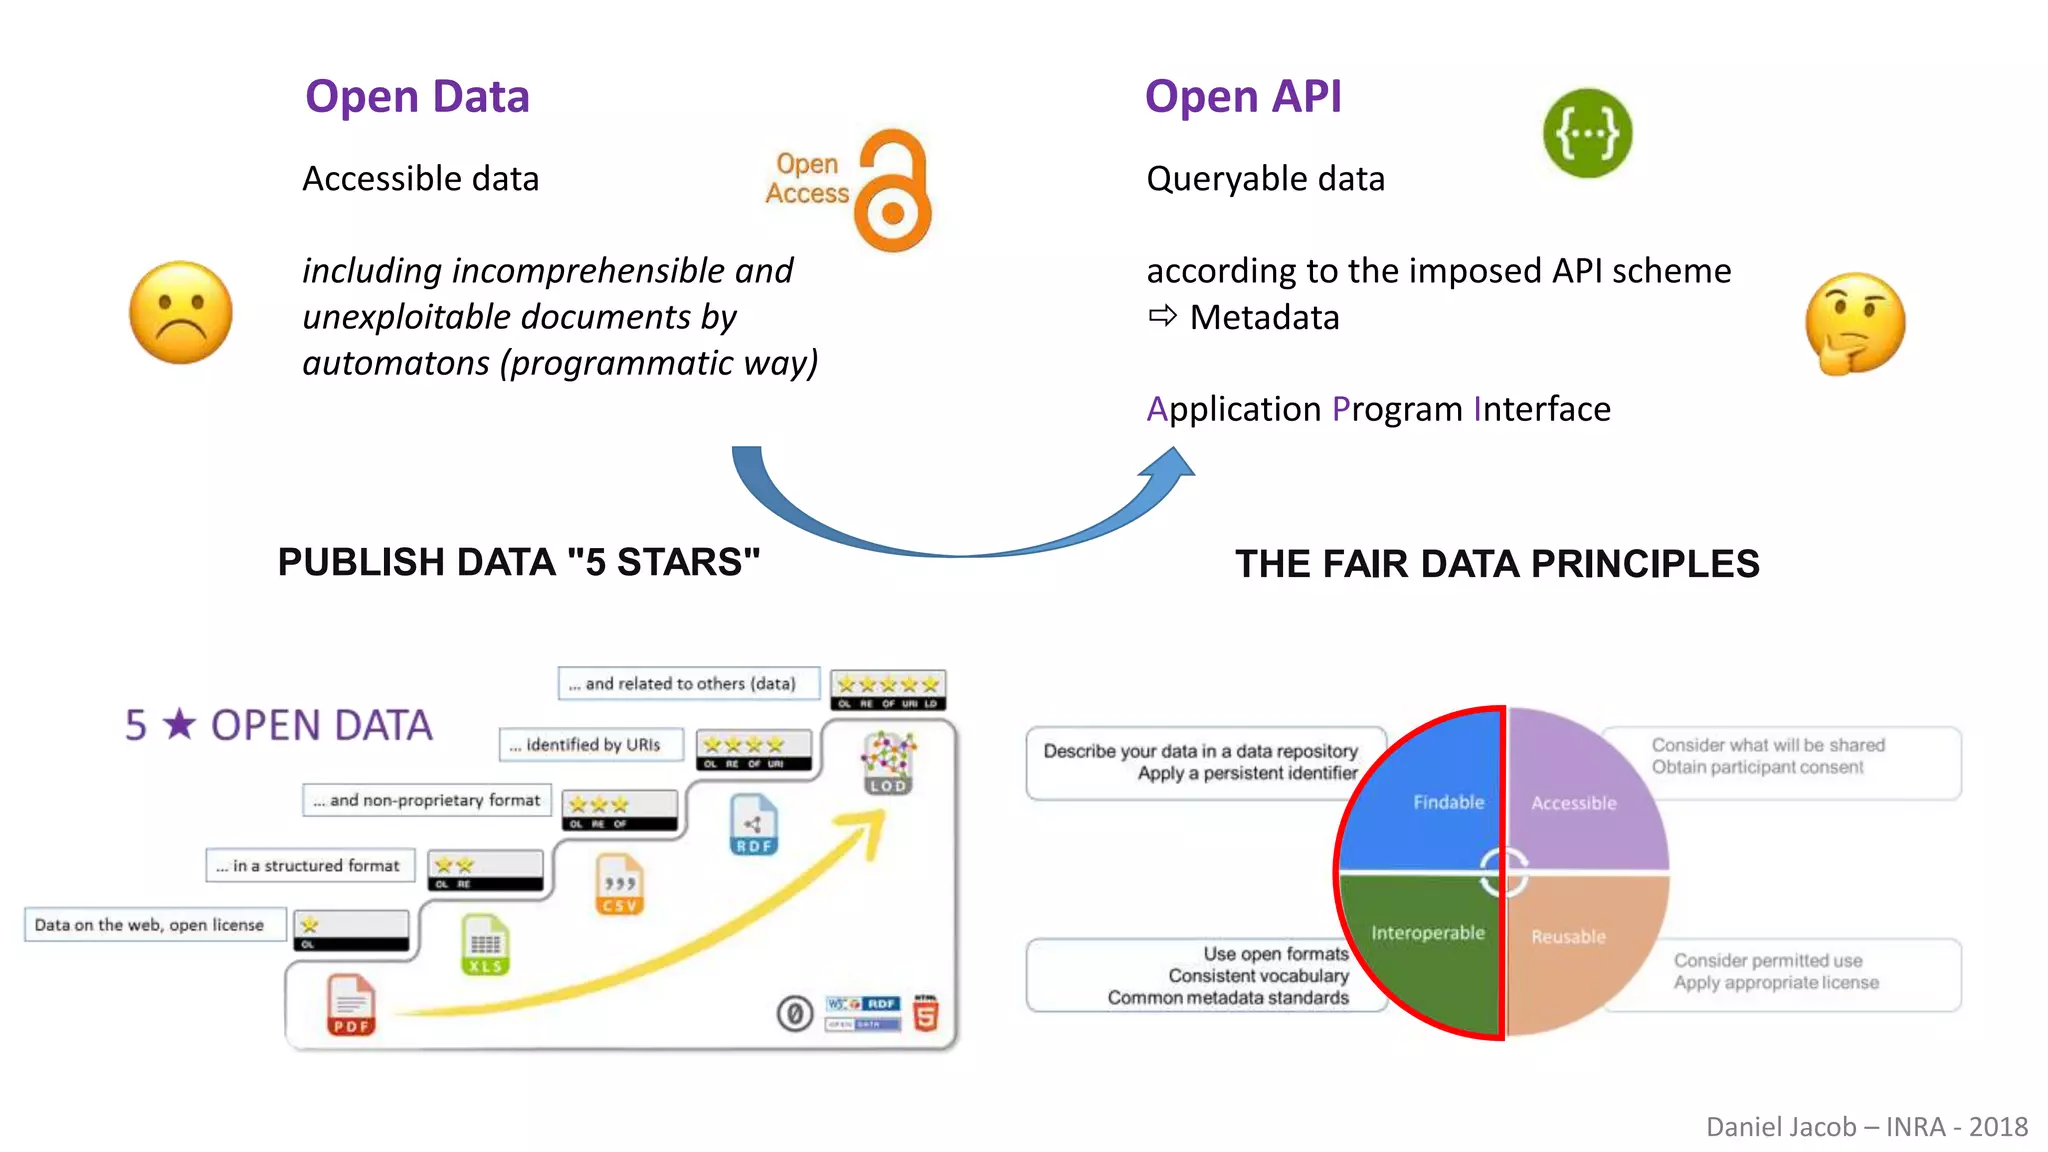
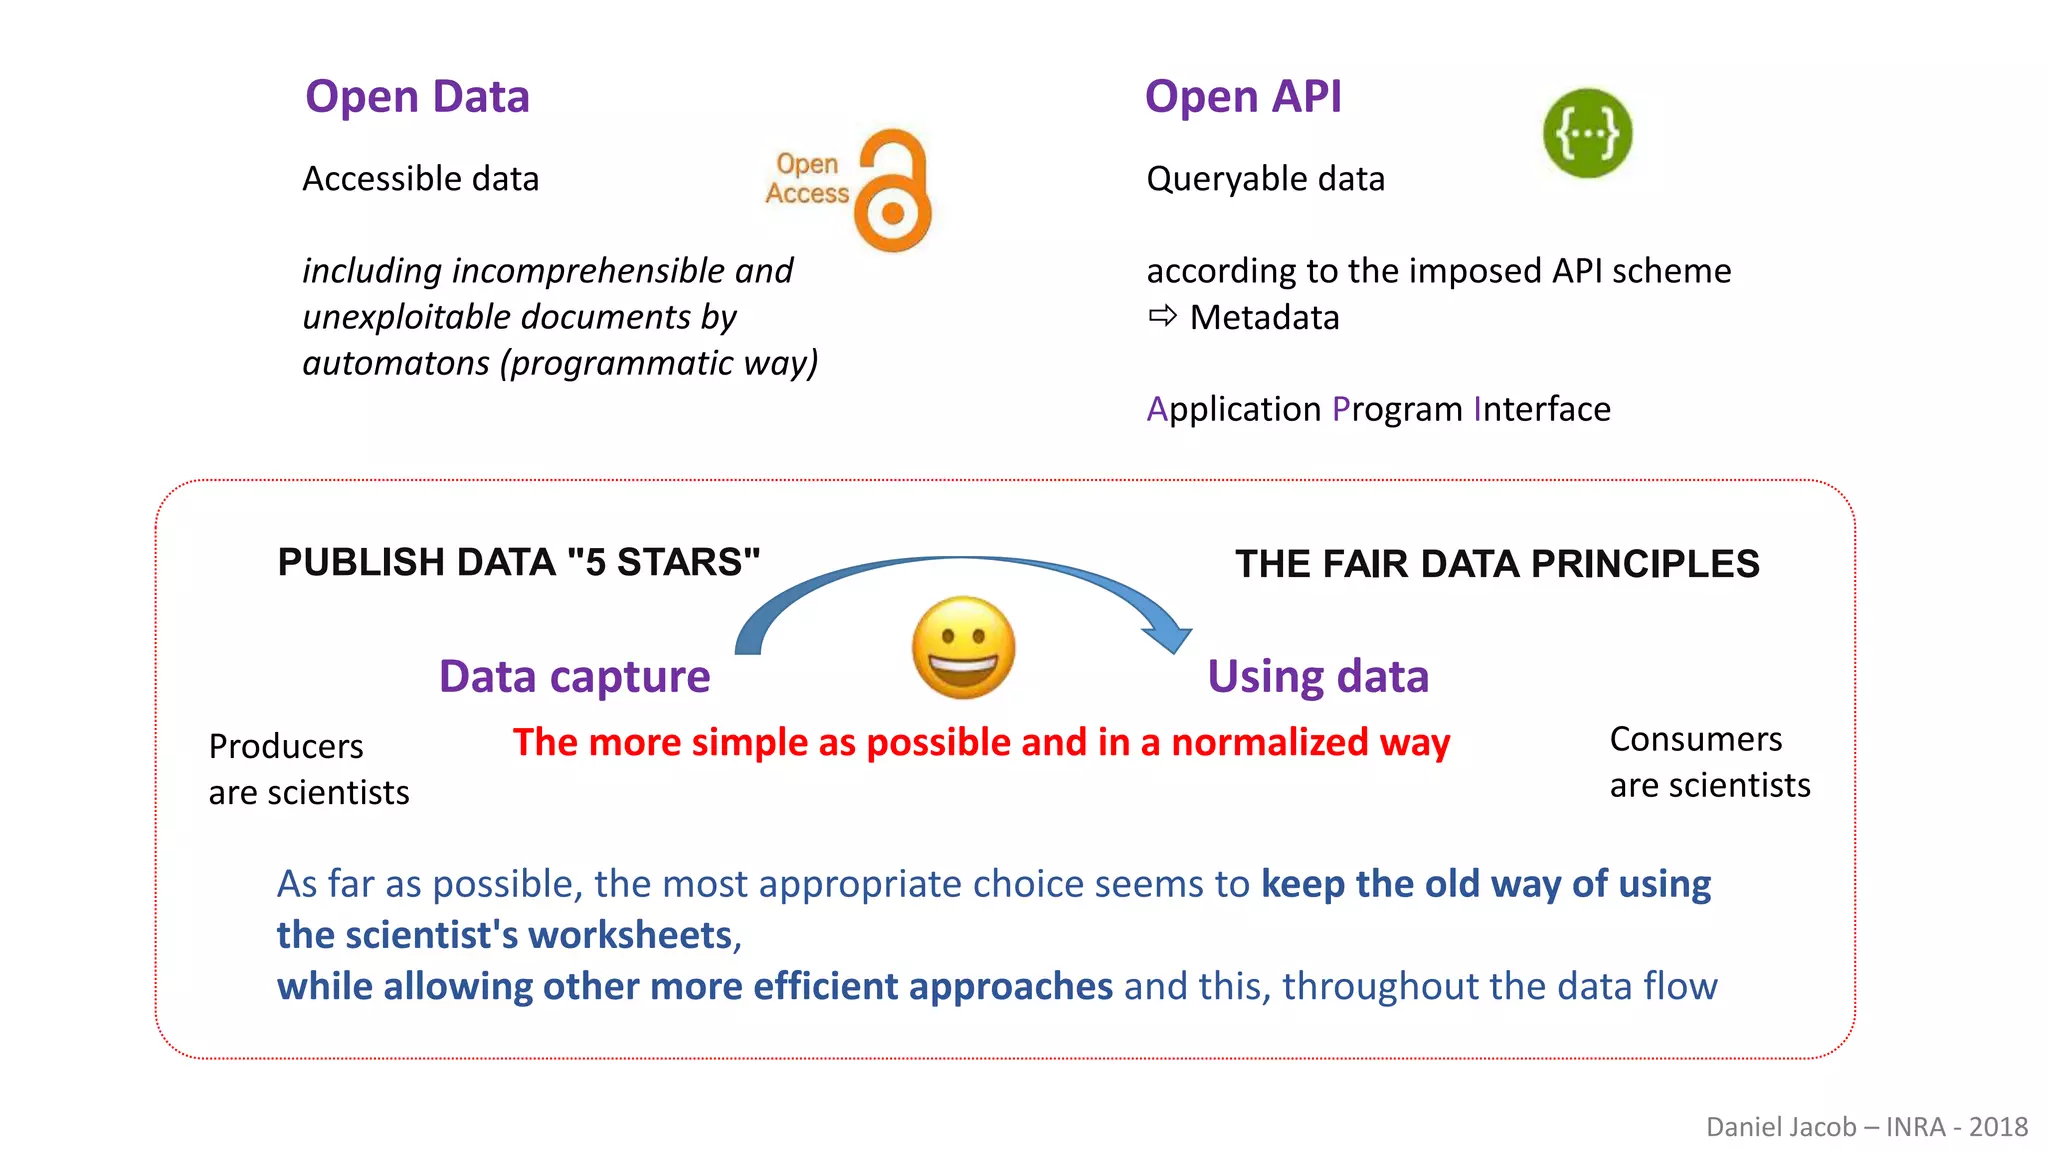
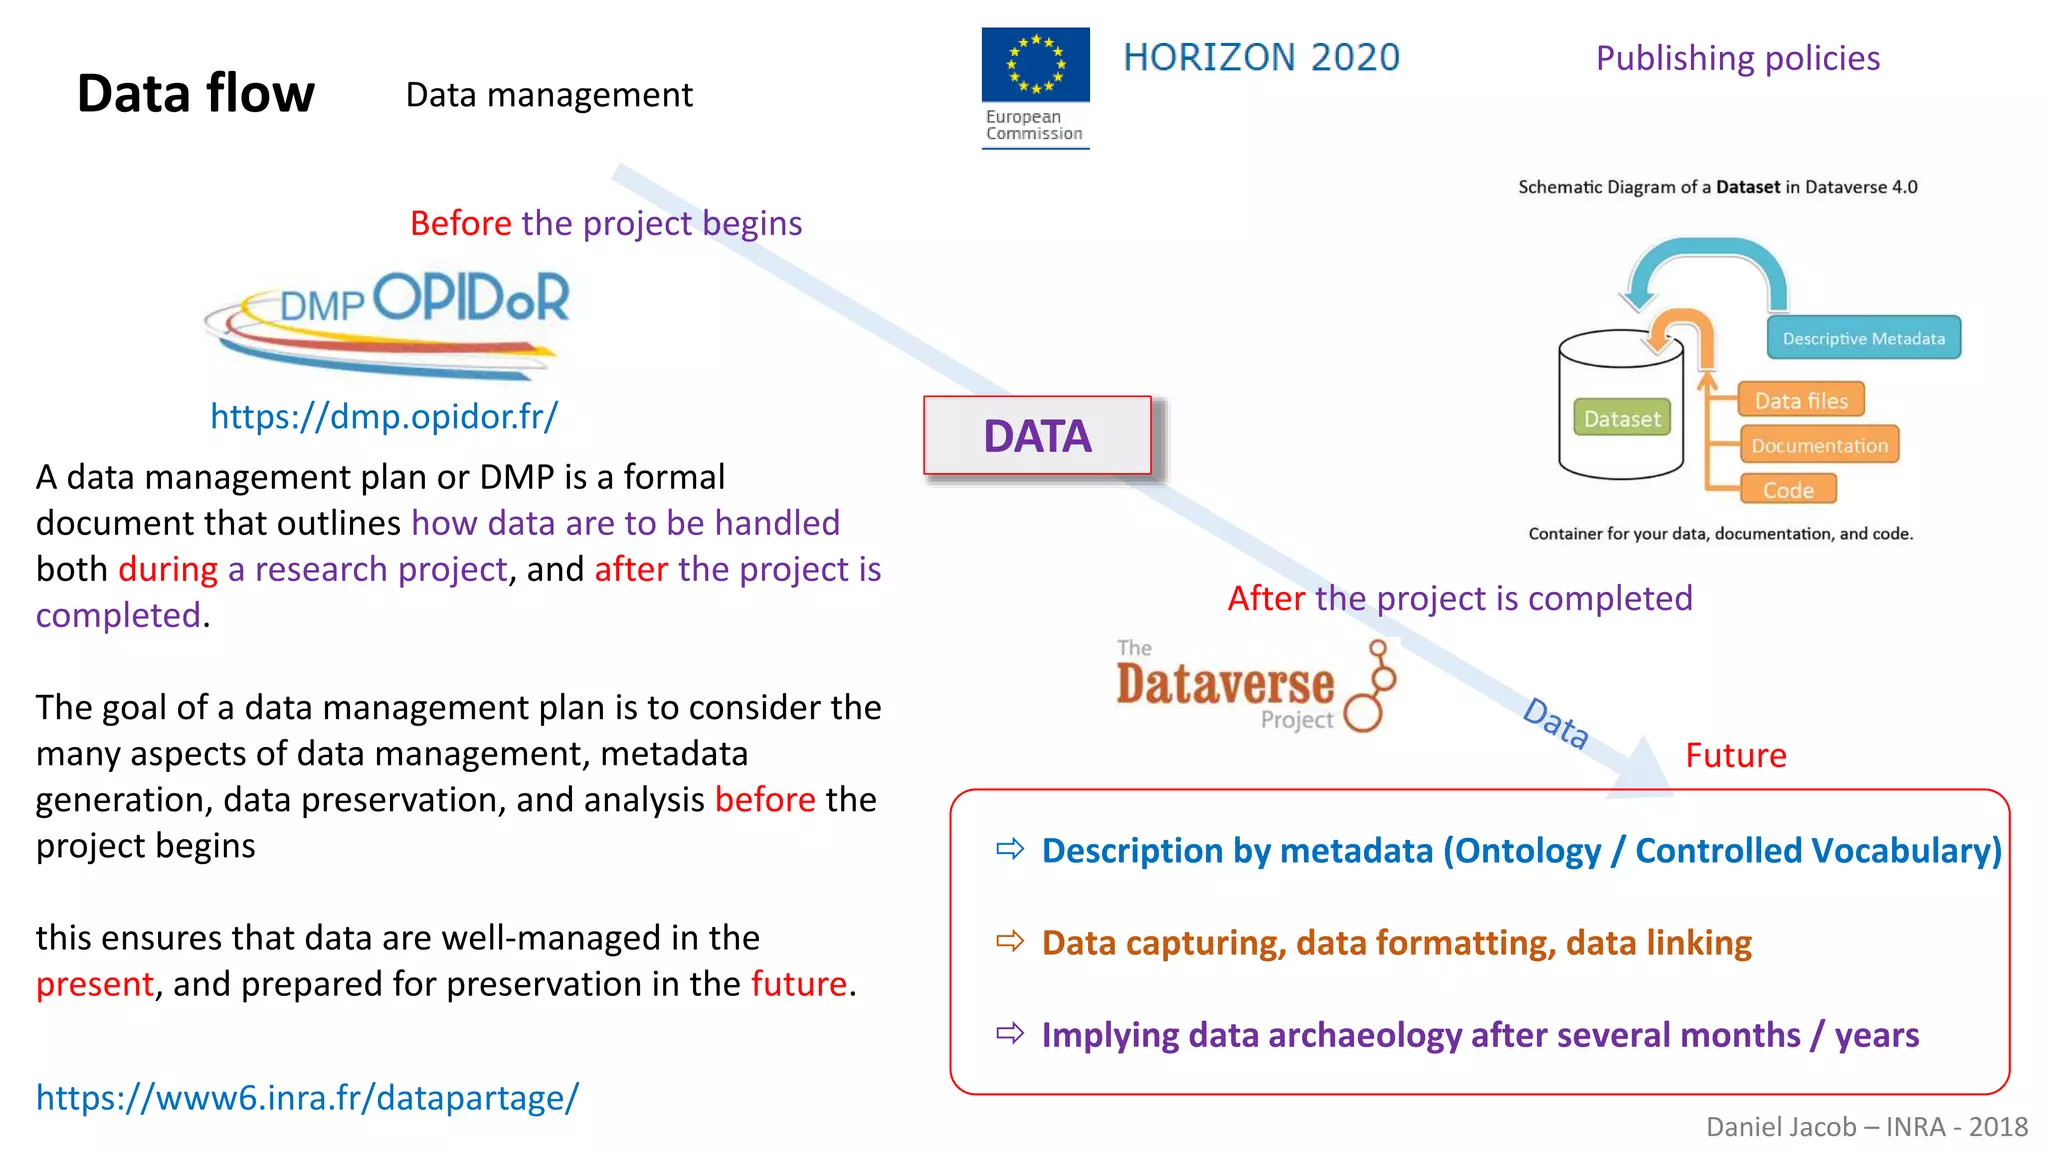

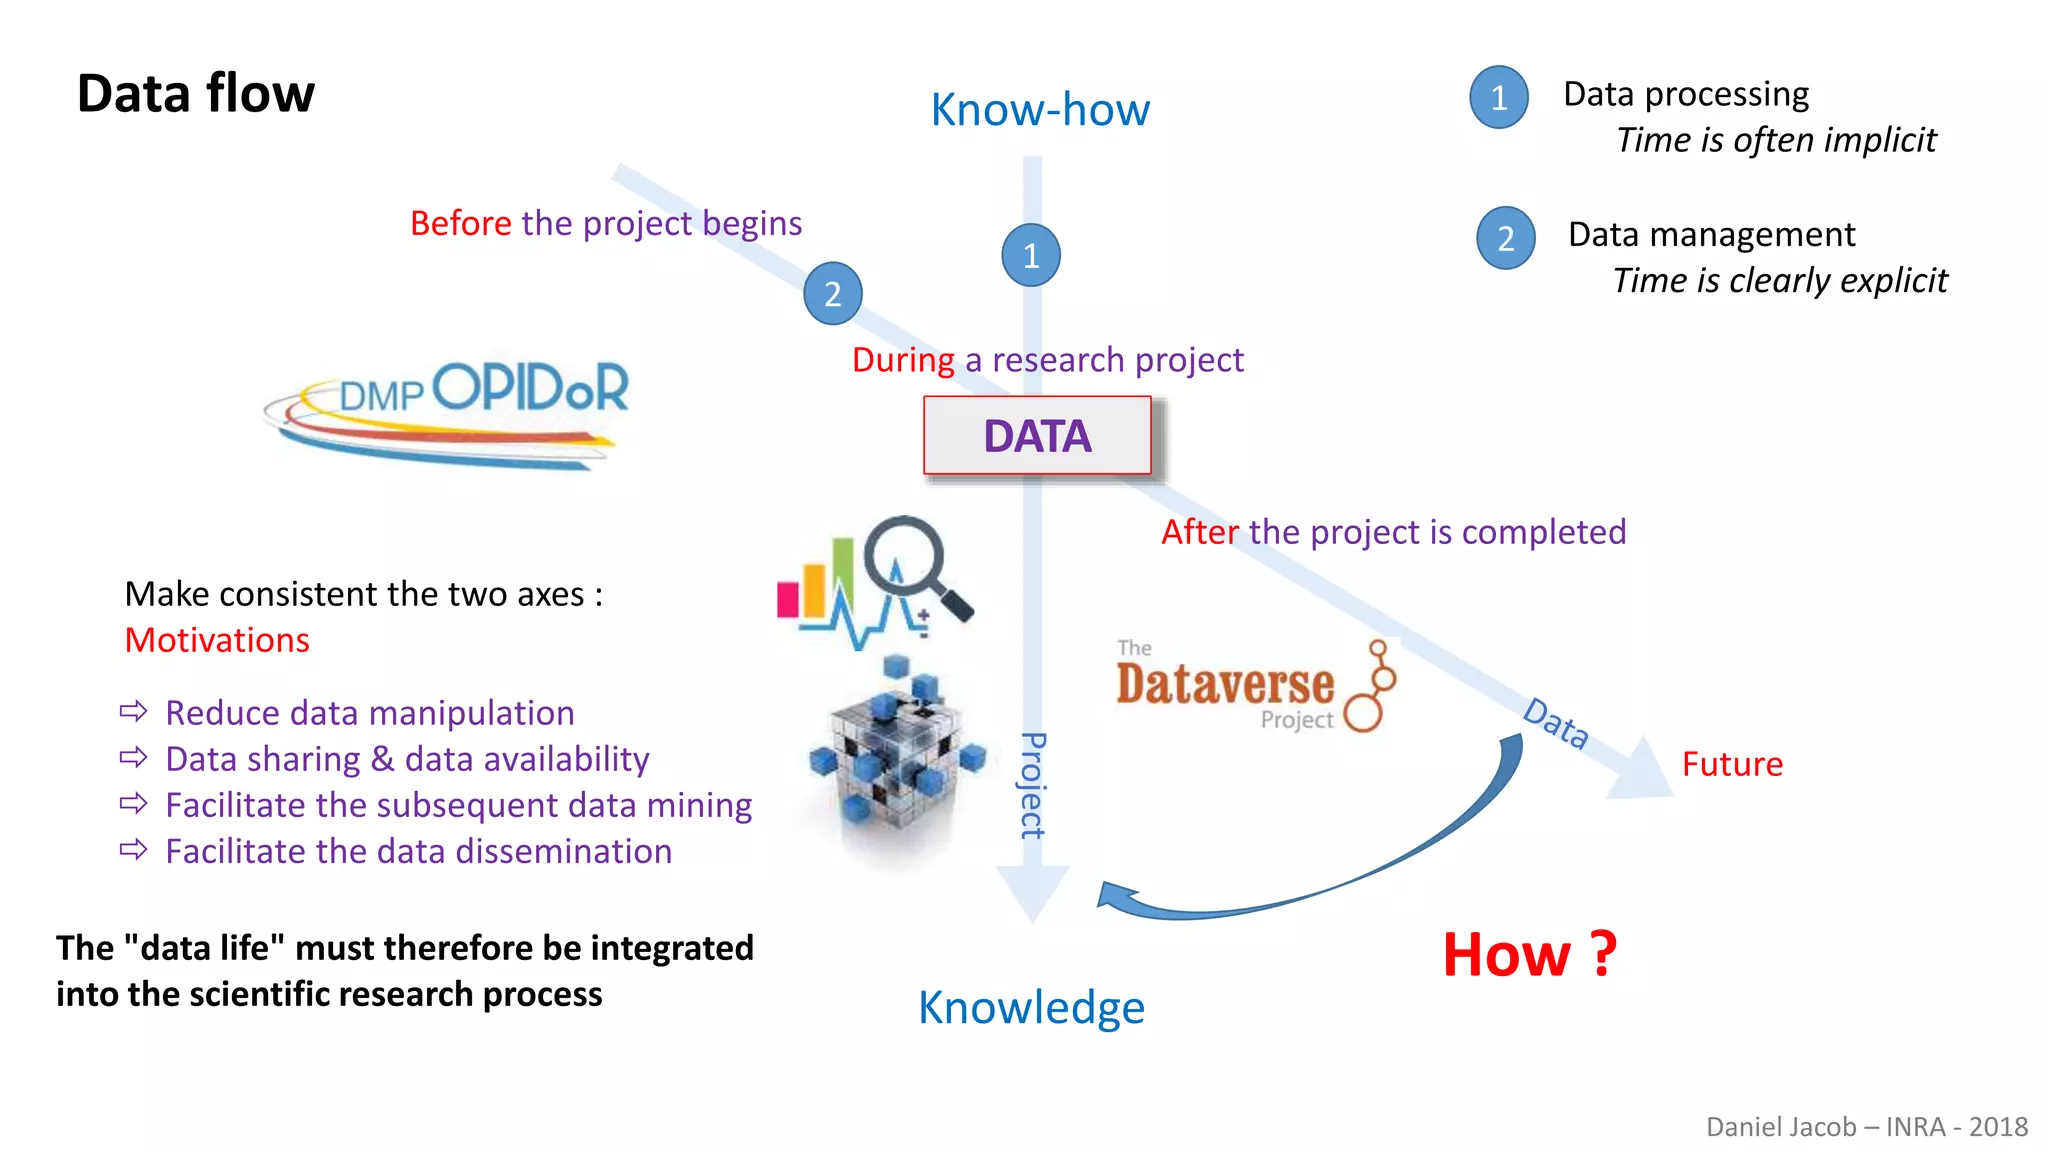
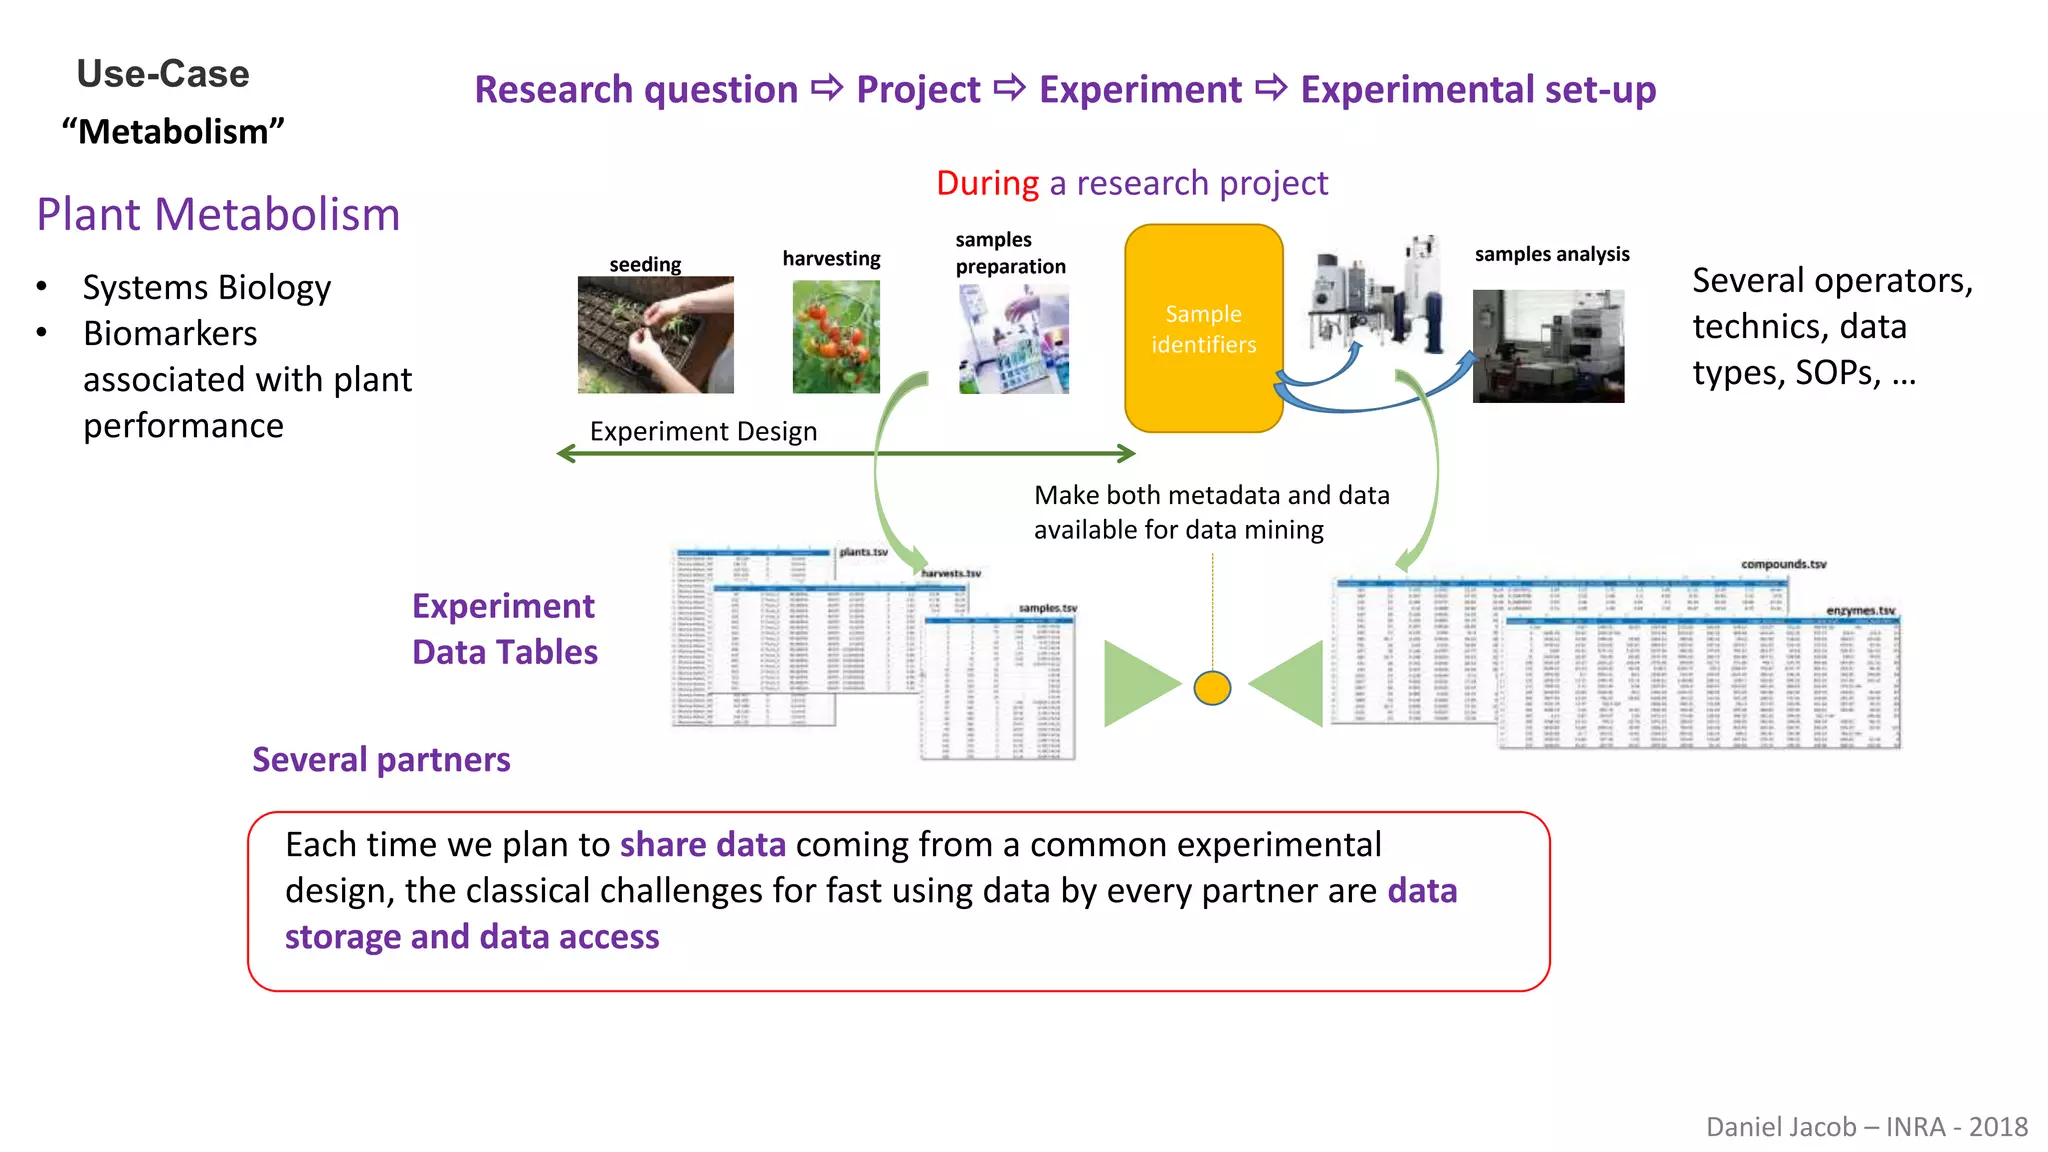
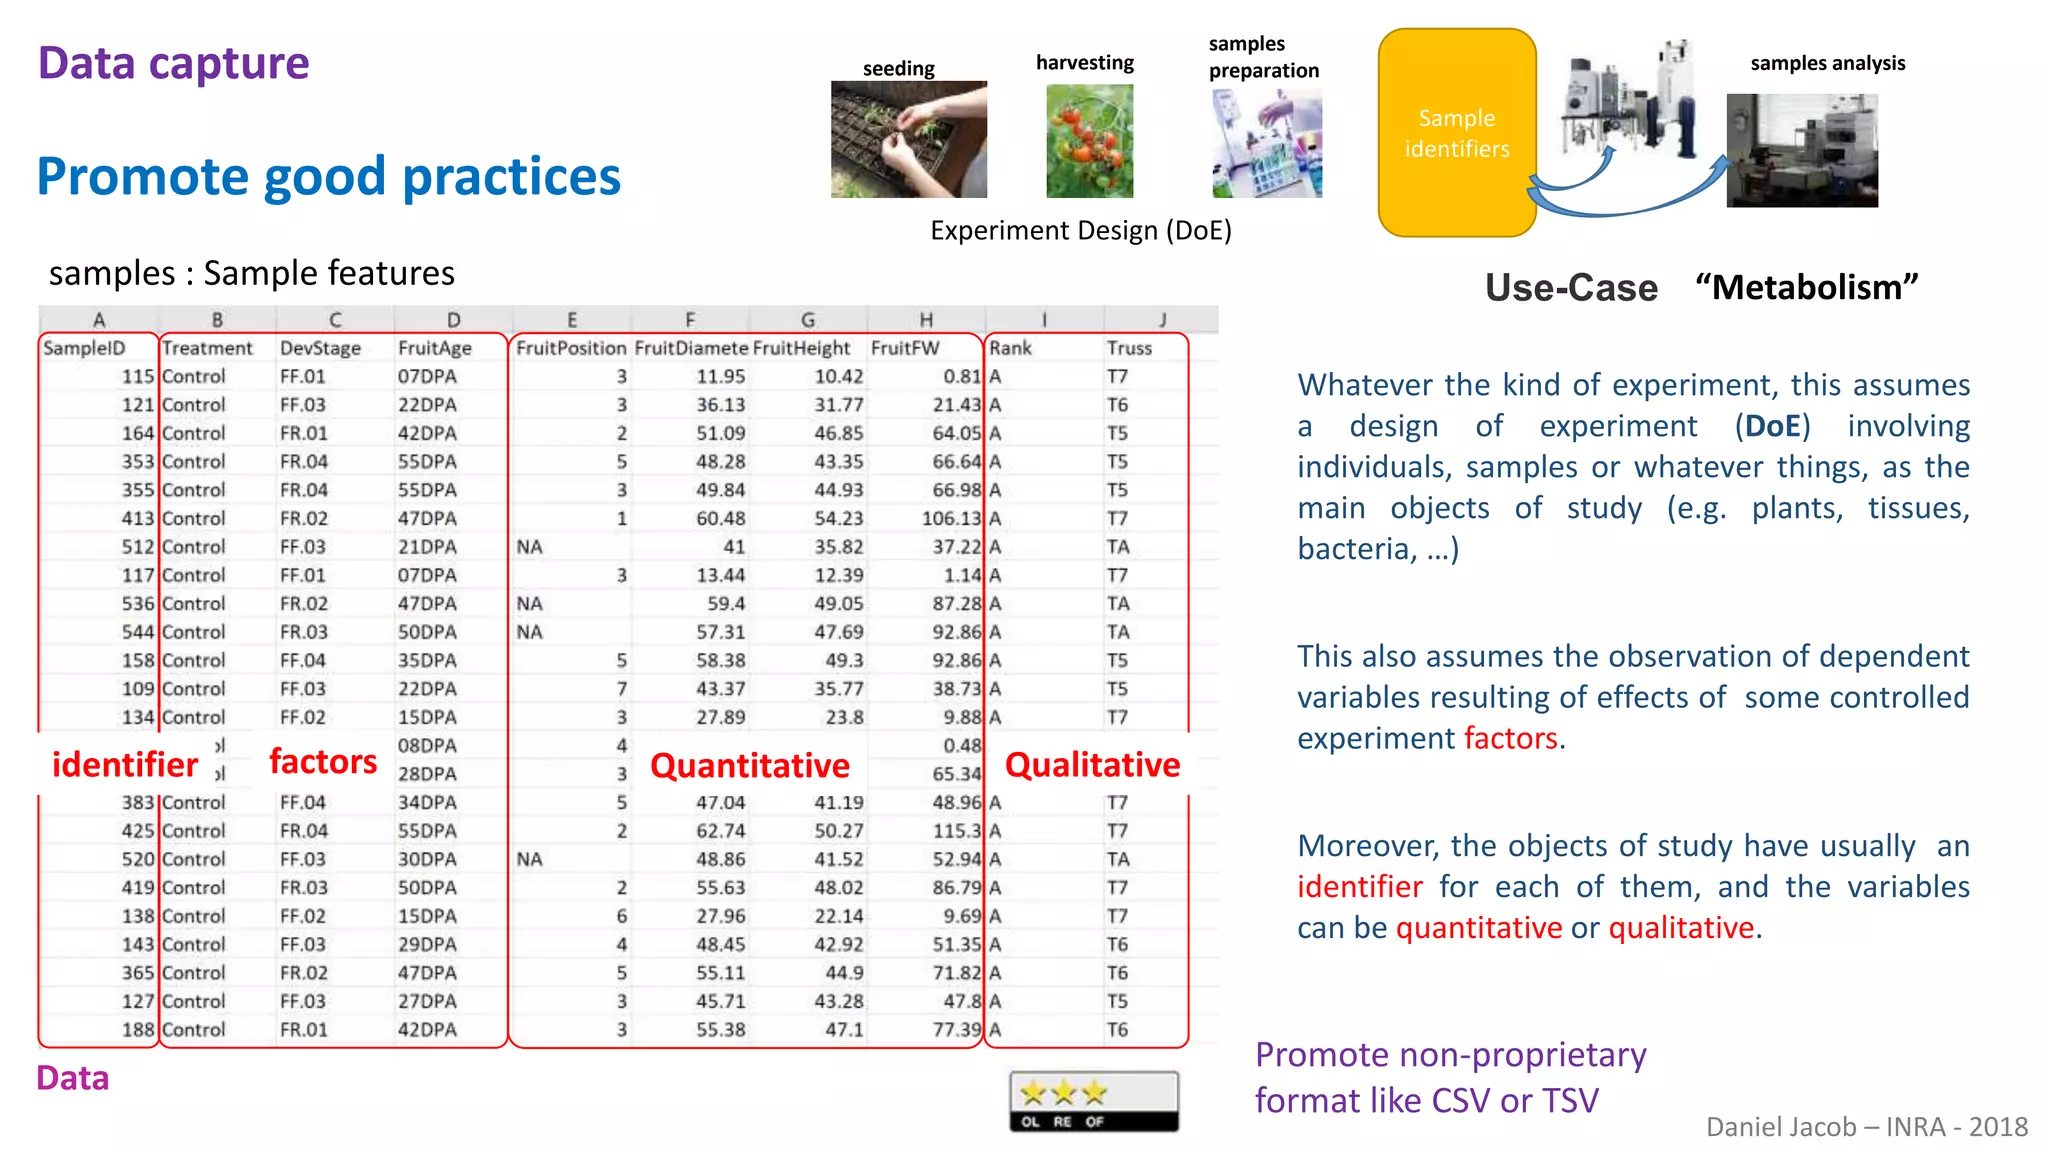
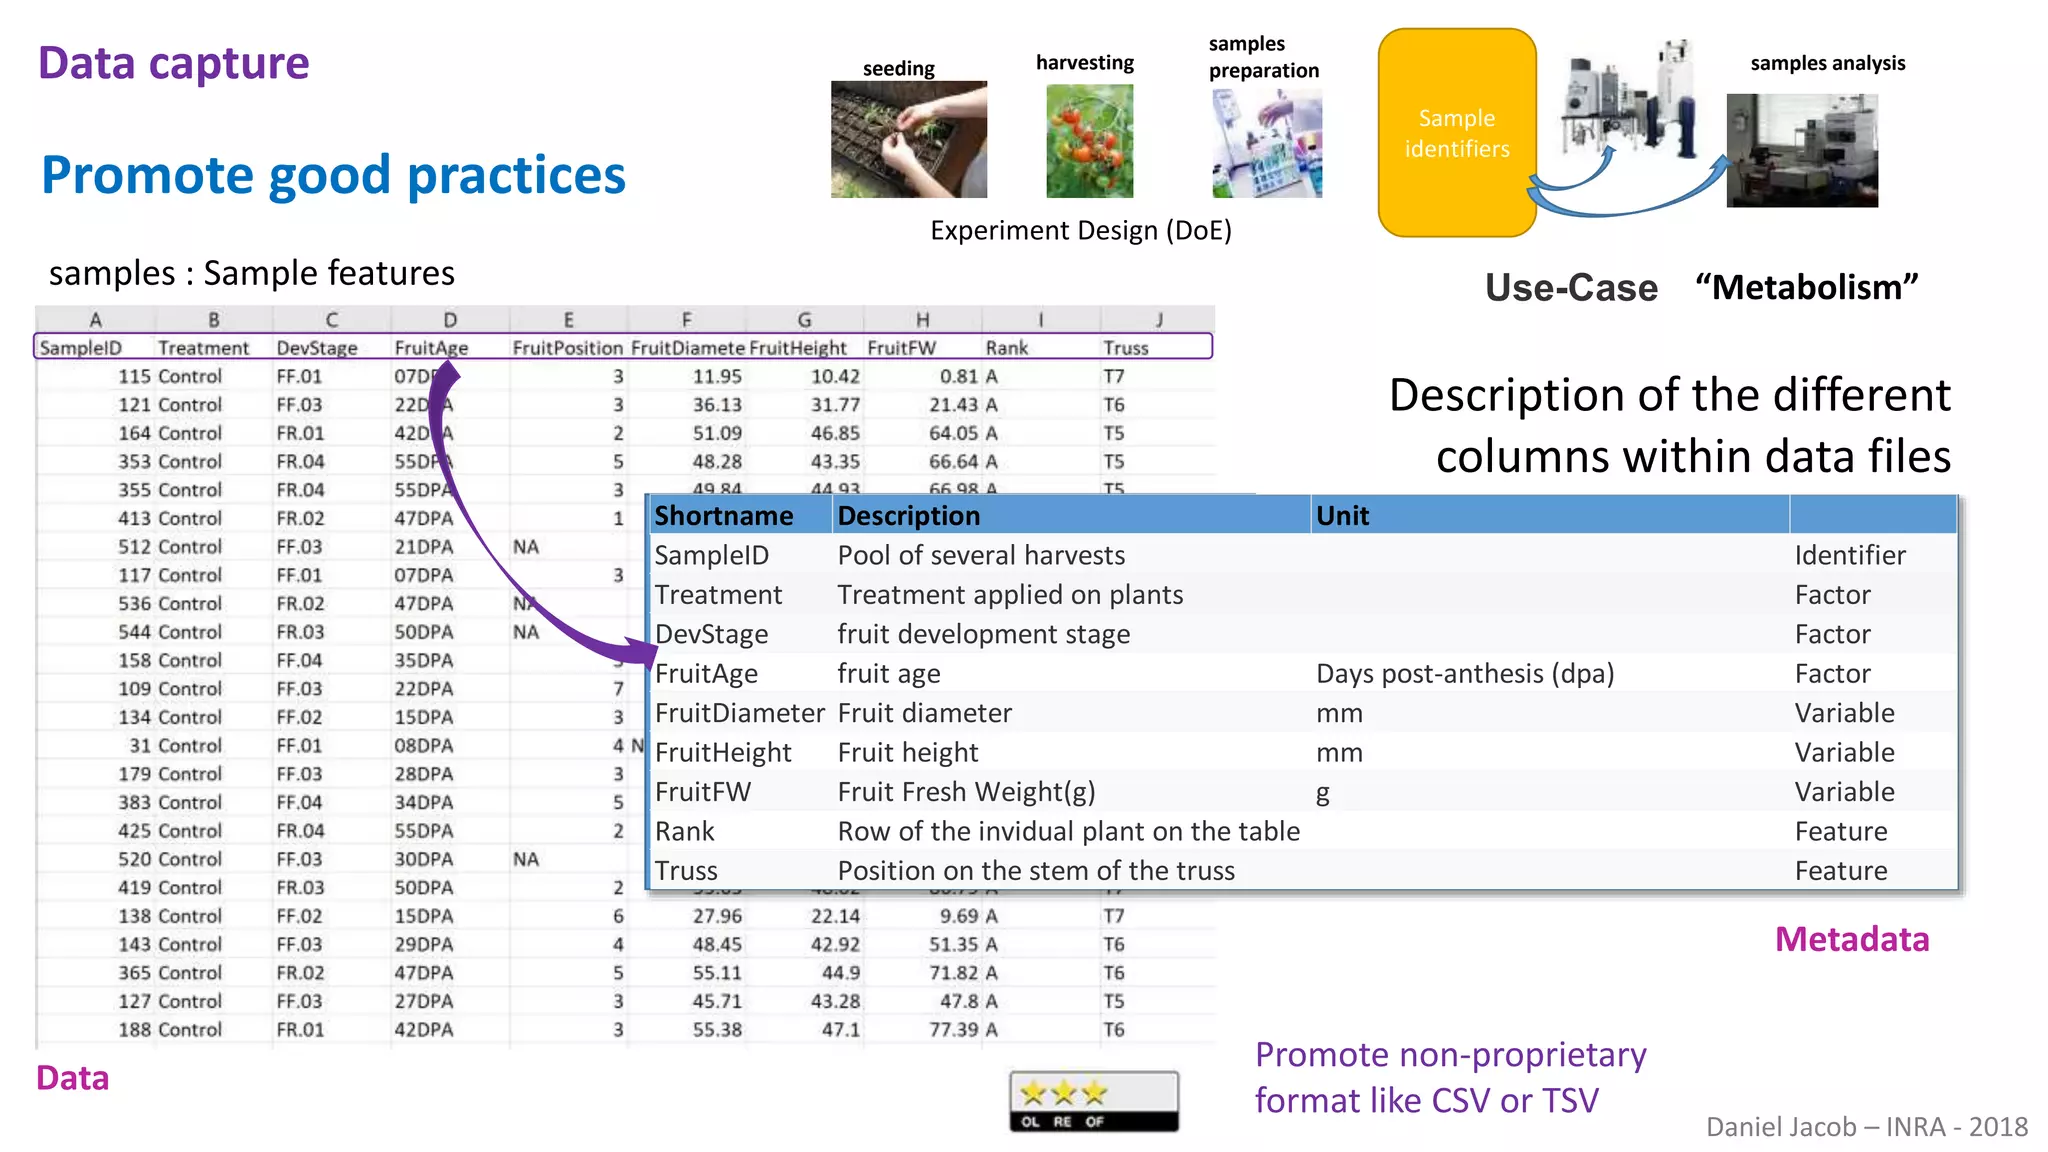

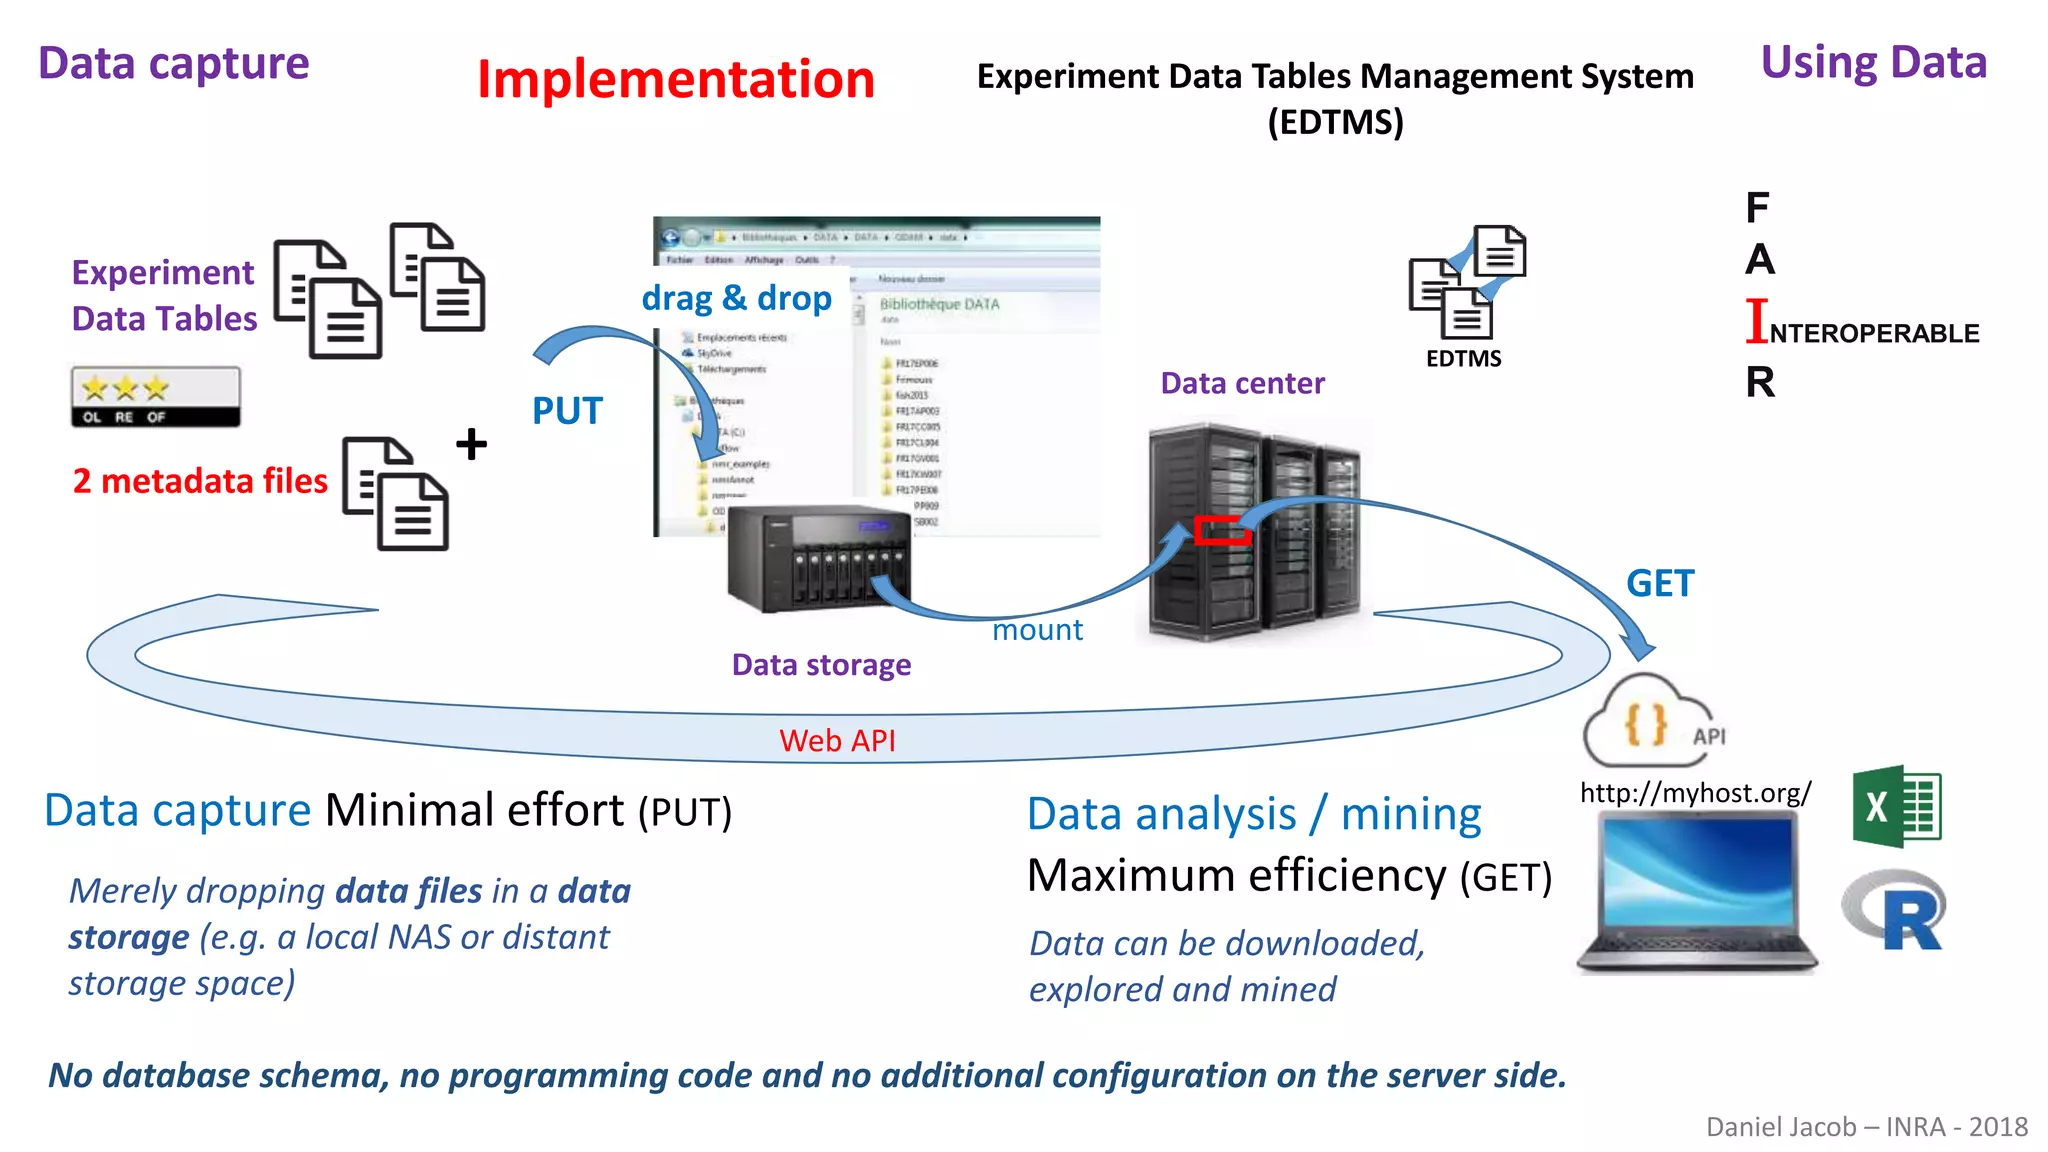

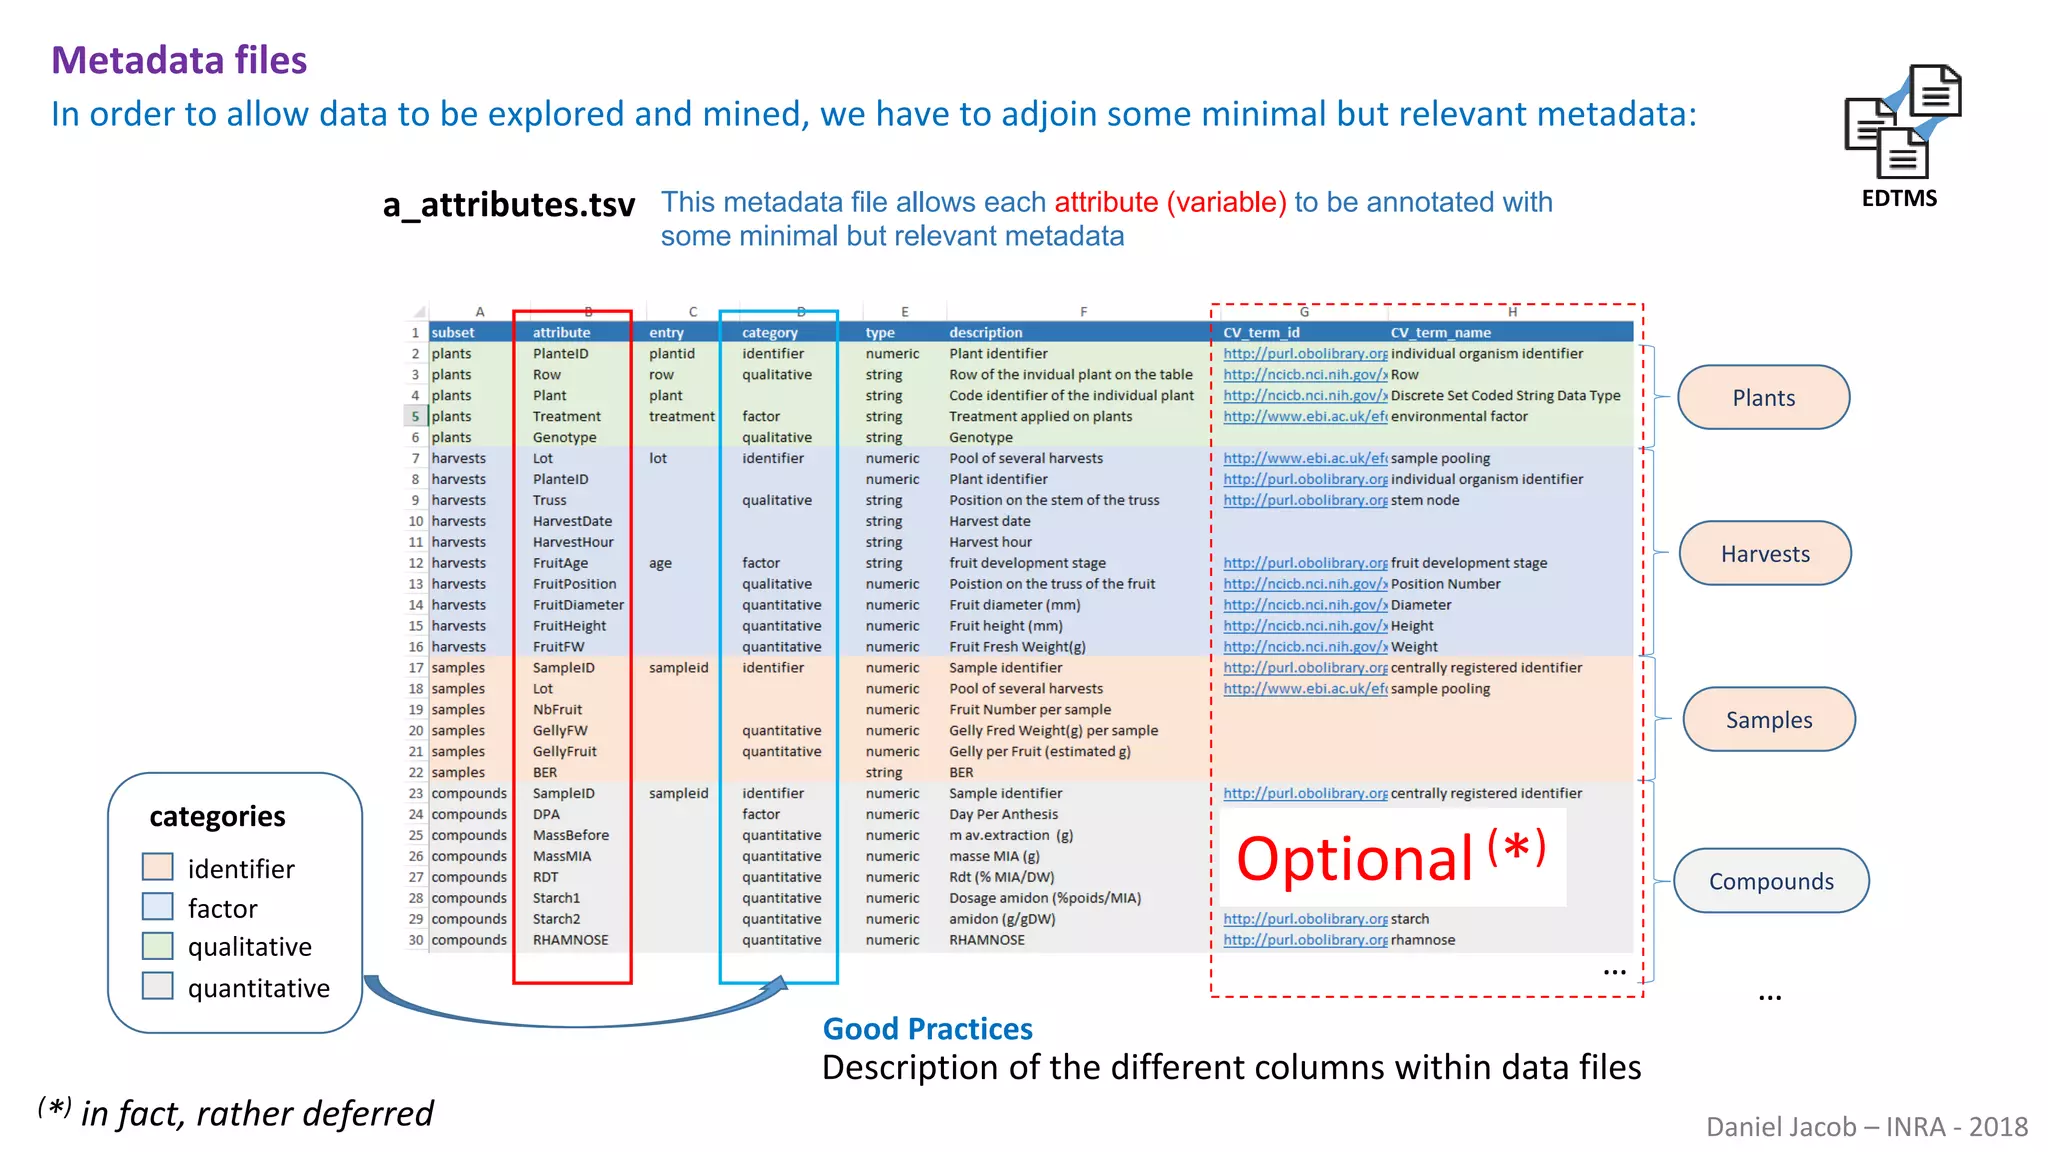
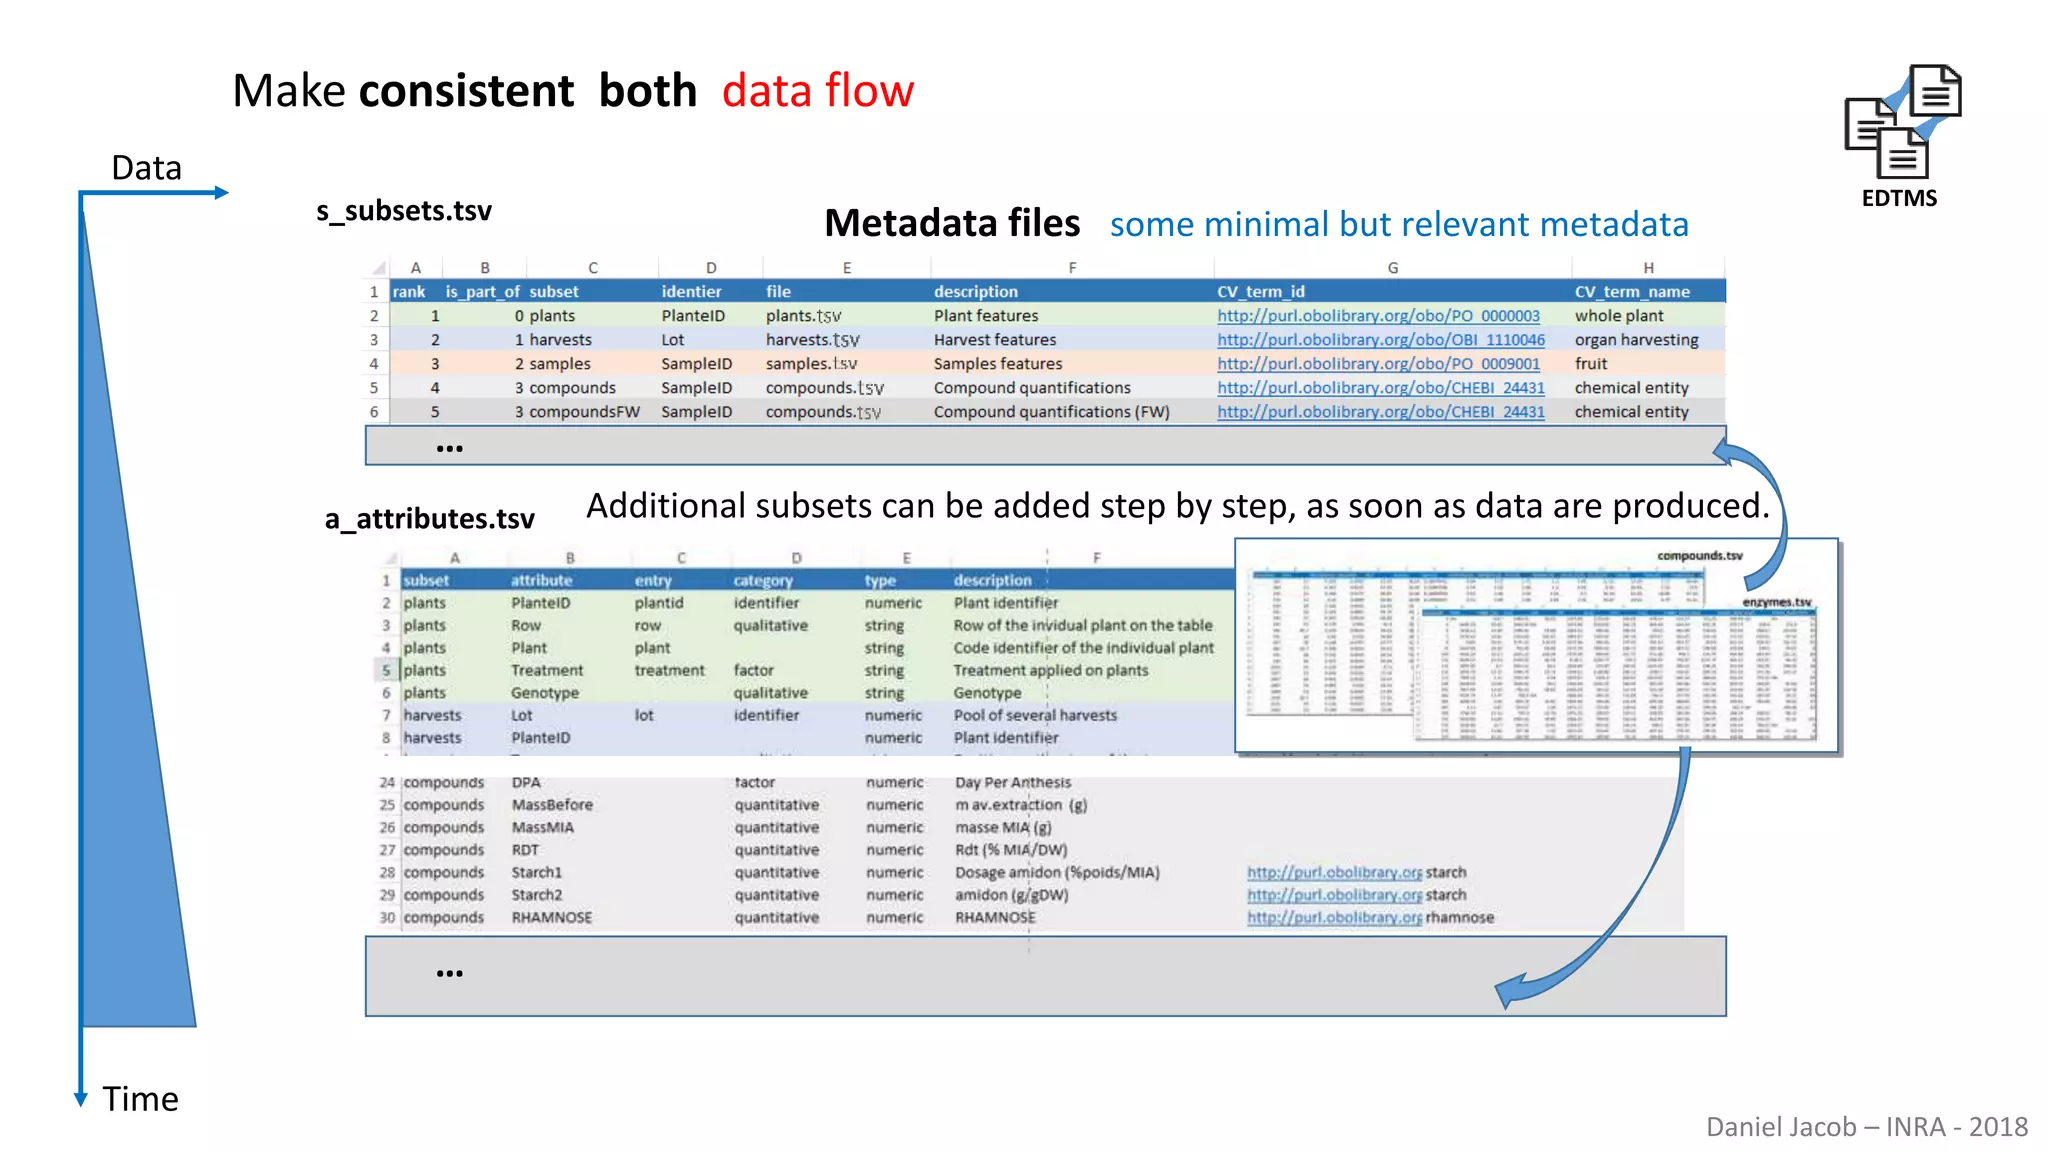


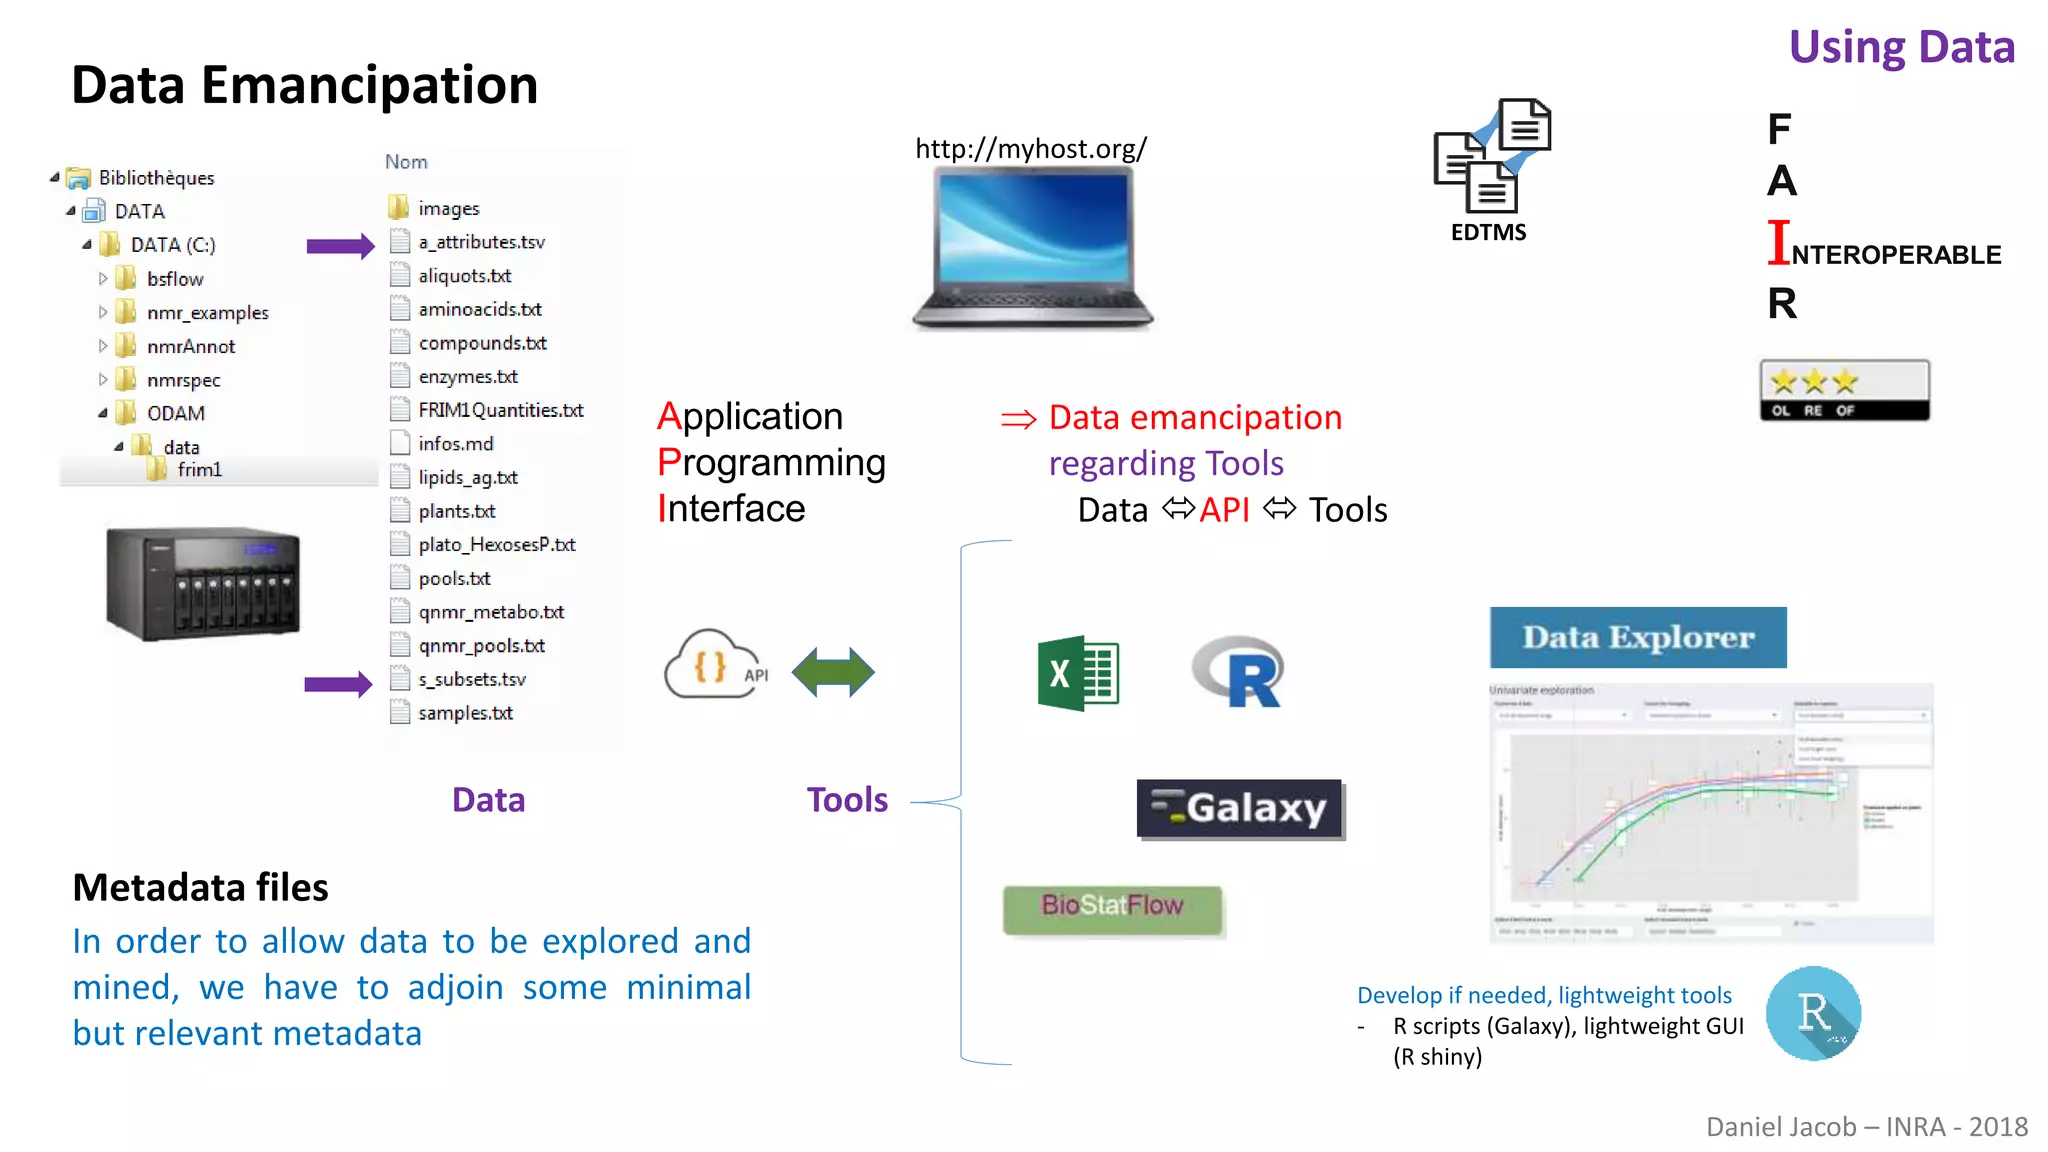


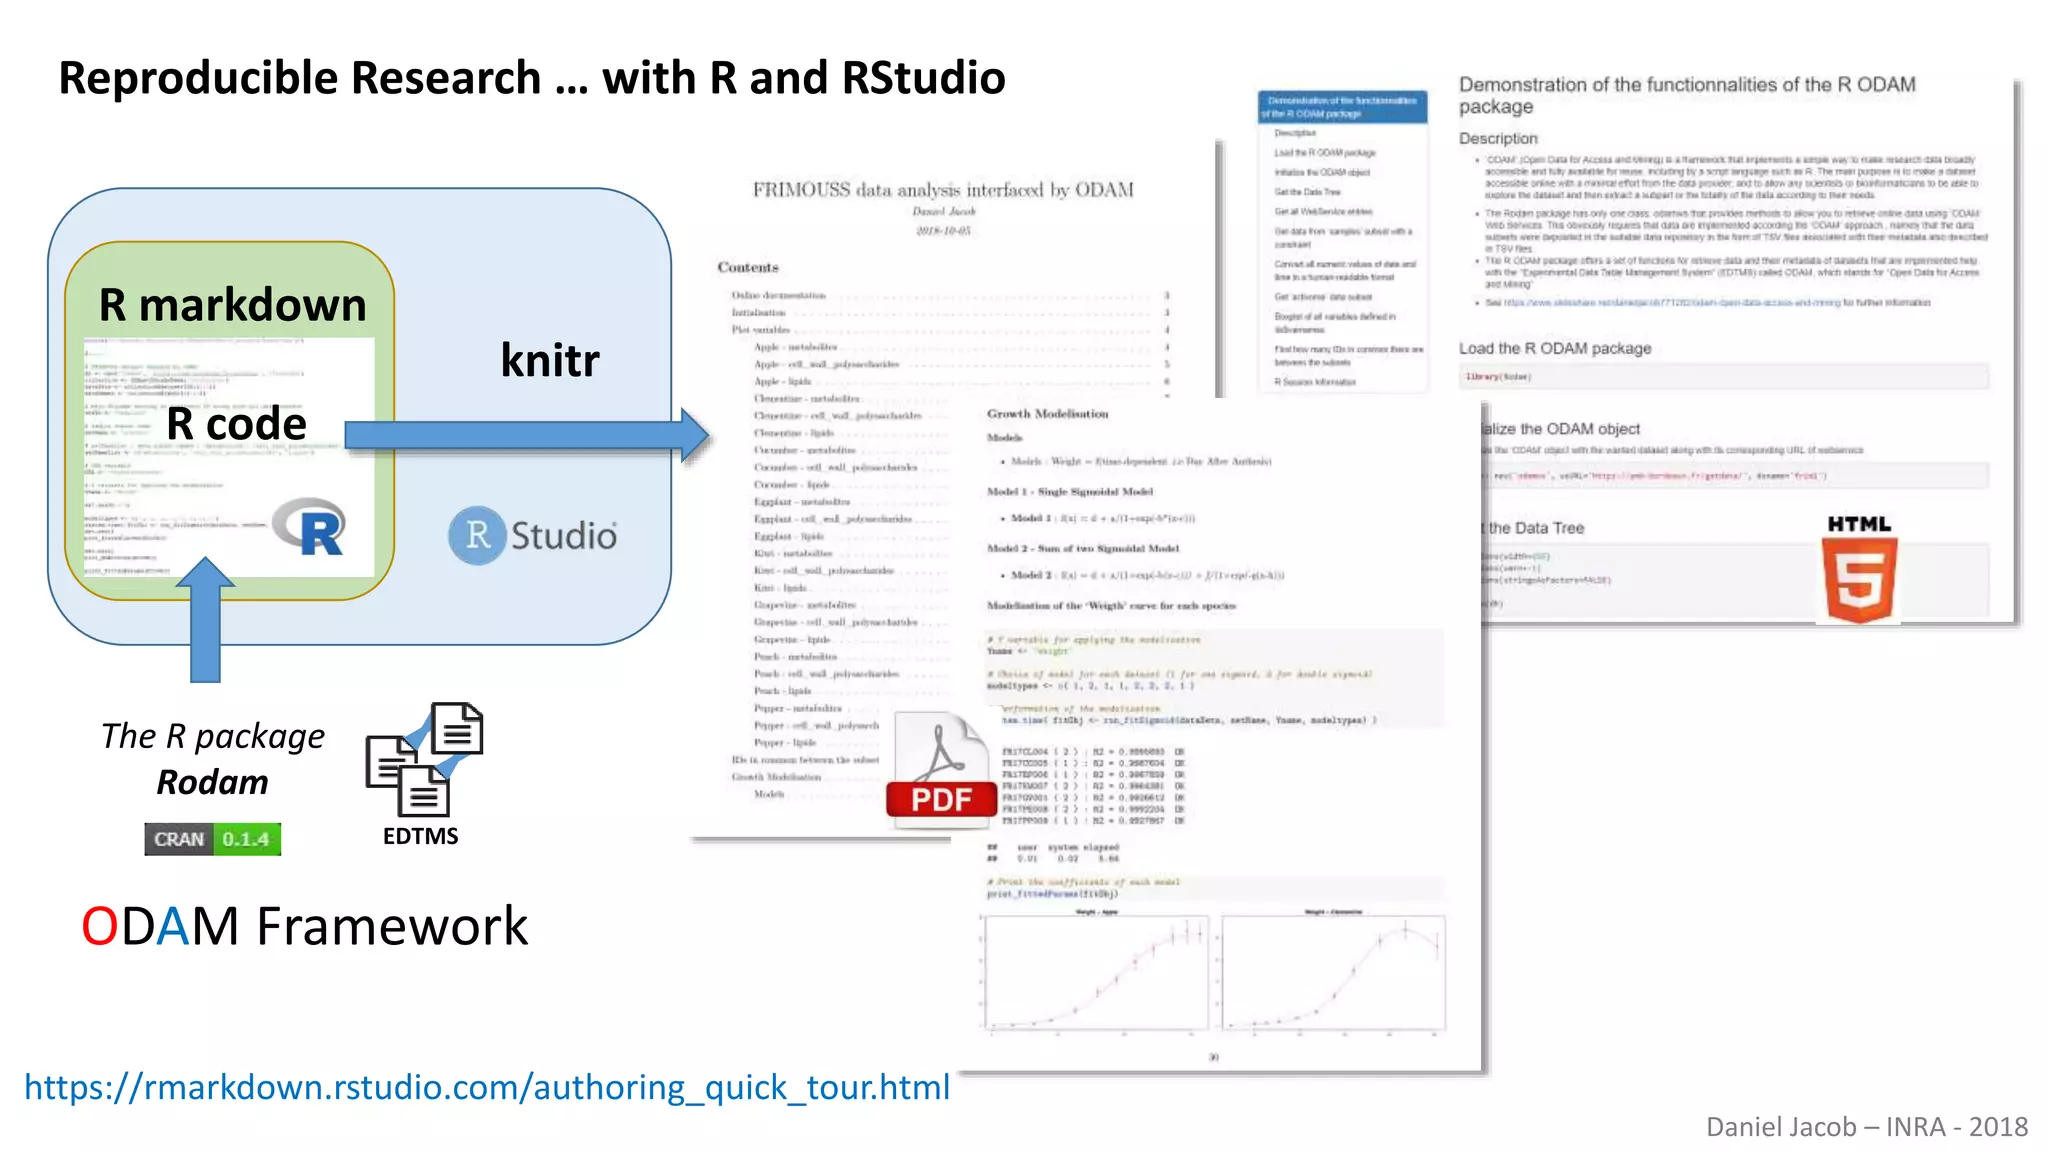
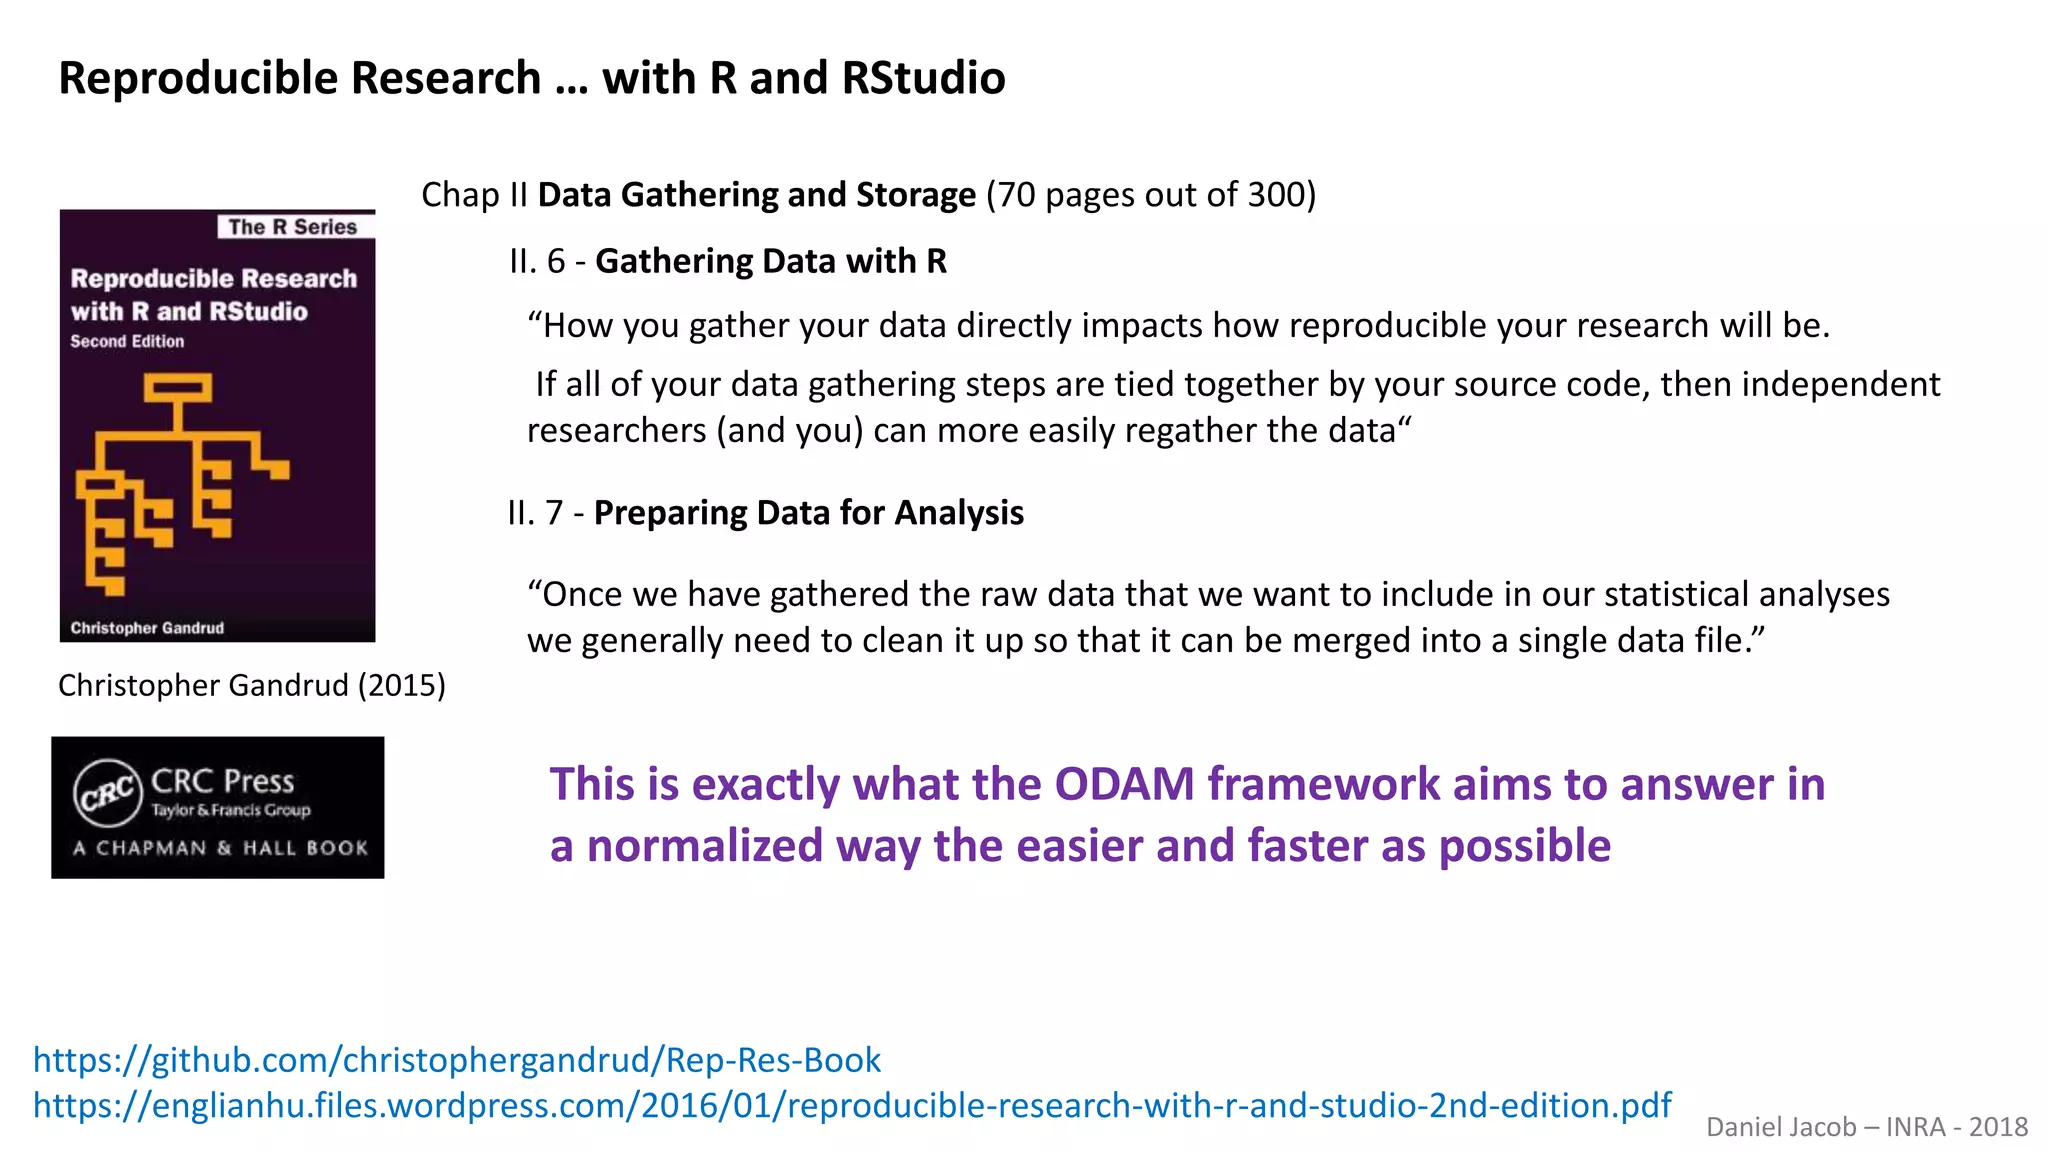
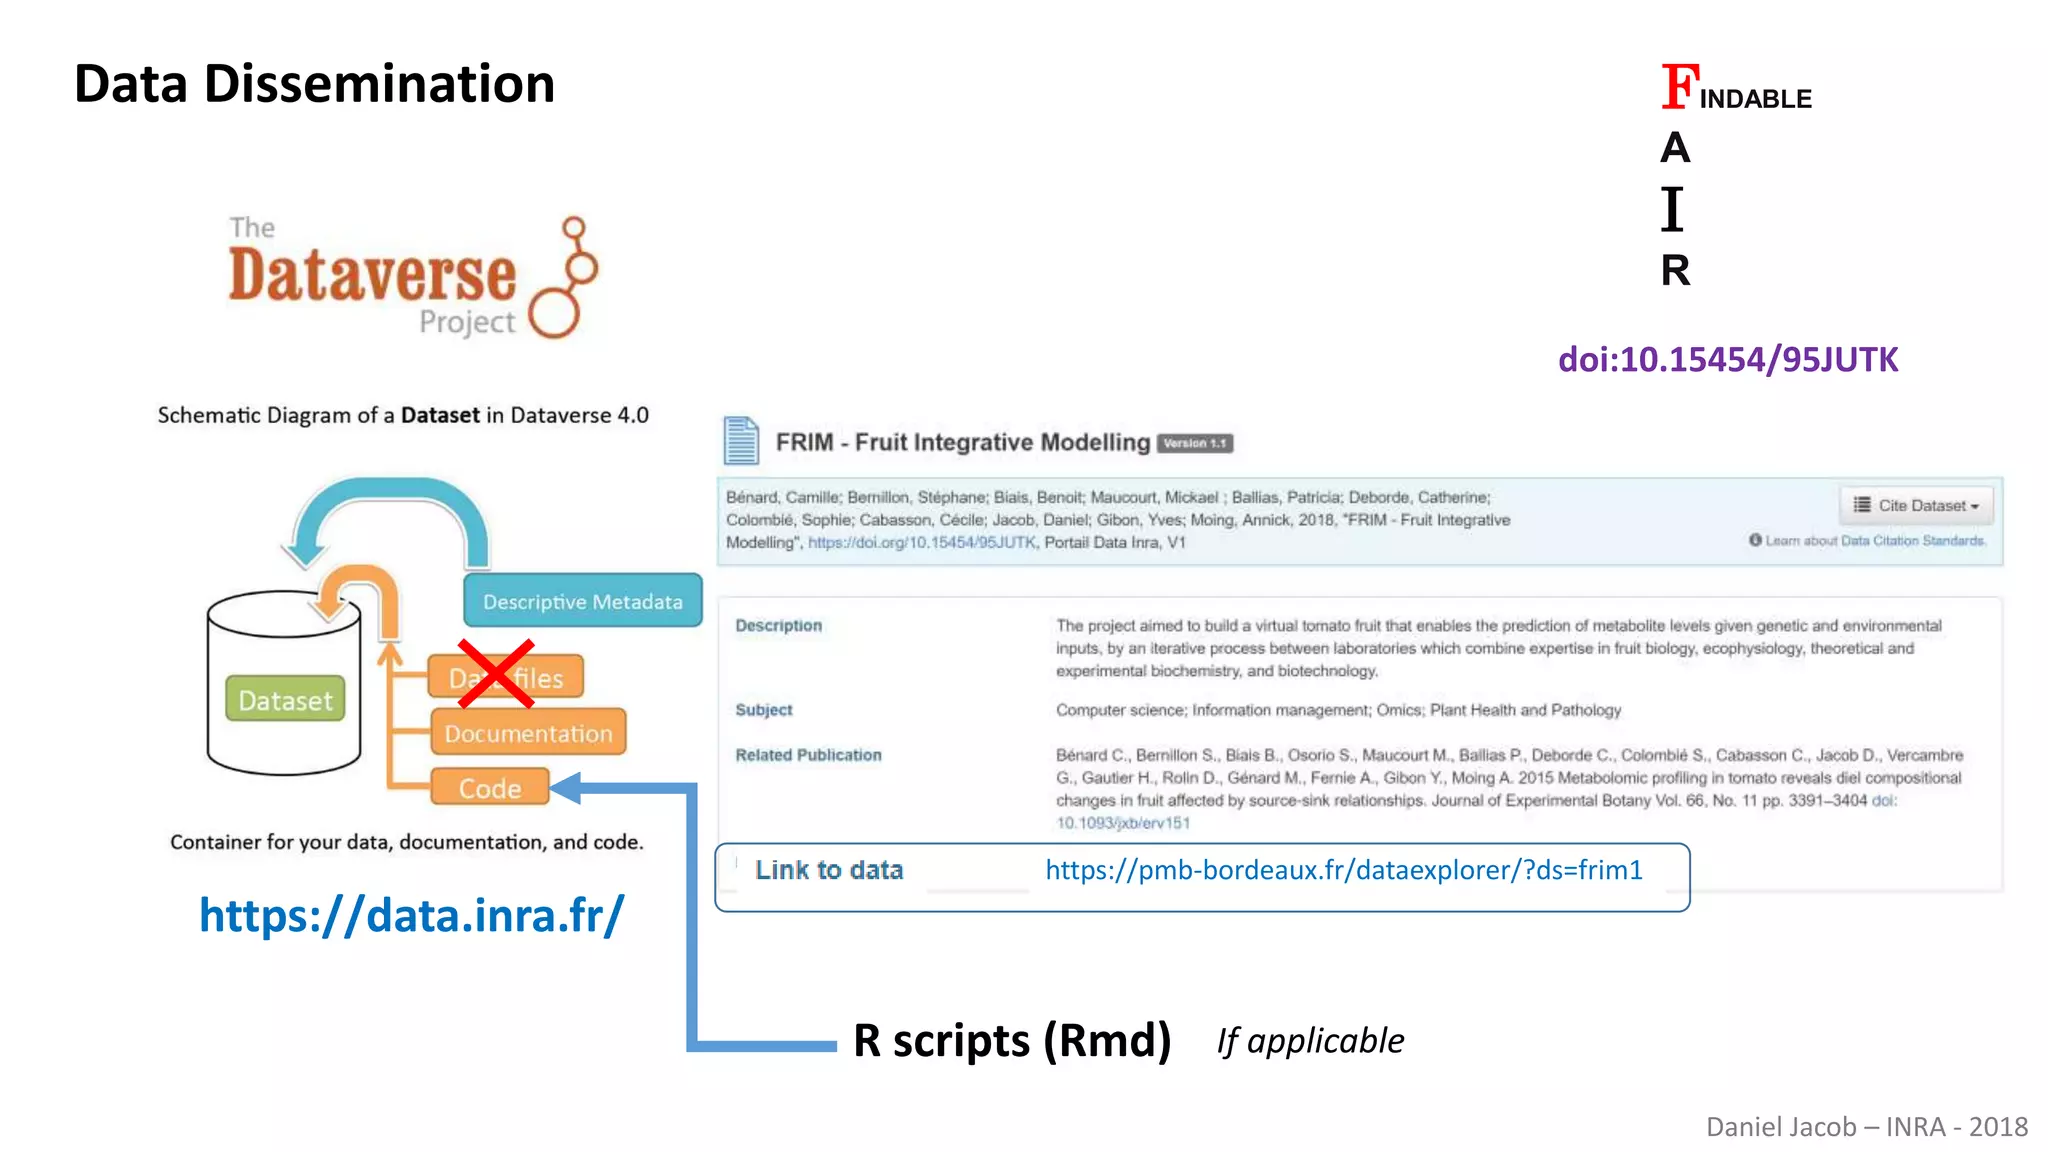
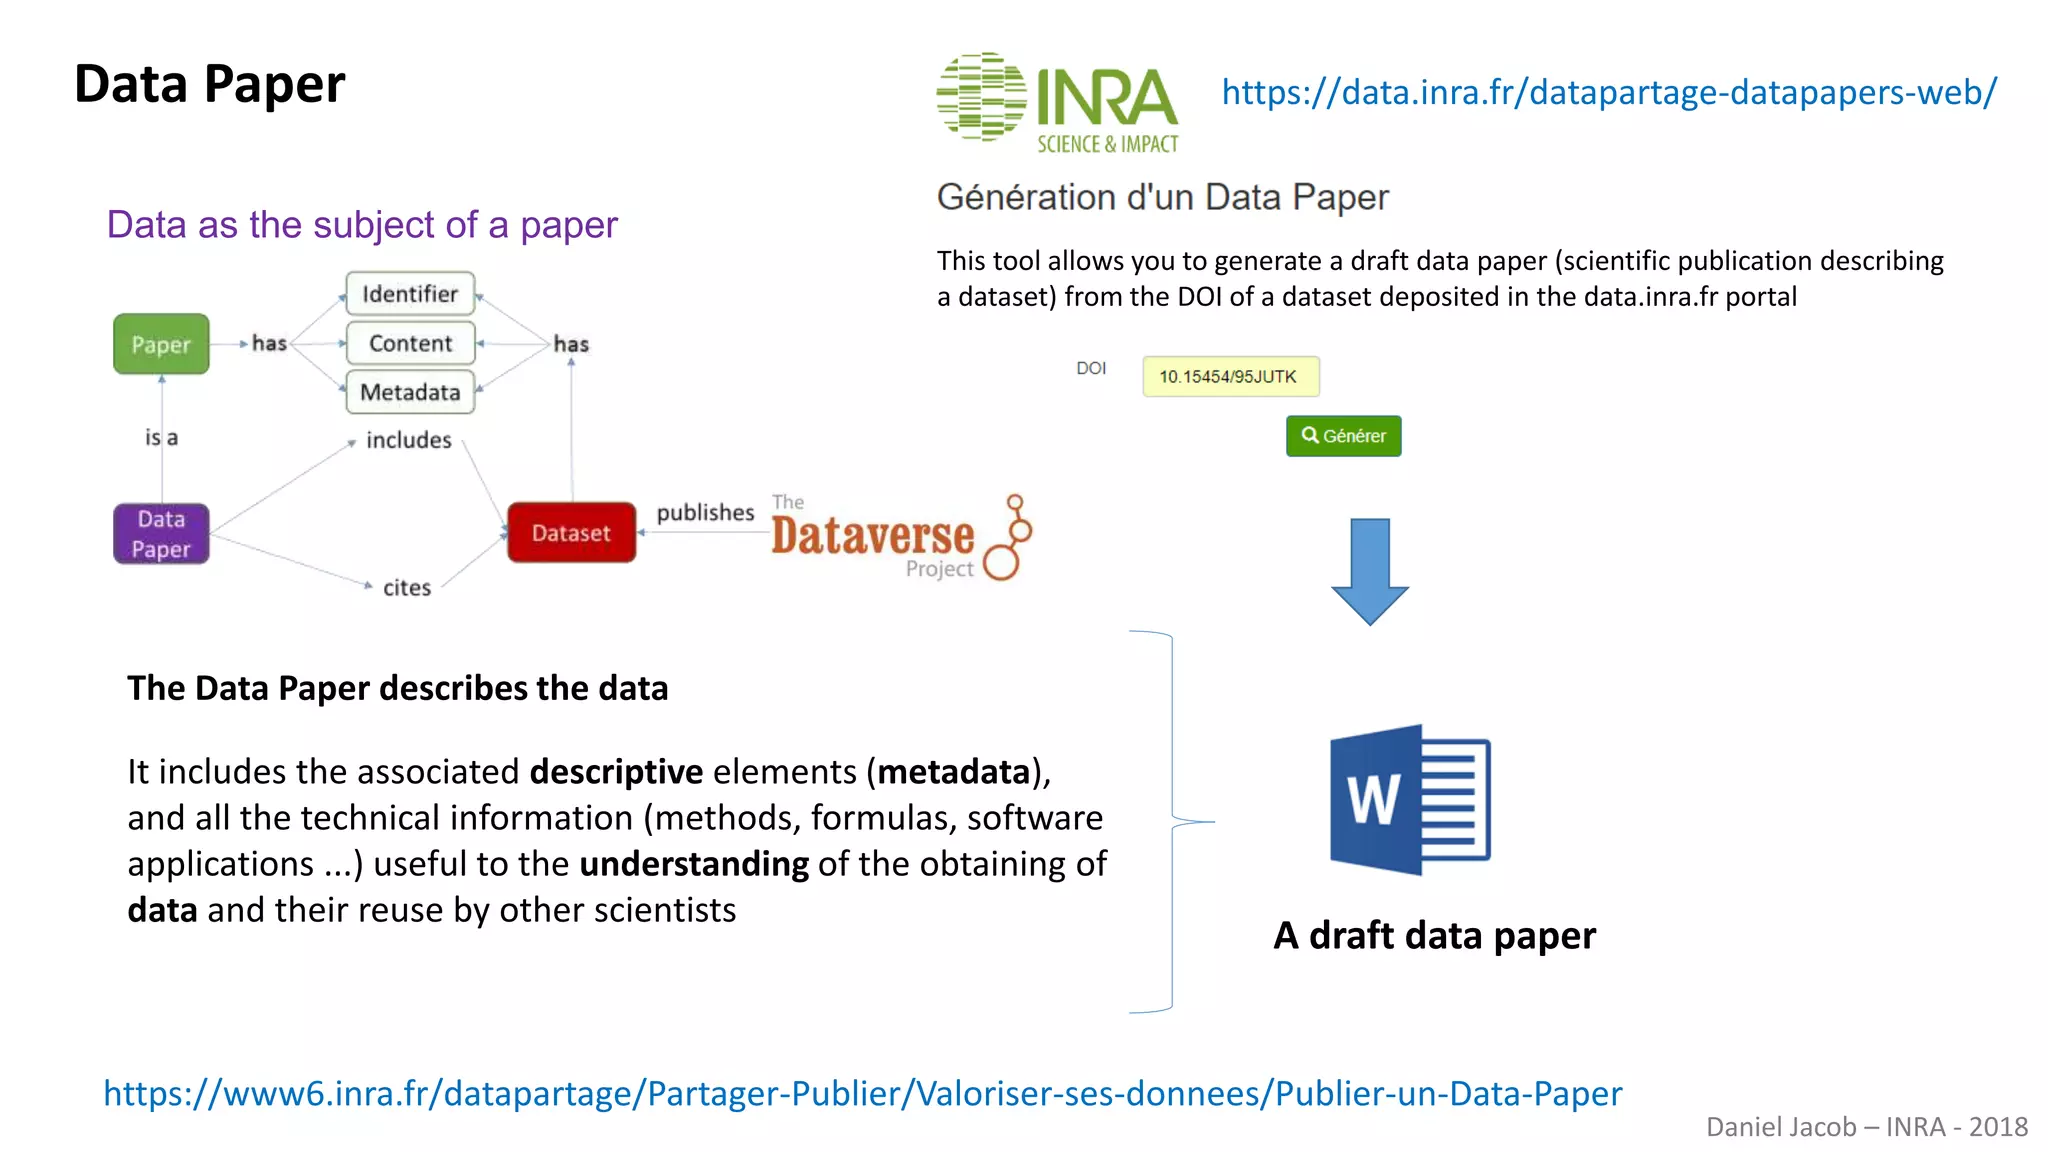


The document discusses best practices for managing research data to enhance accessibility and usability, emphasizing the importance of open data and metadata. It outlines a framework for data management that includes data processing, sharing, and mining to facilitate scientific research and reproducibility. The author argues for the integration of data management into the research process and the need for innovative tools to encourage data sharing and reduce manipulation.


