2013 Data Governance Professionals Organization (DGPO) Digital River WebinarDeepak Bhaskar, MBA, BSEE
Hosted by the Data Governance Professionals Organzation (DGPO) for webinar attendees. Successful Data Governance at Digital River. 2013 DGIQ Data Governance Best Practice Award: Finalist
Most Common Data Governance Challenges in the Digital EconomyRobyn Bollhorst
Todays’ increasing emphasis on differentiation in the digital economy further complicates the data governance challenge. Learn about today’s common challenges and about the new adaptations that are required to support the digital era. Avoid the pitfalls and follow along on Johnson & Johnson’s journey to:
- Establish and scale a best in class enterprise data governance program
- Identify and focus on the most critical data and information to bolster incremental wins and garner executive support
- Ensure readiness for automation with SAP MDG on HANA
A successful data governance capability requires a strategy to align regulatory drivers and technology enhancement initiatives with business needs and objectives, taking into account the organizational, technological and cultural changes that will need to take place.
Key Considerations While Rolling Out Denodo PlatformDenodo
Watch full webinar here: https://bit.ly/3zaPGLO
Our approach for data virtualization advisory takes the following 3 dimensions/areas into consideration:
- Technology / Architecture
- Business User Groups (your clients)
- IT Organization
To deliver quick results, Q-PERIOR uses a multitude of accelerators in predefined topics within these three dimensions. In our presentation we will elaborate on client examples why such an exercise makes sense before rolling out Denodo and what kind of risks you can avoid doing so.
Data Catalog for Better Data Discovery and GovernanceDenodo
Watch full webinar here: https://buff.ly/2Vq9FR0
Data catalogs are en vogue answering critical data governance questions like “Where all does my data reside?” “What other entities are associated with my data?” “What are the definitions of the data fields?” and “Who accesses the data?” Data catalogs maintain the necessary business metadata to answer these questions and many more. But that’s not enough. For it to be useful, data catalogs need to deliver these answers to the business users right within the applications they use.
In this session, you will learn:
*How data catalogs enable enterprise-wide data governance regimes
*What key capability requirements should you expect in data catalogs
*How data virtualization combines dynamic data catalogs with delivery
Data protection and privacy regulations such as the EU’s General Data Protection Regulation (GDPR), the California Consumer Privacy Act (CCPA), and Singapore’s Personal Data Protection Act (PDPA) have been major drivers for data governance initiatives and the emergence of data catalog solutions. Organizations have an ever-increasing appetite to leverage their data for business advantage, either through internal collaboration, data sharing across ecosystems, direct commercialization, or as the basis for AI-driven business decision-making. This requires data governance and especially data asset catalog solutions to step up once again and enable data-driven businesses to leverage their data responsibly, ethically, compliantly, and accountably.
This presentation explores how data catalog has become a key technology enabler in overcoming these challenges.
Gartner: Seven Building Blocks of Master Data ManagementGartner
Gartner will further examine key trends shaping the future MDM market during the Gartner MDM Summit 2011, 2-3 February in London. More information at www.europe.gartner.com/mdm.
DAS Slides: Data Governance and Data Architecture – Alignment and SynergiesDATAVERSITY
Data Governance can have a varied definition, depending on the audience. To many, Data Governance consists of committee meetings and stewardship roles. To others, it focuses on technical Data Management and controls. Holistic Data Governance combines both of these aspects, and a robust Data Architecture and associated diagrams can be the “glue” that binds business and IT governance together. Join this webinar for practical tips and hands-on exercises for aligning Data Architecture and Data Governance for business and IT success.
You Need a Data Catalog. Do You Know Why?Precisely
The data catalog has become a popular discussion topic within data management and data governance circles. A data catalog is a central repository that contains metadata for describing data sets, how they are defined, and where to find them. TDWI research indicates that implementing a data catalog is a top priority among organizations we survey. The data catalog can also play an important part in the governance process. It provides features that help ensure data quality, compliance, and that trusted data is used for analysis. Without an in-depth knowledge of data and associated metadata, organizations cannot truly safeguard and govern their data.
Join this on-demand webinar to learn more about the data catalog and its role in data governance efforts.
Topics include:
· Data management challenges and priorities
· The modern data catalog – what it is and why it is important
· The role of the modern data catalog in your data quality and governance programs
· The kinds of information that should be in your data catalog and why
This practical presentation will cover the most important and impactful artifacts and deliverables needed to implement and sustain governance. Rather than speak hypothetically about what output is needed from governance, it covers and reviews artifact templates to help you re-create them in your organization.
Topics covered:
- Which artifacts are most important to get started
- Important artifacts for more mature programs
- How to ensure the artifacts are used and implemented, not just written
- How to integrate governance artifacts into operational processes
- Who should be involved in creating the deliverables
Data Catalogs Are the Answer – What is the Question?DATAVERSITY
Organizations with governed metadata made available through their data catalog can answer questions their people have about the organization’s data. These organizations get more value from their data, protect their data better, gain improved ROI from data-centric projects and programs, and have more confidence in their most strategic data.
Join Bob Seiner for this lively webinar where he will talk about the value of a data catalog and how to build the use of the catalog into your stewards’ daily routines. Bob will share how the tool must be positioned for success and viewed as a must-have resource that is a steppingstone and catalyst to governed data across the organization.
To take a “ready, aim, fire” tactic to implement Data Governance, many organizations assess themselves against industry best practices. The process is not difficult or time-consuming and can directly assure that your activities target your specific needs. Best practices are always a strong place to start.
Join Bob Seiner for this popular RWDG topic, where he will provide the information you need to set your program in the best possible direction. Bob will walk you through the steps of conducting an assessment and share with you a set of typical results from taking this action. You may be surprised at how easy it is to organize the assessment and may hear results that stimulate the actions that you need to take.
In this webinar, Bob will share:
- The value of performing a Data Governance best practice assessment
- A practical list of industry Data Governance best practices
- Criteria to determine if a practice is best practice
- Steps to follow to complete an assessment
- Typical recommendations and actions that result from an assessment
Enterprise Data Governance Framework With Change ManagementSlideTeam
“You can download this product from SlideTeam.net”
Presenting this set of slides with name Enterprise Data Governance Framework With Change Management. The topics discussed in these slides are Strategy, Organization, Management. This is a completely editable PowerPoint presentation and is available for immediate download. Download now and impress your audience. https://bit.ly/3b4VcEH
You Need a Data Catalog. Do You Know Why?Precisely
Data catalog has become a more popular discussion topic within data management and data governance circles. “What is it?” and “Do I need one?” are two common questions; along with “How does a catalog relate to and support the data governance program?”
The data catalog plays a key role in the governance process; How well information can be managed, aligned to business objectives and monetized depends in great part to what you know about your data.
In this webinar you will learn about:
- The role of the data catalog
- What kinds of information should be in your data catalog
- Those catalog items that can be harvested systemically versus those that require stewardship involvement
- The role of the catalog in your data quality program
We hope you’ll join this on-demand webinar and learn how a data catalog should be part of your governance and data quality program!
• History of Data Management
• Business Drivers for implementation of data governance • Building Data Strategy & Governance Framework
• Data Management Maturity Models
• Data Quality Management
• Metadata and Governance
• Metadata Management
• Data Governance Stakeholder Communication Strategy
Collibra Data Citizen '19 - Bridging Data Privacy with Data Governance BigID Inc
This presentation was shown at the 2019 Collibra Data Citizen Event in New York City.
Presented by Nimrod Vax, Chief Product Officer & Co-Founder & Joaquin Sufuentes, Lead Architect, Metadata Managment and Personal Infomation Protection, enterprise Data Managment, Intel IT
Introduction to Data Governance
Seminar hosted by Embarcadero technologies, where Christopher Bradley presented a session on Data Governance.
Drivers for Data Governance & Benefits
Data Governance Framework
Organization & Structures
Roles & responsibilities
Policies & Processes
Programme & Implementation
Reporting & Assurance
Tackling Data Quality problems requires more than a series of tactical, one-off improvement projects. By their nature, many Data Quality problems extend across and often beyond an organization. Addressing these issues requires a holistic architectural approach combining people, process, and technology. Join Nigel Turner and Donna Burbank as they provide practical ways to control Data Quality issues in your organization.
Data Governance Takes a Village (So Why is Everyone Hiding?)DATAVERSITY
Data governance represents both an obstacle and opportunity for enterprises everywhere. And many individuals may hesitate to embrace the change. Yet if led well, a governance initiative has the potential to launch a data community that drives innovation and data-driven decision-making for the wider business. (And yes, it can even be fun!). So how do you build a roadmap to success?
This session will gather four governance experts, including Mary Williams, Associate Director, Enterprise Data Governance at Exact Sciences, and Bob Seiner, author of Non-Invasive Data Governance, for a roundtable discussion about the challenges and opportunities of leading a governance initiative that people embrace. Join this webinar to learn:
- How to build an internal case for data governance and a data catalog
- Tips for picking a use case that builds confidence in your program
- How to mature your program and build your data community
Enterprise Architecture vs. Data ArchitectureDATAVERSITY
Enterprise Architecture (EA) provides a visual blueprint of the organization, and shows key interrelationships between data, process, applications, and more. By abstracting these assets in a graphical view, it’s possible to see key interrelationships, particularly as they relate to data and its business impact across the organization. Join us for a discussion on how Data Architecture is a key component of an overall Enterprise Architecture for enhanced business value and success.
This session covers topics related to data archiving and sharing. This includes data formats, metadata, controlled vocabularies, preservation, archiving and repositories.
It is about:
Introduction: What Is “Research Data”? and Data Lifecycle
Part 1:
Why Manage Your Data?
Formatting and organizing the data
Storage and Security of Data
Data documentation and meta data
Quality Control
Version controlling
Working with sensitive data
Controlled Vocabulary
Centralized Data Management
Part 2:
Data sharing
What are publishers & funders saying about data sharing?
Researchers’ Attitudes
Benefits of data sharing
Considerations before data sharing
Methods of Data Sharing
Shared Data Uses and Its’ Limitations
Data management plans
Brief summary
Acknowledgment , References
Agile Testing Alliance hosted it's 16th Meetup in Pune on 9th Dec, 2017. Shreya Pal was one of the speakers in the meetup and gave a insightful session on BigData Testing. All the rights belong the author
Introduction to DMPTool2. Originally released in 2011, the DMPTool provides a free step-by-step wizard, detailed guidance, and links to general and institutional resources to walk a researcher through the process of generating a comprehensive data management plan tailored to specific funder requirements.
This webinar will demonstrate some of the original features of the tool, as well as the new features in DMPTool2, which include institutional customizations and researcher collaborations.
Federal Funder Mandates for Open Access Brown Bag
UVa OA Week Presentation
Library data management experts Sherry Lake and Andrea Denton will lead a discussion of current and upcoming mandates for making the results of federally-funded research open to the public. Bring your questions about NIH, NEH, NSF, DOE, and other funders.
Operation “Blue Star” is the only event in the history of Independent India where the state went into war with its own people. Even after about 40 years it is not clear if it was culmination of states anger over people of the region, a political game of power or start of dictatorial chapter in the democratic setup.
The people of Punjab felt alienated from main stream due to denial of their just demands during a long democratic struggle since independence. As it happen all over the word, it led to militant struggle with great loss of lives of military, police and civilian personnel. Killing of Indira Gandhi and massacre of innocent Sikhs in Delhi and other India cities was also associated with this movement.
Synthetic Fiber Construction in lab .pptxPavel ( NSTU)
Synthetic fiber production is a fascinating and complex field that blends chemistry, engineering, and environmental science. By understanding these aspects, students can gain a comprehensive view of synthetic fiber production, its impact on society and the environment, and the potential for future innovations. Synthetic fibers play a crucial role in modern society, impacting various aspects of daily life, industry, and the environment. ynthetic fibers are integral to modern life, offering a range of benefits from cost-effectiveness and versatility to innovative applications and performance characteristics. While they pose environmental challenges, ongoing research and development aim to create more sustainable and eco-friendly alternatives. Understanding the importance of synthetic fibers helps in appreciating their role in the economy, industry, and daily life, while also emphasizing the need for sustainable practices and innovation.
How to Make a Field invisible in Odoo 17Celine George
It is possible to hide or invisible some fields in odoo. Commonly using “invisible” attribute in the field definition to invisible the fields. This slide will show how to make a field invisible in odoo 17.
We all have good and bad thoughts from time to time and situation to situation. We are bombarded daily with spiraling thoughts(both negative and positive) creating all-consuming feel , making us difficult to manage with associated suffering. Good thoughts are like our Mob Signal (Positive thought) amidst noise(negative thought) in the atmosphere. Negative thoughts like noise outweigh positive thoughts. These thoughts often create unwanted confusion, trouble, stress and frustration in our mind as well as chaos in our physical world. Negative thoughts are also known as “distorted thinking”.
The French Revolution, which began in 1789, was a period of radical social and political upheaval in France. It marked the decline of absolute monarchies, the rise of secular and democratic republics, and the eventual rise of Napoleon Bonaparte. This revolutionary period is crucial in understanding the transition from feudalism to modernity in Europe.
For more information, visit-www.vavaclasses.com
How to Create Map Views in the Odoo 17 ERPCeline George
The map views are useful for providing a geographical representation of data. They allow users to visualize and analyze the data in a more intuitive manner.
The Art Pastor's Guide to Sabbath | Steve ThomasonSteve Thomason
What is the purpose of the Sabbath Law in the Torah. It is interesting to compare how the context of the law shifts from Exodus to Deuteronomy. Who gets to rest, and why?
The Roman Empire A Historical Colossus.pdfkaushalkr1407
The Roman Empire, a vast and enduring power, stands as one of history's most remarkable civilizations, leaving an indelible imprint on the world. It emerged from the Roman Republic, transitioning into an imperial powerhouse under the leadership of Augustus Caesar in 27 BCE. This transformation marked the beginning of an era defined by unprecedented territorial expansion, architectural marvels, and profound cultural influence.
The empire's roots lie in the city of Rome, founded, according to legend, by Romulus in 753 BCE. Over centuries, Rome evolved from a small settlement to a formidable republic, characterized by a complex political system with elected officials and checks on power. However, internal strife, class conflicts, and military ambitions paved the way for the end of the Republic. Julius Caesar’s dictatorship and subsequent assassination in 44 BCE created a power vacuum, leading to a civil war. Octavian, later Augustus, emerged victorious, heralding the Roman Empire’s birth.
Under Augustus, the empire experienced the Pax Romana, a 200-year period of relative peace and stability. Augustus reformed the military, established efficient administrative systems, and initiated grand construction projects. The empire's borders expanded, encompassing territories from Britain to Egypt and from Spain to the Euphrates. Roman legions, renowned for their discipline and engineering prowess, secured and maintained these vast territories, building roads, fortifications, and cities that facilitated control and integration.
The Roman Empire’s society was hierarchical, with a rigid class system. At the top were the patricians, wealthy elites who held significant political power. Below them were the plebeians, free citizens with limited political influence, and the vast numbers of slaves who formed the backbone of the economy. The family unit was central, governed by the paterfamilias, the male head who held absolute authority.
Culturally, the Romans were eclectic, absorbing and adapting elements from the civilizations they encountered, particularly the Greeks. Roman art, literature, and philosophy reflected this synthesis, creating a rich cultural tapestry. Latin, the Roman language, became the lingua franca of the Western world, influencing numerous modern languages.
Roman architecture and engineering achievements were monumental. They perfected the arch, vault, and dome, constructing enduring structures like the Colosseum, Pantheon, and aqueducts. These engineering marvels not only showcased Roman ingenuity but also served practical purposes, from public entertainment to water supply.
The Indian economy is classified into different sectors to simplify the analysis and understanding of economic activities. For Class 10, it's essential to grasp the sectors of the Indian economy, understand their characteristics, and recognize their importance. This guide will provide detailed notes on the Sectors of the Indian Economy Class 10, using specific long-tail keywords to enhance comprehension.
For more information, visit-www.vavaclasses.com
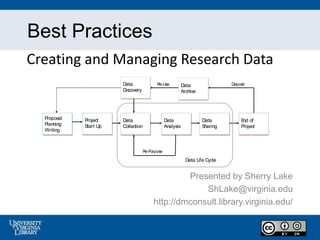
1. Best Practices
Creating and Managing Research Data
Presented by Sherry Lake
ShLake@virginia.edu
http://dmconsult.library.virginia.edu/
Data Life Cycle
Re-Purpose
Re-Use Deposit
Data
Collection
Data
Analysis
Data
Sharing
Proposal
Planning
Writing
Data
Discovery
End of
Project
Data
Archive
Project
Start Up
3. Best Practices for Creating Data
1. Use Consistent Data Organization
2. Use Standardized Naming, codes and formats
3. Assign Descriptive File Names
4. Perform Basic Quality Assurance / Quality Control
5. Preserve Information - Use Scripted Languages
6. Define Contents of Data Files; Create
Documentation
7. Use Consistent, Stable and Open File Formats
6. Consistent Data Organization
• Spreadsheets (such as those found in Excel)
are sometimes a necessary evil
– They allow “shortcuts” which will result in your
data not being machine-readable
• But there are some simple steps you can take
to ensure that you are creating spreadsheets
that are machine-readable and will withstand
the test of time
12. Spreadsheet Best Practices
• Include a Header Line 1st line (or record)
• Label each Column with a short but descriptive name
Names should be unique
Use letters, numbers, or “_” (underscore)
Do not include blank spaces or symbols (+ - & ^ *)
13. • Columns of data should be consistent
– Use the same naming convention for text data
• Each line should be “complete”
• Each line should have a unique identifier
Spreadsheet Best Practices
14. Spreadsheet Best Practices
• Columns should include only a single kind of data
– Text or “string” data
– Integer numbers
– Floating point or real numbers
15. Use Naming Standards & Codes
• Use commonly accepted label names that
describe the contents (e.g., precip for
precipitation)
• Use consistent capitalization (e.g., not: temp,
Temp, and TEMP in same file)
• Standard codes
– State Postal (VA, MA)
– FIPS Codes for Counties and County Equivalent
Entities
(http://www.census.gov/geo/reference/codes/cou.html)
16. Use Standardized Formats
• Use standardized formats for units
International System of Units (SI)
http://physics.nist.gov/Pubs/SP330/sp330.pdf
• ISO 8601 Standard for Date and Time
YYYYMMDDThh:mmss.sTZD
20091013T09:1234.9Z
20091013T09:1234.9+05:00
• Spatial Coordinates for Latitute/Longitude
+/- DD.DDDDD
-78.476 (longitude)
+38.029 (latitude)
18. File Names
• Use descriptive names
• Not too long; CamelCase
• Try to include time
– Date using YYYYMMDD
– Use version numbers
• Don’t use spaces
– May use “-” or “_”
• Don’t change default
extensions
19. Organize Files Logically
Make sure your file system is logical and
efficient
Biodiversity
Lake
Grassland
Experiments
Field Work
Biodiv_H20_heatExp_2005_2008.csv
Biodiv_H20_predatorExp_2001_2003.csv
Biodiv_H20_planktonCount_start2001_active.csv
Biodiv_H20_chla_profiles_2003.csv
Project
Name
Location Experiment
Name
Date File
Format
20. • Check for missing, impossible,
anomalous values
– Plotting
– Mapping
• Examine summary statistics
• Verify data transfers from
notebooks to digital files
• Verify data conversion from one
file format to another
Data Validation
Hook, et al. 2010. Best Practices for Preparing Environmental Data Sets to Share
and Archive. Available online: http://daac.ornl.gov/PI/BestPractices-2010.pdf.
21. Data Manipulation
• You will need to repeat reduction and analysis
procedures many times
– You need to have a workflow that recognizes this
– Scripted languages can help capture the workflow
– You could just document all steps by hand
– After the 20th iteration through your data set; however, you may
feel more fondly towards scripted languages
• Learn the analytical tools of your field
– Talk to colleagues, etc. and choose at least one tool to
master
22. Preserve Information
Keep Original (Raw) File
– Do not include
transformations,
interpolations, etc.
– Consider making the raw
data “read-only”
Save as a new file
Processing Script (R)
23. Preserving: Scripted Notes
• Use a scripted language to process data
– R Statistical package (free, powerful)
– SAS
– MATLAB
• Processing scripts records processing
– Steps are recorded in textual format
– Can be easily revised and re-executed
– Easy to document
• GUI-based analysis may be easier, but harder to
reproduce
24. Data Documentation (Metadata)
• Informal or formal methods to describe your
data
• Important if you want to reuse your own data
in the future
• Also necessary when sharing your data
25. Define Contents of Data Files
• Create a Project Document File (Lab
Notebook)
• Details such as:
– Names of data & analysis files associated with
study
– Definitions for data and codes (include missing
value codes, names)
– Units of measure (accuracy and precision)
– Standards or instrument calibrations
28. Data Documentation
Project Documentation Dataset Documentation
• Context of data collection
• Data collection methods
• Structure, organization of data files
• Data sources used
• Data validation, quality assurance
• Transformations of data from the
raw data through analysis
• Information on confidentiality,
access and use conditions
• Variable names and descriptions
• Explanation of codes and schemas
used
• Algorithms used to transform data
• File format and software (including
version) used
29. File Format Sustainability
Types Examples
Text ASCII, Word, PDF
Numerical ASCII, SPSS, STATA, Excel, Access, MySQL
Multimedia Jpeg, tiff, mpeg, quicktime
Models 3D, statistical
Software Java, C, Fortran
Domain-specific FITS in astronomy, CIF in chemistry
Instrument-specific Olympus Confocal Microscope Data Format
30. Choosing File Formats
• Accessible Data (in the future)
– Non-proprietary (software formats)
– Open, documented standard
– Common, used by the research community
– Standard representation (ASCII, Unicode)
– Unencrypted & Uncompressed
31. 1. Use Consistent Data Organization
2. Use Standardized Naming, Codes and Formats
3. Assign Descriptive File Names
4. Perform Basic Quality Assurance / Quality Control
5. Preserve Information - Use Scripted Languages
6. Define Contents of Data Files; Create
Documentation
7. Use Consistent, Stable and Open File Formats
Best Practices for Creating Data
32. • Will improve the usability of the data by you
or by others
• Your data will be “computer ready”
• Save you time
Following these Best Practices…….
33. Research Life Cycle
Data Life Cycle
Re-
Purpose
Re-
Use
Deposit
Data
Collection
Data
Analysis
Data
Sharing
Proposal
Planning
Writing
Data
Discovery
End of
Project
Data
Archive
Project
Start Up
34. Managing Data in the Data Life Cycle
• Choosing file formats
• File naming conventions
• Document all data details
• Access control & security
• Backup & storage
35. Data Security & Access Control
• Network security
– keep confidential or sensitive data off internet
servers or computers on connected to the internet
• Physical security
– Access to buildings and rooms
• Computer Systems & Files
– Use passwords on files/system
– Virus protection
36. Backup Your Data
• Reduce the risk of damage or loss
• Use multiple locations (here, near, far)
• Create a backup schedule
• Use reliable backup medium
• Test your backup system (i.e., test file
recovery)
39. Best Practices Bibliography
Borer, E. T., Seabloom, E. W., Jones, M. B., & Schildhauer, M. (2009). Some simple
guidelines for effective data management. Bulletin of the Ecological Society of
America, 90(2), 205-214. http://dx.doi.org/10.1890/0012-9623-90.2.205
Graham, A., McNeill, K., Stout, A., & Sweeney, L. (2010). Data Management and
Publishing. Retrieved 05/31/2012, from
http://libraries.mit.edu/guides/subjects/data-management/.
Hook, L. A., Santhana Vannan, S.K., Beaty, T. W., Cook, R. B. and Wilson, B.E. (2010).
Best Practices for Preparing Environmental Data Sets to Share and Archive.
Available online (http://daac.ornl.gov/PI/BestPractices-2010.pdf) from Oak Ridge
National Laboratory Distributed Active Archive Center, Oak Ridge, Tennessee, U.S.A.
http://dx.doi.org/10.3334/ORNLDAAC/BestPractices-2010.
40. Best Practices Bibliography (Cont.)
Inter-university Consortium for Political and Social Research (ICPSR). (2012).
Guide to social science data preparation and archiving: Best practices
throughout the data cycle (5th ed.). Ann Arbor, MI. Retrieved 05/31/2012,
from http://www.icpsr.umich.edu/files/ICPSR/access/dataprep.pdf.
Van den Eynden, V., Corti, L., Woollard, M. & Bishop, L. (2011). Managing and
Sharing Data: A Best Practice Guide for Researchers (3rd ed.). Retrieved
05/31/2012, from http://www.data-
archive.ac.uk/media/2894/managingsharing.pdf.
Editor's Notes
The following are seven basic data habits that will help improve the information content of your data and make it easier to share data with others:
Some have estimated that researchers can spend up to 80% of their time finding, accessing, understanding, and preparing data and only 20% of their time actually analyzing the data. The habits described in this module will help scientists spend more time doing research and less time doing data management.
Spreadsheets are widely used for simple analyses
They are easy to use BUT
They allow (encourage) users to structure data in ways that are hard to use with other software
You can use them like Word, with columns. These spreadsheets (in this format) are good for “human” interpretation, not computers – and since you probably will need either
Write a program or use a software package, then the “human” format is not best.
These formats are good for presenting your findings such as publishing…. But it will be harder to use with other software later on
(if you need to do any analysis).
It is better to store the data in ways that it can be used in automated ways, with minimal human intervention
Example of Poor Data Practice for Collaboration and Sharing
This illustration shows an example of poor practice for working in spreadsheets for data collection. At first glance, it may appear this data is well formulated, but a closer look reveals a number of practices that will make it difficult to re-use in its present state. For example, there are calculations in the far right columns that appear to have been made during a data analysis phase but that do not represent valid data entries.
Notice in the upper right corner a comment stating “Don’t use – old data”, and “Peter’s lab”. These remarks leave the viewer wondering about who Peter is and which lab he was located in, as well as why this data may not be the most accurate data spreadsheet. One also may wonder what the “c” located in the far right column represents, and what the numbers at the bottom of the spreadsheet represent, since they are unaffiliated with a particular row of data in the spreadsheet.
Notice there are numbers added in inconsistent places (two numbers at the bottom of the chart) and the letter “C” appears in an unlabeled column.
Spreadsheets are widely used for simple analyses
They are easy to use, however…
They allow (encourage) users to structure data in ways that are hard to use with other software
You can use them like you would a Word document, with columns and colors. These spreadsheets (in this format) are good for “human” interpretation, not computers – and since you probably will need to either write a program or use a software package, then the “human” format is not best.
These formats are good for presenting your findings (publishing)…. But it will be harder to use with other software later on
(if you need to do any further analysis).
It is better to store the data in formats that it can be used in automated ways, with minimal human intervention
This is some well data measurements, where a salinity meter was used to measure the salinity (top and bottom) and the conductivity (Top & bottom)
Take a look at this spreadsheet… What’s wrong with it?
Could this be easily automated? Sorted?
Would you create a file like this?
Dates are not stored consistently
Sometimes date is stored with a label (e.g., “Date:5/23/2005”) sometimes in its own cell (10/2/2005)
Values are labeled inconsistently
Sometimes “Conductivity Top” others “conductivity_top”
For Salinity sometimes two cells are used for top and bottom, in others they are combined in one cell
Data coding is inconsistent
Sometimes YSI_Model_30, sometimes “YSI Model 30”---- sort of can’t tell if it’s a “label” or a data value
Tide State is sometimes a text description, sometimes a number
The order of values in the “mini-table” for a given sampling date are different
“Meter Type” comes first in the 5/23 table and second in the 10/2 table
Confusion between numbers and text
For most software 39% or <30 are considered TEXT not numbers (what is the average of 349 and <30?)
Different types of data are stored in the same columns
Many software products require that a single column contain either TEXT or NUMBERS (but not both!)
The spreadsheet loses interpretability if it is sorted
Dates are related to a set of attributes only by their position in the file. Once sorted that relationship is lost.
Not sure why you would sort this.
Hint – think about representing missing values and about sortability
You want each row to be a complete record…. With no blank cells – think about a way to represent “missing values”
Designed to be machine readable, not human readable
The original spreadsheet loses interpretability if it is sorted
Dates are related to a set of attributes only by their position in the file. Once sorted that relationship is lost
-Sherry
Standard convention for many software programs (usually a “check” yes,no) is for the 1st line (record) to be a header line… lists the names of variables in the file. Rest of records (lines) are data.
Not too long some software programs may not work with long variable names
Each line in the spreadsheet should have each cell filled. Otherwise, it isn’t machine-readable, and it won’t even survive a “sort” operation.
Note we’ve changed the format of the date to an ISO YYYYMMDD format.
Format the columns so they contain a single type of data…
One problem with Excel is that it doesn’t like to show trailing zeros. So “33.0” in F2 is shown as “33” unless you change the formatting, as we have done here.
(am/pm NOT allowed)
T appears literally in the string. Min. for date is YYYY.
YYYY = four-digit year
MM = two-digit month (01=January, etc.)
DD = two-digit day of month (01 through 31)
hh = two digits of hour (00 through 23)
mm = two digits of minute (00 through 59)
ss = two digits of second (00 through 59)
s = one or more digits representing a decimal fraction of a second
TZD = time zone designator (Z or +hh:mm or -hh:mm)
38.029N. The longitude is -78.476W
File names should reflect the contents of the file and uniquely identify the data file. File names may contain information such as project acronym, study title, location, investigator, year(s) of study, data type, version number, and file type.
Think about how the name will look in a directory with lots of other files, want to be able to “pick it out”.
Having trouble finding files, telling the most recent one?
File names are the easiest way to indicate the contents of the file. Use terse names but indicative of their content. Want to uniquely id the data file.
Be unique but reflect the file content. Think about the organizing principle, don’t just make up a system as you go along.
Don’t’ make them too long, some scripting programs have a filename limit for file importing (reading)
Don’t use blanks/spaces in file names, some software may not be able to read file names with blanks.
Think about how the name will look in a directory with lots of other files, want to be able to “pick it out”.
As with naming files….
Similar logic is useful when designing file directory structures and names, which you should ensure is logical and efficient in design
Perform basic quality assurance
Doing quality control will help you in your project but it will also help those who want to use your data. Would you want to use data that you were not sure of the quality?
You don’t want to change something (or delete something) that could be important later (and you don’t know now what that may be). Make corrections/deletions in a derivative file, never in the original file.
Things to think about:
Operationally, you want to keep the raw data until you are “finished”
Whether you preserve the raw data after the project is over depends on various factors. Most importantly, can the data be easily regenerated? If this is experimental data, it often is. However, observational, or survey data usually isn’t reproducible, and needs to be preserved after the end of the project.
How would you name the new file?
If use a scripted language you could re-run analyses
It is important to take good notes of what changes you make to the data (file).
To preserve your data and its integrity, save a "read-only" copy of your raw data files with no transformations, interpolation, or analyses. Use a scripted language such as “R”, “SAS” or “MATLAB” to process data in a separate file, located in a separate directory.
In this example, an “R” to call is made on the data set to plot the data and perform a log transform – this way, changes are not retained in the original, raw data file.
Analysis “scripted” software: R, SAS, SPSS, Matlab
Analysis scripts are written records of the various steps involved in processing and analyzing data (sort of “analytical metadata”).
Easily revised and re-executed at any time if needs to modify analysis
VS. GUI (easier) but does not leave a clear accounting of exactly what you have done
Document scripted code with comments on why data is being changed.
The scripts you have written are an excellent record of data processing, they can also easily and quickly be revised and rerun in the event of data loss or requests for edits, and have the added benefit of allowing a future worker to follow-up or reproduce your processing. Keep in mind that while GUI-based programs are easy on the front end, they do not keep a record of changes to your data and make reproducing results difficult.
Metadata and associated documentation is absolutely crucial for any potential use or reuse of data; no one can responsibly re-use or interpret data without accompanying compliant and standardized metadata or documentation.
Metadata describe your data so that others can understand what your data set represents; they are thought of as "data about the data" or the "who, what, where, when, and why" of the data.
Metadata should be written from the standpoint of someone reading it who is unfamiliar with your project, methods, or observations. What does a user, 20 years into the future, need to know to use your data properly?
Informal something like a ReadMe file. Formal is use of a structured like a data dictionary, codebook, or metadata. Different disciplines may have format standards.
Informal is better than nothing
More documentation:
Documentation can also be called metadata
Description of the data file names (especially if using acronyms and abbreviations).
Record why you are collecting data,
Details of methods of analysis
Names of all data and analysis files
Definitions for data (include coding keys)
Missing value codes
Unit of measures.
Structured metadata (XML) format standards for discipline (Ecological Metadata language – EML)
Here the data dictionary specifies units for each field (parameter)
In fact, you probably already have metadata in some form. You just may not recognize it as such. For instance, among your work records, you certainly have notebooks stuffed with color-coded pages or assorted keys to your data stored on your computer. Perhaps the most common form of metadata that you may already have is a file folder filled with notes on your data sources and the procedures that you used to build your data. However, unless you’ve been unusually diligent, your information is probably not organized so that a stranger could stroll into your office at any time, and read and understand it easily.
Start at the beginning of the project and continue throughout data collection & analysis
Why you are collecting data
Exact details of methods of collecting & analyzing
Good for reproducability. Some of the issues include reproducibility of science that you can go back when questioned or when updating your results, and reproduce the algorithms.
There’s also efficiencies in how the science is done. If you have to spend a lot of time figuring out what was done last time you are losing some efficiencies in reproducing those results or updating analysis.
Along the line of those efficiencies is sharing across groups. Much of the work we do nowadays is collaborative, involves more than one agency or university or partner and if you can document the data and the analysis it helps to share the information and have everyone in that collaborative team understand what’s being done.
We also, like documenting the data and the analysis create a provenance that gives a full history of when the project was started how the analysis was done and how the final results were completed.
Collection/Analysis format does not have to be the same as Preservation format, but if not, then it will need to be converted (interchangeable format – will talk about this later) for archiving
Want to choose a file format that can be read well into the future and is independent of software changes.
Fundamental Practice #3: Use stable file formats
Data re-use depends on the ability to return to a dataset, perhaps long after the proprietary software you used to develop it, is available. Remember floppy disks? It is difficult to find a computer that will read a floppy disk today. We must think of digital data in a similar way. Select a consistent format that can be read well into the future and is independent of changes in applications. If your data collection process used proprietary file formats, converting those files into a stable, well-documented, and non-proprietary format to maximize others' abilities to use and build upon your data is a best practice.
When possible, convert your tabular dataset into ASCII text format.
To be accessible in the future:
Non-proprietary
Open, documented standard
Common, used by the research community
Standard representation (ASCII, Unicode)
Unencrypted
Uncompressed
Storing data in recommended formats with detailed documentation will allow your data to be easily read many years into the future.
Spreadsheets are widely used for simple analyses
But they have poor archival qualities
Different versions over time are not compatible
Formulas are hard to capture or display
Plan what type of data you will be collecting. Want to choose a file format that can be read well into the future and is independent of software changes.
These are formats more likely to be accessible in the future.
to replace old media, maintaining devices that can still read the proprietary formats or media type
Format of the file is a major factor in the ability to use the data in the future. As technology changes, plan for software and hardware obsolescence.
System files (SAS, SPSS) are compact and efficient, but not very portable. Use software to “export” data to a portable (or transport) file.
Convert proprietary formats to non-proprietary. Check for data errors in conversion.
Remember create spreadsheet so it can be automated
Date/Time standards, Geospatial coords, Species, other standards from discipline
Descriptive File Names – File names can help id what’ inside
Quality Assurance – when planning on data entry can “program” data checks in forms (Access and Excel), create pick lists (codes), missing data values
Make it easier to replicate data transformation, can be documented
Document EVERYTHING, dataset details, database details, collection notes – conditions, You will not remember everything 20 years from now! What someone would need to know about your data to use it.
Stable File Formats – easier if all files were same format, also knowing what formats are better in the long-term
Planning the management of your data before you begin your research AND throughout its lifecycle is essential to ensure its current usability & long-term preservation and access.
With a repository keeping your data, you can focus on your research rather than fielding requests or worrying about data on a web page. Your project may have lots of people working on it, you will need to know what each is doing and has done. Project may last years.
Funding agencies now require a data management plan
Having your data documented will allow future users understand your data and be able to use it.
If follow plan then data should be ready for archiving (documenting the data throughout) insures proper description of the data are maintained.
Collecting the data is just part of a research project. Here’s a view of the complete life cycle of research. The data you collect (all the files, notes) need to be managed throughout the project.
Steps in the Research Life Cycle:
Proposal Planning & Writing:
Conduct a review of existing data sets
Determine if project will produce a new dataset (or combing existing)
Investigate archiving challenges, consent and confidentiality
Id potential users of your data
Determine costs related to archiving
Contact Archives for advice (Look for archives)
Project Start Up
Create a data management plan
Make decisions about document form and content
Conduct pretest & tests of materials and methods
Data Collection
Follow Best Practice
Organize files, backups & storage, QA for data collection
Access Control and Security
Data Analysis
Manage file versions
Document analysis and file manipulations
Data Sharing
Determine file formats
Contact Archive for advice
More documenting and cleaning up data
End of Project
Write Paper
Submit Report Findings
Deposit Data in Data Archive (Repository)
Remember: Managing Data in a research project is a process that runs throughout the project. Good data management is the foundation for good research. Especially if you are going to share your data. Good management is essential to ensure that data can be preserved and remain accessible I the long-term, so it can be re-used and understood by other researchers. When managed and preserved properly research data can be successfully used for future scientific purposes.
Here’s the details about what we are going to manage in the Data Life Cycle.
Many of the criteria for managing data are the best practices that we already went over. The 2 highlighted we haven’t talked about yet.
Keep master copy to an assigned team member
Restrict write access to specific members
Record changes with Version control
Network: keep confidential data off internet servers (or behind firewalls), put sensitive materials on computers not connected to the internet
Physical security… who has access to your office,. Allowing repairs by an outside company
Computer: Keep virus protection up to date, does your computer have a login password, not sending personal or confidential data via e-mail or FTP, transmit via encrypted data, imposing confidentially agreements for data users
Why backup data?
Keeping reliable backups is an integral part of data management. Regular back-ups protect against data loss due to:
Hardware failure, software of media faults, virus infection or hacking, power failure, human errors
Recommendation, 3 backup copies original, external/local, external/remote
Full-backups, incremental
If using departmental server, check on backup/restore procedures (how quickly can you get files restored?)
May want to have the backup procedures controlled by you.
Test your backup system, test restoring files, don’t over re-use backup media
There are a variety of alternative methods to store and share your data - from thumb drives to shared online environments.
Personal Computer
Departmental or University Server
Home Directory or UVa Collab (Storage only)
Tape Backups
Subject Archive
Each type of storage (can’t forget backups) has their strengths and weaknesses. You need to be able to evaluate them for your research.
Point… to think about migrating information from obsolete media to new media.
Using CD-Roms as data backups is popular. Blank CDs are inexpensive, and copying data onto CDs is easy. However, this is the most unreliable method of all the data backup methods listed here. Who hasn't had the experience of putting a CD into a drive only to find that the data is unreadable and the disk "doesn't work"? CDs, like the floppy disks they've replaced, have a limited shelf life. If you are writing your data backup files onto CDs, make sure that you make (and keep) multiple copies over time.
external hard drive for data backups is recommended. External hard drives are relatively cheap. They’re also easy to use; in many cases, all you have to do is plug the hard drive into your computer’s USB port. And while hard drives do fail, their failure rate is much lower than that of backup media such as CDs.
Cloud Storage for-fee or free for up to 10G (storage costs, data transfer)