

Recommended
More Related Content
What's hot
What's hot (11)
Viewers also liked
Viewers also liked (19)
Similar to Major project report
Similar to Major project report (20)
More from ABU TALEB TARAQUE
More from ABU TALEB TARAQUE (20)
Recently uploaded
Recently uploaded (20)
Major project report
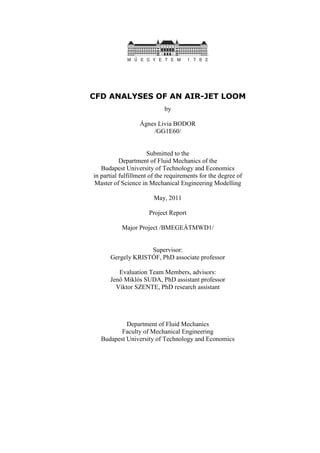
- 1. CFD analyses of an air-jet loom i CFD ANALYSES OF AN AIR-JET LOOM by Ágnes Livia BODOR /GG1E60/ Submitted to the Department of Fluid Mechanics of the Budapest University of Technology and Economics in partial fulfillment of the requirements for the degree of Master of Science in Mechanical Engineering Modelling May, 2011 Project Report Major Project /BMEGEÁTMWD1/ Supervisor: Gergely KRISTÓF, PhD associate professor Evaluation Team Members, advisors: Jenő Miklós SUDA, PhD assistant professor Viktor SZENTE, PhD research assistant Department of Fluid Mechanics Faculty of Mechanical Engineering Budapest University of Technology and Economics
- 2. ASSIGNMENT MSc MAJOR PROJECT (BMEGEÁTMWD1) Title: CFD analyses of an air-jet loom Author’s name (code): Ágnes Livia BODOR (GG1E60) Curriculum : MSc in Mechanical Engineering Modelling / Fluid Mechanics Supervisor’s name, title: Gergely KRISTÓF, PhD associate professor Affiliation: Department of Fluid Mechanics / BME Assistant supervisor’s name, title: - Affiliation: Description / tasks of the project: 1/ To design and to build an experimental device for aerodynamic testing of a single air-jet loom sub-nozzle and for measuring drag force acting on the thread. The reed can be replaced with a properly shaped plate in the experiments (cross-flow can be neglected). 2/ To measure velocity profiles of the air flow for various supply pressures. To measure the drag force in every experimental case. 3/ To build the 3D geometrical model of the test section in ANSYS simulation system. To mesh the computational domain with 3 different spatial resolution. 4/ To compute the flow field for cases of different supply pressure by taking into account the compressibility effect. To compute the drag force acting on the thread by means of the air velocity distribution. 5/ To compare simulation results with experimental data. 6/ To assess the effect of periodic boundary condition on the flow pattern for a given supply pressure. 7/ To document the experimental and the CFD analyses according to formal requirements of Major Projects. Handed out / Deadline: 7th of February 2011. / 13th of May 2011. Budapest, 7th of February 2011. ………………………………. Head of Department Received by: The undersigned declares that all prerequisite subjects of the Major Project have been fully accomplished. Otherwise, the present assignment for the Final Project is to be considered invalid. Signed in Budapest, on the 7th of February 2011. ………………………………. Student
- 3. CFD analyses of an air-jet loom i DECLARATION Full Name (as in ID): Ágnes Livia BODOR Neptun Code: GG1E60 University: Budapest University of Technology and Economics Faculty: Faculty of Mechanical Engineering Department: Department of Fluid Mechanics Major/Minor: MSc in Mechanical Engineering Modelling Fluid Mechanics major / Solid Mechanics minor Project Report Title: CFD analyses of an air-jet loom Academic year of submission: 2010 / 2011 - II. I, the undersigned, hereby declare that the Project Report submitted for assessment and defence, exclusively contains the results of my own work assisted by my supervisor. Further to it, it is also stated that all other results taken from the technical literature or other sources are clearly identified and referred to according to copyright (footnotes/references are chapter and verse, and placed appropriately). I accept that the scientific results presented in my Project Report can be utilised by the Department of the supervisor for further research or teaching purposes. Budapest, 13 May, 2011 __________________________________ (Signature) FOR YOUR INFORMATION The submitted Project Report in written and in electronic format can be found in the Library of the Department of Fluid Mechanics at the Budapest University of Technology and Economics. Address: H-1111 Budapest, Bertalan L. 4-6. „Ae” building of the BME. ACKNOWLEDGEMENT It is a pleasure to thank those who made this project possible with their guidance and support. I offer my regards to my supervisor Gergely KRISTÓF for all the help and advices he ensured I also want to thank all the members of the Department of Fluid Mechanics who gave me advices at the evaluation team meetings and supported me to progress in my project. I would like to highlight the help of Viktor SZENTE at constructing the pneumatic arrangement and András GULYÁS at the hot-wire measurements. And I would like to thank for the weaving equipments to Lóránt SZABÓ from the University of Óbuda.
- 4. CFD analyses of an air-jet loom ii ABSTRACT The study is focused on the analysis of the flow induced by an air-jet loom’s sub-nozzle, in the framework of the project a CFD simulation is presented, along with laboratory experiments aim at the validation of the CFD results. The thesis begins with a brief presentation of the weaving process, the development of a weaving loom and operation of an air-jet loom. Subsequently, a hot-wire measurement is introduces, during which the velocity distribution of a sub-nozzle placed at a reed is determined, and the document shows another performed measurement, which goal was to specify drag force acting on a weft while located in its place in the reed. After the description of evaluating the mass-flow rate at the sub-nozzles inlet - an important input parameter of the simulation- in the next chapter the finite-volume model is described, including the geometry and modeling parameters. Out of the modeling aspects the substitution of the reed with a porous zone is a curiosity. The simulation was done with two different mesh densities and the weft was interpreted by a rigid body at one of the calculations. The results conclude that, although the measured and simulated air velocities are converging by mesh refinement, the mesh independent solution is not yet achieved. There is a large discrepancy between the measured and the simulated drag forces, therefore the corresponding mathematical model should be reconsidered. KIVONAT A dolgozat témája a légsugaras szövőgép mellékfúvókájánál kialakuló áramlás vizsgálata, aminek keretein belül a tárgyról készült CFD szimuláció kerül bemutatásra, valamint annak validálásához elvégzett mérések. A munka elején a szövés menete, a szövőgépek fejlődése és a légsugaras szövőgép működése kerül röviden bemutatásra. Ezt követően a borda mellett elhelyezett segédfúvóka sebességterének felvételére készített hődrótos mérést és az áramlásba helyezett fonalra ható erő meghatározását ismerteti a munka. A szimuláció bemeneti paraméteréhez fontos tömeg-áram meghatározása után, magáról a létrehozott véges-elemes modellről olvashatunk, ezen belül a kialakított geometriáról, a beállított modellezési paraméterekről, melyek közül érdekesség a fúvóka melletti borda porózus zónával való helyettesítése. A szimuláció különböző hálósűrűség mellett és a fonal merev testként való behelyezésével is megtörtént. Az eredményekből arra következtethetünk, hogy bár a valós és szimulált sebességprofilok kezdik közelíteni egymást, a hálófüggetlen megoldást még nem értük el.
- 5. CFD analyses of an air-jet loom iii CONTENTS DECLARATION ______________________________________________________________________ I ACKNOLEDGEMENT _________________________________________________________________ I ABSTRACT _________________________________________________________________________ II CONTENTS ________________________________________________________________________ III 1. THE SHORT HISTORY OF LOOMS_________________________________________________1 2. THE AIR-JET LOOM ______________________________________________________________3 2.1 The operation of an air-jet loom 3 3. MEASUREMENT OF THE VELOCITY FIELD________________________________________5 3.1 Equipment 5 3.1.1 Pressure transducer 5 3.1.2 Ohmic thermometer 7 3.1.3 Hot wire 8 3.2 Hot wire measurement 8 3.2.1 Hot wire calibration 8 3.2.2 Hot wire results 9 4. MEASUREMENT OF THE FORCE ACTING ON THE WEFT __________________________ 11 4.1 Measurement arrangement 11 4.2 Force measurement 13 5. MASS FLOW RATE MEASUREMENT______________________________________________ 13 6. SIMULATION OF SIMPLE FLOW FIELD___________________________________________ 16 6.1 Geometry of the model 16 6.1.1 The nozzle 16 6.1.2 The reed 16 6.1.3 Enclosure 17 6.2 Meshing 18 6.3 Simulation settings 18 6.4 Results 19 6.4.1 Velocity distributions 19 6.4.2 Visualized flow field 21 6.5 Pressure at the mass-flow inlet 22 7. SIMULATION OF WEFT__________________________________________________________ 23 7.1 Geometry of the model 23 7.2 Simulation with weft 23 7.3 Results of weft simulation 23 SUMMARY __________________________________________________________________________ 24 BIBLIOGRAPHY_____________________________________________________________________ 26 APPENDIX __________________________________________________________________________ 27
- 6. CFD analyses of an air-jet loom iv LIST OF FIGURES 1.1. Figure Waving frame 1 1.2. Figure Parts of a loom 1 1.3. Figure Ancient and modern loom 2 1.4. Figure Punched card loom 2 2.1. Figure Airjet loom 3 2.2. Figure The composition of the machine's waving part 3 2.3. Figure Subnozzles along the reed 4 2.4. Figure Subnozzle's location, explonation of parts [13] 4 2.5. Figure Different types of sub-nozzle outlets 4 3.1. Figure Measurement arrengement 5 3.2. Figure Oleaginous calibrator with Bourdon manometer 6 3.3. Figure Measured pressures for calibration 6 3.4. Figure Fitted curve for pressure transducers 6 3.5. Figure Calibration of the thermometer 7 3.6. Figure Hot-wire calibration equipment 8 3.7. Figure Hot-wire calibration's King's law 9 3.8. Figure Right-hand side measured velocity distribution 9 3.9. Figure The two measurement positions at the right-hand side 9 3.10. Figure Velocity distribution measured in the middle 10 3.11. Figure Positions of the measurements in the middle 10 3.12. Figure Left-hand side measured velocity distribution 10 3.13. Figure The two measurement positions at the left-hand side 11 4.1. Figure Force measurement arrengement 11 4.2. Figure Calibration with 2.5 g (left) and 6.5 g (right) 12 4.3. Figure Calibration for force measurement 13 4.4. Figure Force measurement on the weft 13 5.1. Figure Mass of air in the reservoir in time 15 6.1. Figure Pictures for modell parameter determination and the coordinate-system 16 6.2. Figure Distances between reedteeth 17 6.3. Figure Geometry and hirher resolution target volume 18 6.4. Figure Boundary conditions 19 6.5. Figure Locations of observed lines 19 6.6. Figure Velocity distribution on the left-hand side (sparse mesh) 20 6.7. Figure Velocity distribution on the left-hand side (denser mesh) 20 6.8. Figure Velocity distribution in the middle-lines (sparse mesh) 20 6.9. Figure Velocity disrtibution on the middle-lines (denser mesh) 20 6.10. Figure Velocity distribution at the right-hand side (sparse mesh) 20 6.11. Figure Velocity distribution at the right-hand side (denser mesh) 20 6.12. Figure Pathlines from inlet of simulated flow-field 21 6.13. Figure Pathlines from reed close nozzle outlet of simulated flow-filed 21 6.14. Figure X velocity distribution on the back of reed 21 6.15. Figure Contour plots of the simulated flow field's z-velocity 22 6.16. Figure Pressure at mass-flow inlet 22 7.1. Figure Position of the weft in the model 23 LIST OF TABLES 3.1. Table Fitting parameters for pressure calibration 7 3.2. Table Fitting parameters for thermometer 7 4.1. Table Data at force measurement 12 4.2. Table Fitting parameters for force measurement 13 5.1. Table Fitting parameters for the mass-flow rate 15 7.1. Table Forces acting on the weft (from simulation) 23 8.1. Table Comparison of measured and simulated velocity distribution 24
- 7. CFD analyses of an air-jet loom 1 1. The short history of looms The process of waving is known since a long time, from BC 8-9, it stands of two distinct sets of yarns or threads to form a fabric or cloth. The threads which run lengthways are called the warp yarns and the ones running across from side to side are the weft yarns or fillings. They passing the weft yarn though the warps in a perpendicular direction, in a way that those are avoiding the warp yarns alternately on top and bottom side. The fiber after passing is pushed to the already woven textile, and the next turn is going the other way creating a kind of mesh, meanwhile the textile (see 1.1. Figure). 1.1. Figure Waving frame As the woven techniques progressed the cloth was woven on looms, a device that holds the warp threads in place while filling threads are woven through them. It fastened the process a lot, because the warp yarns did not have to be separated every time when crossing the weft, instead they were hold by the so called heddles and could be reordered by a lathe (see 1.2. Figure) 1.2. Figure Parts of a loom 1. Wood frame 2. Seat for weaver 3. Warp beam- let off 4. Warp threads 5. Back beam or platen 6. Rods – used to make a shed 7. Heddle frame - heald frame - harness 8. Heddle- heald - the eye 9. Shuttle with weft yarn 10. Shed 11. Completed fabric 12. Breast beam 13. Batten with reed comb
- 8. CFD analyses of an air-jet loom 2 Firstly the yarn was taken from one side to the other by hand, which limited the width of the textile, sometime assistants (mainly children) were sat there to help, later the yarn was put into a capsule called the warp at passing through. At the industrial revolution the flying shuttle was invented by John Key, which is a warp that could be thrown along. On 1.3. Figure you can see two looms operated by mancraft. 1.3. Figure Ancient and modern loom The idea of machine operated looms appeared already in 1678, but was realized only in the 18th century. The first water-power supplied device is dated to 1788; later in the 19th century also steam-powered was used in England. The pattern woven technique by punched card machine was invented by Joseph Marie Jacquard already in 1805, and this was also the first step in automation and control technique. 1.4. Figure Punched card loom Till the middle of the 20th century the looms with flying shuttle were the most efficient, but had the disadvantage of big noise and high energy consumption because of the weft’s weight. The idea of waving without a weft showed up already in the middle of the 19th century, but it could not be realized that time. Nowadays it is already developed and still improved all the time, but loom with wefts are still used some places. Among the nowadays used looms we distinguish the ones with simple weft, with microweft, with rotating weft or with nozzles. Among looms with nozzles there are two types, one with air
- 9. CFD analyses of an air-jet loom 3 and one with water-jet, but the later can be used only at materials which physical properties are not affected by the water, like synthetic yarns. 2. The air-jet loom The power of air was used already 2000 years ago, its industrial usage got significant in the 18th – 19th century, while the industrial revolution such devices were invented like pneumatic post, pneumatic railway break system and jackhammer. The pneumatic systems are still under development [1], one of the big inventions is in the focus of my paper. The air-jet loom’s operation principle was patented in 1946 by the Swiss company Maxbom and soon it begun to be produced. One of the nowadays used machines can be seen on Figure 2.1. 2.1. Figure Airjet loom 2.1 The operation of an air-jet loom The machine is working in a way that, it shoots out the weft yarn from the main nozzle to the gap between the warps with the help of an air-jet. Firstly they did not use sub-nozzles, but after assembling them the speed of waving and the possible width of textile highly increased. These small devices are located along the reed (see Figure 2.2. Figure -2.4) and help the transportation of the weft yarn to the other side. 2.2. Figure The composition of the machine's waving part weft yarn fillings jets of sub-nozzles main-nozzle magnet valve sub-nozzles
- 10. CFD analyses of an air-jet loom 4 On Figure 2.4 we can see the two position of the reed casket. As already mentioned the process starts with the main nozzle shooting out the yarn, and then it is passing along the reed in its “tunnel” and after or -at some machines- meanwhile reaching the other end it is pushed to the already woven textile – changing from 1st to 2nd position. As at the other type of waving instruments the next step is the reordering of the heddle yarns with the eyes and then the process can be repeated again and again. The usage of the sub-nozzles made 541 cm reedlength - and with this textile width - possible, the present air-jet looms can reach a 2000-3000 m/min weft transport velocity, depending on the type of yarn [10], this means that the weft yarn pass over a 5 m wide reed 400-600 times a minute. At the optimization of the operation many aspects need to be considered and the criteria can change depending on the type of the yarn. E.g. the load carrying capacity is different for silk, cotton or wool. For the main nozzle we can find more investigations both experimental and computational [2-4], these are dealing mostly with the main nozzle’s tube length [4-7]. Other, like Kim Chae-Min Lim and his coworkers were publishing about the shear layer and shockwave boundary layer interaction [8], in it an interesting result was the fact that their model did not work and gave back the reality [9] above the pressure ration 1.93, where the pressure ratio was defined as the ratio of the static pressure in tube and environment. For the sub-nozzle we can hardly find an article, probably there are just industrially concealed results yet and as told some of the settings are based on practical experimentations. The most interesting parameters could be the pressure supply, the direction of the jet and the necessary operating time. We can also find many types of outlets and orientations on the picture below. 2.5. Figure Different types of sub-nozzle outlets The nozzle investigated in this paper is a one holed type 2.3. Figure Subnozzles along the 2.4. Figure Subnozzle's location, explonation of parts sub-nozzle textil reed weft yarne gap heddle yarne eye 1st position 2nd position reed cascet
- 11. CFD analyses of an air-jet loom 5 3. Measurement of the velocity field For measuring the velocity distribution of the sub-nozzle’s flow field hot wire measurements has been made. The measurement was done on the following arrangement: The pressure at the tube before the nozzle (p2) was kept on constant with the help of the pressure controller (PC), and the reservoir was kept on a higher p0 pressure by the compressor. To have more information about the boundary conditions of the model not only the pressure, but the temperature was measured as close to the nozzle as possible (p2,T2) with an ohmic thermometer and a pressure transducer, whose signal was sampled by computer. Finally the nozzle was fixed to the read and got the supply through pipes similar to the industrial ones. For assembling the read and the nozzle together the industrial arrangement was the base, naturally at constructing the model for simulation we considered our dimensions to decrease the differences of the model and measured reality. 3.1 Equipment At the measurement the following equipment has been used: - Compressor - Pressure transducer - Ohmic thermometer - Pressure controller - Hot-wire 3.1.1 Pressure transducer I have used Nivelco NIPRESS DH1-7324 type pressure transducer, which had to be first calibrated. The calibration device is shown on the following picture: pr (t) T T p2 PC Compressor p0 T1 nozzle 3.1. Figure Measurement arrengement
- 12. CFD analyses of an air-jet loom 6 3.2. Figure Oleaginous calibrator with Bourdon manometer The calibration was managed by a hydraulic oil calibrator. The results show some deviance from a linear characteristic, but there was no hysteresis, which means the pressure can be determined univocal. 0 1 2 3 4 5 6 7 8 0,5 0,6 0,7 0,8 0,9 1,0 1,1 1,2 1,3 U1(V) p (bar) U1 U1m Ub Reservoir's pressure transducer 0 1 2 3 4 5 6 7 0,4 0,5 0,6 0,7 0,8 0,9 1,0 1,1 1,2 1,3 Channel's pressure transducer U(V) p (bar) U1 U1m Ub 3.3. Figure Measured pressures for calibration On the graph the two voltage values measured while increasing the pressure U1 and U1m refers to the small fluctuation in the signal, U1 is the highest and U1m is the smallest value at a given pressure, we can see, that the fluctuation was quite small and can be neglected. The Ub values show the measured voltage while decreasing the pressure from 7 to zero bars. After taking the average of the three data for both transducers an exponential curve was fitted. The parameters of the curves and the plots of the fits are shown in 3.4. Figure and 3.1. Table 0,5 0,6 0,7 0,8 0,9 1,0 1,1 1,2 0 1 2 3 4 5 6 7 Reservoir's pressure transducer p(bar) U (V) p Fitted line 0,5 0,6 0,7 0,8 0,9 1,0 1,1 1,2 1,3 0 1 2 3 4 5 6 7 tube's pressure transducer p(bar) U (V) p Fitted curve 3.4. Figure Fitted curve for pressure transducers pressure transducer weigths Bourdon manometer
- 13. CFD analyses of an air-jet loom 7 Equation of fitted curve: p[bar]= A1*exp(-U[V]/t1) + y0 for tube for reservoir Value Standard Error Value Standard Error y0 -3.0013 0.13069 -4.50539 0.38443 A1 1.40198 0.07575 2.36366 0.26211 t1 -0.62303 0.01356 -0.77555 0.03939 R2 0.9998 0.99939 3.1. Table Fitting parameters for pressure calibration Where R2 is a Q factor of the fit (closer to value 1 is better), for further details see appendix. 3.1.2 Ohmic thermometer The ohmic thermometers had a wide measurement range; it was earlier calibrated between -50 and 630 °C, where it came up that the temperature is almost linear with the resistance (1.1% highest deviance). The computer measures the voltage on the resistance for given current supply, which will be also proportional with the temperature. To be sure I have made a calibration for both thermometers with 0°C ice-water mixture and water cooling down from 100°C to 95°C. Finally for these two points a lline was fitted to the voltage (U)- temperature (T) connection, this can be obtained on the following figure. 0,85 0,90 0,95 1,00 1,05 1,10 1,15 0 20 40 60 80 100 Temperature(°C) Voltage1 (V) Temperature reservoir Temperature tube 3.5. Figure Calibration of the thermometer The lines are described by the equation T=A+B·U, which parameters are in table 3.2. parameter Reservoir Tube A (intercept) -349.94404 -310.06094 B (slope) 410.73244 356.39189 3.2. Table Fitting parameters for thermometer
- 14. CFD analyses of an air-jet loom 8 3.1.3 Hot wire Hot wire is a well-known velocity measurement device, which is based on the cooling property of the gas flow with given temperature. The technique depends on the convective heat loss to the surrounding fluid from an electrically heated sensing element or probe. If only the fluid velocity varies, then the heat loss can be interpreted as a measure of that variable. Hot-wire sensors are, as the name implies, made from short lengths of resistance wire and are circular in section. The rate of heat loss to the fluid is equal to the electrical power delivered to the sensor V2 /R where V is the voltage drop across the sensor and R is its electrical resistance. Meanwhile the measurement the voltage is recorded, and from that value the perpendicular component of the velocity can be calculated. For further details see [14]. 3.2 Hot wire measurement 3.2.1 Hot wire calibration For the measurement the hot wire needs to be calibrated every time, when the properties of the environment are expected to be changed (e.g. the temperature increased in the room). This is done by its own calibration equipment, which includes a Laval nozzle connected to a pressure transducer and a stand that holds the wire’s handle (see on Figure below): 3.6. Figure Hot-wire calibration equipment After entering the environmental temperature, pressure and the cold resistance of the wire for the program, we can start the calibration by increasing the supply pressure, and thereby the velocity at the nozzle. The program itself calculates the corresponding velocity and registers the measured voltage. At the end we can fit the calibration curve regarding the King’s law, which can be considered valid at a wider region than the calibration was done. The fitted curve for one of the measurements can be seen below.
- 15. CFD analyses of an air-jet loom 9 3.7. Figure Hot-wire calibration's King's law 3.2.2 Hot wire results After calibration the measurements could be done along the 9 lines parallel to the reed, which start from the outlet of the nozzle and goes for the different distances from the inner side of the pit. The velocity distribution along all measurement lines are shown on the following graphs with the punctual positions, which can be observed on the pictures below the diagrams. At the right-hand side: 0 25 50 75 100 125 150 175 200 225 0 10 20 30 40 50 60 70 80 90 100 110 v(m/s) x (mm) 2mm 5mm 3.8. Figure Right-hand side measured velocity distribution 3.9. Figure The two measurement positions at the right-hand side
- 16. CFD analyses of an air-jet loom 10 In the middle: 0 25 50 75 100 125 150 175 200 225 0 20 40 60 80 100 120 140 v(m/s) x (mm) 2mm 5mm 8mm 12mm 3.10. Figure Velocity distribution measured in the middle 3.11. Figure Positions of the measurements in the middle At the left-hand side: 0 20 40 60 80 100 120 140 160 180 200 220 0 10 20 30 40 50 60 70 80 90 100 v(m/s) x (mm) 2mm 5mm 8mm 3.12. Figure Left-hand side measured velocity distribution
- 17. CFD analyses of an air-jet loom 11 3.13. Figure The two measurement positions at the left-hand side At the last measurements we can see that the data go only 45 mm close to the nozzle outlet. The reason was the fear from broking the wire, because at the second data series a good quality wire was damaged at the velocity of 120 m/s, and for the next one we could not be sure to stand such a high velocity. At this measurement the pressure in the tube before the nozzle (on Figure 3.1. p2) was 3.62±0.03 bar, which is about the lower limit for supply pressure in industrial applications. Therefore lower pressure measurements would not have sense. A higher pressure measurement should be done, but it was not possible, because the hot-wire would not be able to handle an even higher velocity. 4. Measurement of the force acting on the weft First the weft should be purchased; the textiles are characterized by their specific density for length. The unit is the so called tex, and it gives the weight of a one kilometer long yarn. We can also take difference between simple and multifilament strings; we have investigated the latter one, this is a multitude of fine, continuous filaments, with some twist, and it is clamped together every 1-2 centimeter. The average diameter of the weft was measured [13] as da,w=0.634 mm. The measurement was done with the help of a pendulum, the force acting on the weft was pulling the end of the pendulum, and the angle of rotation could be observed and used to calculate the searched value. 4.1 Measurement arrangement The measurement arrangement can be seem in the picture below: 4.1. Figure Force measurement arrengement weftnozzlereed pendulum scale
- 18. CFD analyses of an air-jet loom 12 The weft was bound to the end of the pendulum, and it was lead through the tunnel created for it in the reed. At the other end it was lead over a beam and a small hook was fixed there, which made possible to hang weights there. The weight of the hook is so small, that it can be neglected regarding to the other errors coming from the friction and value reading. The constructed device had to be first calibrated with very small weights from 0.5 to 7 grams, from which the force could be easily calculated by simply multiplying it with the gravitational acceleration, 9.8 m/s. At every loading a picture was taken from which the angle of rotation could be read out with the help the reference line - the 90° line on calibrator picture. Two of the pictures from the calibration can be seen below. 4.2. Figure Calibration with 2.5 g (left) and 6.5 g (right) The forces respects to the pendulum’s angle of rotation are present on 4.3. Figure with the fitted line. The data are shown below: m g 0 0,5 1 1,5 2 2,5 3 F mN 0 4,9 9,8 15 20 25 29 αrel ° 0,49 0,67 0,64 1,67 2,40 2,45 2,71 α ° 0,00 0,18 0,15 1,17 1,91 1,96 2,22 m g 3,5 4 4,5 5 5,5 6 6,5 7 F mN 34 39 44 49 54 59 64 69 αrel ° 3,85 4,14 4,39 4,30 4,34 4,59 5,01 5,21 α ° 3,36 3,65 3,90 3,81 3,85 4,10 4,52 4,72 4.1. Table Data at force measurement - αrel [°] Relative angle from reference line - α [°] Angle of rotation - m [g] Hanged mass - F [mN] Force acting on the yarn
- 19. CFD analyses of an air-jet loom 13 0 1 2 3 4 5 0 10 20 30 40 50 60 70 F Linear Fit of F F(mN) alpha (°) 4.3. Figure Calibration for force measurement where - α [°] pendulum’s angle of rotation - F [mN] force acting on the yarn And the parameters of the fitted line F= B·alpha are below: R2 B Value Value Standard Error 0.99914 12.966 0.457 4.2. Table Fitting parameters for force measurement The most probable source of error is the presence of Coulomb friction between the yarn and the rod and the end of the reed. Although we tried to choose the smoothest rod and, every time a small wobble was done on it, to let the yarn move easier, the deviance from linear is significant. 4.2 Force measurement When the calibration was finished the pressure was gain on the nozzle and as the jet started to act on the weft a considerable rotation could be observed on the pendulum, the force was evaluated by taking a picture (Figure 4.4) and analyzing it. The angle of rotation was 3.97°, which meant F = (12.966±0.457)·3.97 = 51.47±1.813 mN This sounded realistic based on some previous measurements [13] for the whole system. 5. Mass flow rate measurement As the nozzle was supplied from a huge reservoir, the mass flow rate was derived from the pressure and temperature change in it. Counter to the hot-wire measurement, when continuous refill was ensured by compressor, in this case the tank was filled up to 5.5 bars and let deflated – 4.4. Figure Force measurement on the weft
- 20. CFD analyses of an air-jet loom 14 higher pressure could not be controlled. Unfortunately only after a certain time has the pressure in the pipe and thus the flow reached its stationer mode, and since the reservoir was not allowed to be refilled only a short time remained to done the measurement. The parameters were recorded till the pressure at the tube was constant (and its value was the same as at the measurements, 3.62 bar). The air was considered as ideal gas which meant from the gas law the mass follows the expression ( ) ( ) ( )tTR tpV tm air ⋅ ⋅ = 5.1 Where - m [kg] Mass - V [m3] Volume - p [Pa] Pressure - Rair [J/(kg·K)] Specific Gas Constant of Air - T [K] Temperature And volume of the reservoir was 50 m3 , and the gas constant for air was taken for 286.9 J/(kg·K). The pressure went from 4.4 to 3.8 bars and the temperature from 22.5 to 21 °C. Both the pressure and the temperature have an error, what have to be considered. Taking the quadratic error propagation, we can say for the relative error of mass: 22 ∆ + ∆ = ∆ p p T T m m 5.2 - ∆m [kg] Error of the mass - ∆T [K] Error of temperature 5 - ∆p [Pa] Error of pressure 0.2·105 For the pressure error I considered the steepest part of the corresponding exponential curve (at 4.4 bar) and multiplied it with the fluctuation width of the voltage. For the temperature error I have taken the difference of the starting and ending value, this is a very huge over-estimation of error, but the time reaction of the thermometer was not responsible. Considering these respectively high errors we will have still just 6% relative error in the mass. The pressure data can be considered as proper data in time, but the thermometer had inertia at response for temperature change. These give some more deviation from the real values, but we can say it will remain about a 10% relative error. From the mass (m)-time (t) graph seen below the mass flow could be easily calculated via finding the slope of the linear fit on the data. The original curve was a bit noisy, therefore smoothing was done before evaluating.
- 21. CFD analyses of an air-jet loom 15 5.1. Figure Mass of air in the reservoir in time The fitted m=A+B·t line had the parameters R2 A B Value Value Standard Error Value Standard Error 0.99914 2.92619 9.97762E-5 -0.00177 3.40522E-7 5.1. Table Fitting parameters for the mass-flow rate The source of errors in this measurement is mainly the inertia of the thermometer’s response. Probably the temperature changed faster than it was registered, but we can consider it as part of the error. Finally the mass-flow rate can be derived as qm = 1.77 ±0.177 g/s. 175 200 225 250 275 300 325 350 375 400 2,1 2,2 2,3 2,4 2,5 2,6 2,7 2,8 mass(kg) time (s) Smothened curve Linear fit
- 22. CFD analyses of an air-jet loom 16 6. Simulation of simple flow field The simulation was done by ANSYS Workbench. Started with the creation of the geometry and went on with the mesh generation. With the ready mesh the next step could be done, i. e. the simulation parameters and the initial conditions were set. And finally the simulations could be run and evaluated. 6.1 Geometry of the model The geometry – as already mentioned – was based on the measurement arrangement. 6.1.1 The nozzle The CAD model of the nozzle was available [13] and its accurate position was specified by taken pictures, for distances with the presence of a graph paper as seen below on 6.1. Figure. 6.1. Figure Pictures for modell parameter determination and the coordinate-system Although the distances could be quite well defined this way, they still have an uncertainty, especially in angles was hard to define. 6.1.2 The reed The read stands of small slabs called reedtheeth, and they would be hard to implement one by one, therefore the whole lamella was modeled by a continuous porous zone. The basis to set the porosity parameter in Fluent was the approximation of the velocity profile between the reedtheeth with the one belonging to a flow field between two flat planes. This meant a parabolic distribution reaching its maxima at the midline among the lamellas, and acquire zero at the walls. Considering the x axis perpendicular to the reed and the z axis parallel, starting from the wall (as they are in Fluent, and as it can be seen above), the following expressions can be written: ( )2 2 max 2/D zDz v=v − ⋅ 6.1 Where - vmax [m/s] Maximum value of velocity - D [m] The distance between the reedtheeth - z [m] z coordinate From this the average velocity, vaverage with integration z x y z x D
- 23. CFD analyses of an air-jet loom 17 ∫⋅ D average v=vdz D =v 0 max 3 21 6.2 The wall shear stress (τ) looks like dz dv µ=τ 6.3 where µ is the viscosity. From the equilibrium of the force exerted by the pressure difference (∆p) along an L distance and the wall shear stress τ⋅=⋅∆ LDp 2 6.4 This means 2 max 0=z D v µ12= D 4v µ D 2 = dz dv µ D 2 = L ∆p 6.5 The porous zone is represented in Fluent with an S source term introduced to the standard fluid flow equations, where its component in the i direction is ii vS α µ −= 6.6 where α, the permeability is defined with the nexus ∑− 3 1=j j i i v α µ = L ∆p 6.7 If assuming that the pressure drop depends only on the velocity magnitude in the same direction we can compare the equation 6.5 and 6.7 resulting ⋅ 2 7 2 1 10655.6 1 12 m = D =α 6.8 Where D = 0.424 mm was predicted from the real reed shown below. 6.2. Figure Distances between reedteeth In the other direction a one order higher porosity was set to model the imprenetlability. 6.1.3 Enclosure Around the nozzle and read an enclosure volume was created, where the distances were based on previous simulations. The sizes of the bounding box are in the (x,y,z) directions (0.05, 0.093, 0.26) meter.
- 24. CFD analyses of an air-jet loom 18 6.2 Meshing At meshing different dense resolutions were created, but at both a target volume was performed at the nozzle outlet to ensure a higher resolution for outflow, as seen on 6.3. Figure. 6.3. Figure Geometry and hirher resolution target volume First a very simple 300 000 celled one was generated than a denser one with 1.2 million cells, both with tetrahedral elements. 6.3 Simulation settings As first try steady simulation was done, but it seemed unstable, therefore the final project had time dependence, which seemed stable. The further settings can be red below - Time dependent solver - Density-based solver - Realizable k-ε model - Standard Wall function as wall treatment - Energy equation was also implemented The air was considered as compressible, ideal gas with the basic set properties of ANSYS Fluent. The Fluent sets for basic properties of air: - Cp [J/(kg·K)] Specific Heat 1006.43 - λ [W/(m·K)] Thermal Conductivity 0.0242 - υ [kg/(m·s)] Viscosity 1.7894·10-05 - M [kg/kgmol] Molecular Weight 28.966 The boundary conditions were set to pressure farfield, beside the inlet of the nozzle was considered as a mass flow inlet, which value was originated from the measurement. On the figures bellow the farfields are colored by brown and the mass-flow inlet by blue, the green colored part is the reed. target volume
- 25. CFD analyses of an air-jet loom 19 6.4. Figure Boundary conditions 6.4 Results The most important results were the velocity distribution at the measurement lines. From the pictures of the measurement the accurate positions of the lines were located. In order to have the same variable a custom field function had to be defined, i.e. the component perpendicular to the reed was taken out, and with this the new variable vrel is 22 zyrel vvv += 6.1 where - vy [m/s] the y component of velocity - vz [m/s] the z component of velocity 6.4.1 Velocity distributions On the following graphs we can see the velocity distributions along different lines parallel to the reed (z axis). These lines had the butting point as it shown on the picture below, and they are noted with the numbers near to the points. 6.5. Figure Locations of observed lines At the graphs the number after the vrel refers to the line number on the picture above. mass-flow inlet 1 2 4 3 5 6 7 8 9
- 26. CFD analyses of an air-jet loom 20 Coarser mesh Denser mesh At the left-hand side 0,00 0,05 0,10 0,15 0,20 0,25 0 10 20 30 40 50 60 70 vrel(m/s) z (m) vrel1 vrel2 vrel3 6.6. Figure Velocity distribution on the left-hand side (sparse mesh) 0,00 0,05 0,10 0,15 0,20 0,25 0 20 40 60 80 100 120 140 vrel1 z (m) vrel1 vrel2 vrel3 6.7. Figure Velocity distribution on the left-hand side (denser mesh) In the middle line: 0,00 0,05 0,10 0,15 0,20 0 10 20 30 40 50 60 70 80 90 vrel(m/s) z (m) vrel4 vrel5 vrel6 vrel7 6.8. Figure Velocity distribution in the middle-lines (sparse mesh) 0,00 0,05 0,10 0,15 0,20 0,25 0 20 40 60 80 100 120 vrel(m/s) z (m) vrel5 vrel6 vrel7 6.9. Figure Velocity disrtibution on the middle-lines (denser mesh) At the right-hand-side 0,00 0,05 0,10 0,15 0,20 0,25 0 10 20 30 40 50 vrel(m/s) z (m) vrel8 vrel9 6.10. Figure Velocity distribution at the right- hand side (sparse mesh) 0,00 0,05 0,10 0,15 0,20 0,25 0 10 20 30 40 50 60 70 80 vrel(m/s) z (m) vrel8 vrel9 6.11. Figure Velocity distribution at the right- hand side (denser mesh)
- 27. CFD analyses of an air-jet loom 21 We can see that for the denser mesh the velocities reach a higher value, that is why we cannot state that our solution is mesh-independent. Further investigation should be done, with denser and higher quality meshes. Unfortunately because of the lack of time this was not possible yet. The source of the fluctuation on the distributions can be because of the distorted cells. 6.4.2 Visualized flow field Techplot was used while the below pictures were created. The pathlines coming out from the nozzles have been visualized as below at 8.8 s flowtime: 6.12. Figure Pathlines from inlet of simulated flow-field 6.13. Figure Pathlines from reed close nozzle outlet of simulated flow-filed We can see that the pathlines are situated at first in the tunnel for the yarn as expected, but after that they are disappearing in the reed or turning back and generating a kind of vortices. To gain further knowledge about the air departing through the reed the reed perpendicular velocity component is plotted on the next picture. 6.14. Figure X velocity distribution on the back of reed We can see that the main part stands of a small, varying inflow-outflow part – velocities between [-1,1] m/s –,there is a more significant outflow where the pathlines reach the reed and also a bit more intensive inflow where the pathlines are separating and starting to form the vortices. XZ Y
- 28. CFD analyses of an air-jet loom 22 For first sight we could be suspicious that the solution is not converged yet, but after running the simulation for further 4.2 seconds we had still the same results. For further investigations I made contour plots of the reed parallel velocity component in different heights: 6.15. Figure Contour plots of the simulated flow field's z-velocity We can see what the pathlines showed too, the nozzle blows the air against the reed and then a kind of separation appears and the flow does not contain its way along the hollow. One of the reasons can be the too high porosity of the reed. 6.5 Pressure at the mass-flow inlet The pressure has been checked at the mass-flow inlet, to have a baseline for comparison with real pressure in the tube before the nozzle. 6.16. Figure Pressure at mass-flow inlet y=48mm y=46mm y=42mm y=44mm YZ X
- 29. CFD analyses of an air-jet loom 23 The pressure on the inlet was between 3.654 and 3.652 bar, which is quite close to the measured value on the transducer before the nozzle (p2 pressure on Figure 3.2). 7. Simulation of weft 7.1 Geometry of the model The base geometry was the same as for the previous described case, but the weft as a rigid body was put into the picture realized as a cylinder along the reed. In reality the weft is more or less changing its position, but from consultation [13] the usual position of it was given as 3 mm-s from the top and 2 mm-s from the inner side of the tunnel in the reed. The diameter of the cylinder was equal to the average thickness of the weft, 0.634 mm. 7.1. Figure Position of the weft in the model 7.2 Simulation with weft The main properties were the same as at the previous simulation, the only difference was in the mesh, which need to have a higher resolution at the weft. 7.3 Results of weft simulation Unfortunately as we did not have a satisfying velocity distribution without the weft, therefore we could not have high expectations for this simulation. The resultant integrals on the weft are summarized in the following table: X-Force: -2.062099e-003 Y-Force: -4.819360e-004 Z-Force: 1.260997e-004 7.1. Table Forces acting on the weft (from simulation) We can see the forces do not reach the order of magnitude of the real one, of course till the original flow-field is not reliable, but such a huge difference is not justified. Probably the rigid body model is too simple to treat this case. 3 mm 2 mm
- 30. CFD analyses of an air-jet loom 24 8. Summary Firstly the velocity distributions should be compared, these are summarized in 8.1. Table. Hot-wire measurement Simulated right-hand side 0 25 50 75 100 125 150 175 200 225 0 10 20 30 40 50 60 70 80 90 100 110 v(m/s) x (mm) 2mm 5mm 0 25 50 75 100 125 150 175 200 225 10 20 30 40 50 60 70 80 90 100 110 v(m/s) z (mm) 5mm 2mm middle-line 0 25 50 75 100 125 150 175 200 225 0 20 40 60 80 100 120 140 v(m/s) x (mm) 2mm 5mm 8mm 12mm 0 25 50 75 100 125 150 175 200 225 0 20 40 60 80 100 120 140 v(m/s) z (m) 2mm 5mm 8mm left-hand side 0 20 40 60 80 100 120 140 160 180 200 220 0 10 20 30 40 50 60 70 80 90 100 v(m/s) x (mm) 2mm 5mm 8mm 0 20 40 60 80 100 120 140 160 180 200 220 0 20 40 60 80 100 120 140 v(m/s) z (mm) 2mm 5mm 8mm 8.1. Table Comparison of measured and simulated velocity distribution
- 31. CFD analyses of an air-jet loom 25 We can immediately see that the velocities are higher at the reality, this can be a result of the not properly set mass-flow inlet or as well the unsatisfactory mesh quality. The latter opportunity is more probable, because the pressure at inlet for the set mass-flow rate was quite close to the measured value not far from the nozzle inlet. As we saw for denser mesh the velocity values increased, therefore an even higher cell numbered and better quality mesh could help to have more realistic results. The second peak at the measured velocity profile can be due to a kind of reflection of the original air-jet, which can be observed at the z-velocity contour plots of the simulation on 6.15. Figure as weel. but the two peaks do not appear. The reason of this can be the not properly set angle of the nozzle or another source of this error can be the difference between the spreading rate of simulated and real jet. If we assume that the jet in reality is more narrow the hot-wire measurements can be considered as the flow is firstly propagating to the read, than changing its direction while separating and this is why we see a “gap” after the main peak. And since the simulation gives a wider jet, it covers also the “gap” and result a continuous peak in the velocity distribution. According to the simulation of the weft we can say that, although the velocity profiles do not differ in orders of magnitude, the forces do. This can be originating from inadequate model that the weft was substituted with a rigid body. Probably a porous zone would give a better solution, but till easy to implement.
- 32. CFD analyses of an air-jet loom 26 BIBLIOGRAPHY [1] Szabó Lóránt: A sűrített levegő a textiltechnológiában, Magyar Textiltechnika LXII. ÉVF. 2009/1 [2] Korea Textile Machinery Research Institute: High Performance Shuttleless Loom System Development, 2003 [3] Lim, C. M.; Lee, K. H; Kim, H. D.: The Study of the Gas Flow through a Texturing Nozzle, Proceedings of KSME Fall Meeting, Pyeongchang, pp. 2163—2168, (2005) [4] Lim, C. M.; Lee, H. J.; Lee, K. H.; Kim, H. D.; Chun, D. H.: A Computational Study of the Air-Texturing Nozzle Flow, Proceedings of KSME Spring Meeting, Seogwipo, pp.3417— 3421, (2006). [5] Pianthong, K.; Zakrzewski, S.; Behnia, M.; Milton, B. E.: Characteristics of Impact Driven Supersonic Liquid Jets, Shin, [6] C. H.; Kim, K. H.; Kwon, Y. H.; Kim, S. J.: Flow Characteristics of the Main Nozzle with Different Tube Lengths in an Air-Jet Loom, Proceedings of KFS Spring Meeting, Seoul, pp.99— 102, (1996). [7] Kim, K. H.; Kim, Y. S.; Kim, S. J.: A Study on the Analysis and Design of Air Flow Behavior in the Nozzle of Air Jet Loom(III)-Natural Suction of the Double Coaxial Jets, Journal of the Korean Fiber Society, 35(4), pp. 249—256, (1998). [8] Kim, Chae-Min Lim, Ho-Joon Lee, Doo-Hwan Chun, Heuy-Dong: A Study of the Gas Flow through Air Jet Loom, [9] Matsuo, K.; Miyazato, Y.; Kim, H. D.: Shock train and pseudo-shock phenomena in internal gas flows, Progress in Aerospace Sciences, 35(1), pp. 33—100, (1999). [10] Based on the article International Textile Bulletin 2002/5. composed Szabó Rudolf: Vetülékbeviteli rendszerek Magyar textiltechnika 2003/3 page 76. [11] Szabó Lóránt: Kutatási terv, Nyugat-Magyarországi Egyetem Faipari Mérnöki Kar Cziráki József Faanyagtudomány és Technológiák Doktori Iskola, Budapest, 4th june 2007. [12] ANSYS FLUENT Theory Guide [13] Oral consultation with Szabó Lóránt, Budapesti Műszaki Főiskola, adjunct [14] University of Cambridge Turbomachinery Department, webserver of current researches http://www-g.eng.cam.ac.uk/whittle/current-research/hph/hot-wire/hot-wire.html, Cited 3rd May, 2011. [15] Origin theory guide
- 33. CFD analyses of an air-jet loom 27 Appendix Quality of Fit [15] “One obvious metric for the quality of the fit is how close the fitted curve is from the actual data points. The value of residual sum of square (RSS) varies from dataset to dataset, making it necessary to rescale this value to a uniform range. On the other hand, one may want to use the mean of y value to describe the data feature. If it is the case, the fitted curve is a horizontal line , and the predictor x, cannot linearly predict the y value. To verify this, we first calculate the variation between data points and the mean, the "total sum of squares" about the mean, by In least-squares fitting, the TSS can be divided into two parts: the variation explained by regression and that not explained by regression: • The regression sum of squares, SSreg, is that portion of the variation that is explained by the regression model. • The residual sum of squares, RSS, is that portion that is not explained by the regression model. Clearly, the closer the data points are to the fitted curve, the smaller the RSS and the greater the proportion of the total variation that is represented by the SSreg. Thus, the ratio of SSreg to TSS can be used as one measure of the quality of the regression model. This quantity -- termed the coefficient of determination -- is computed as: ”