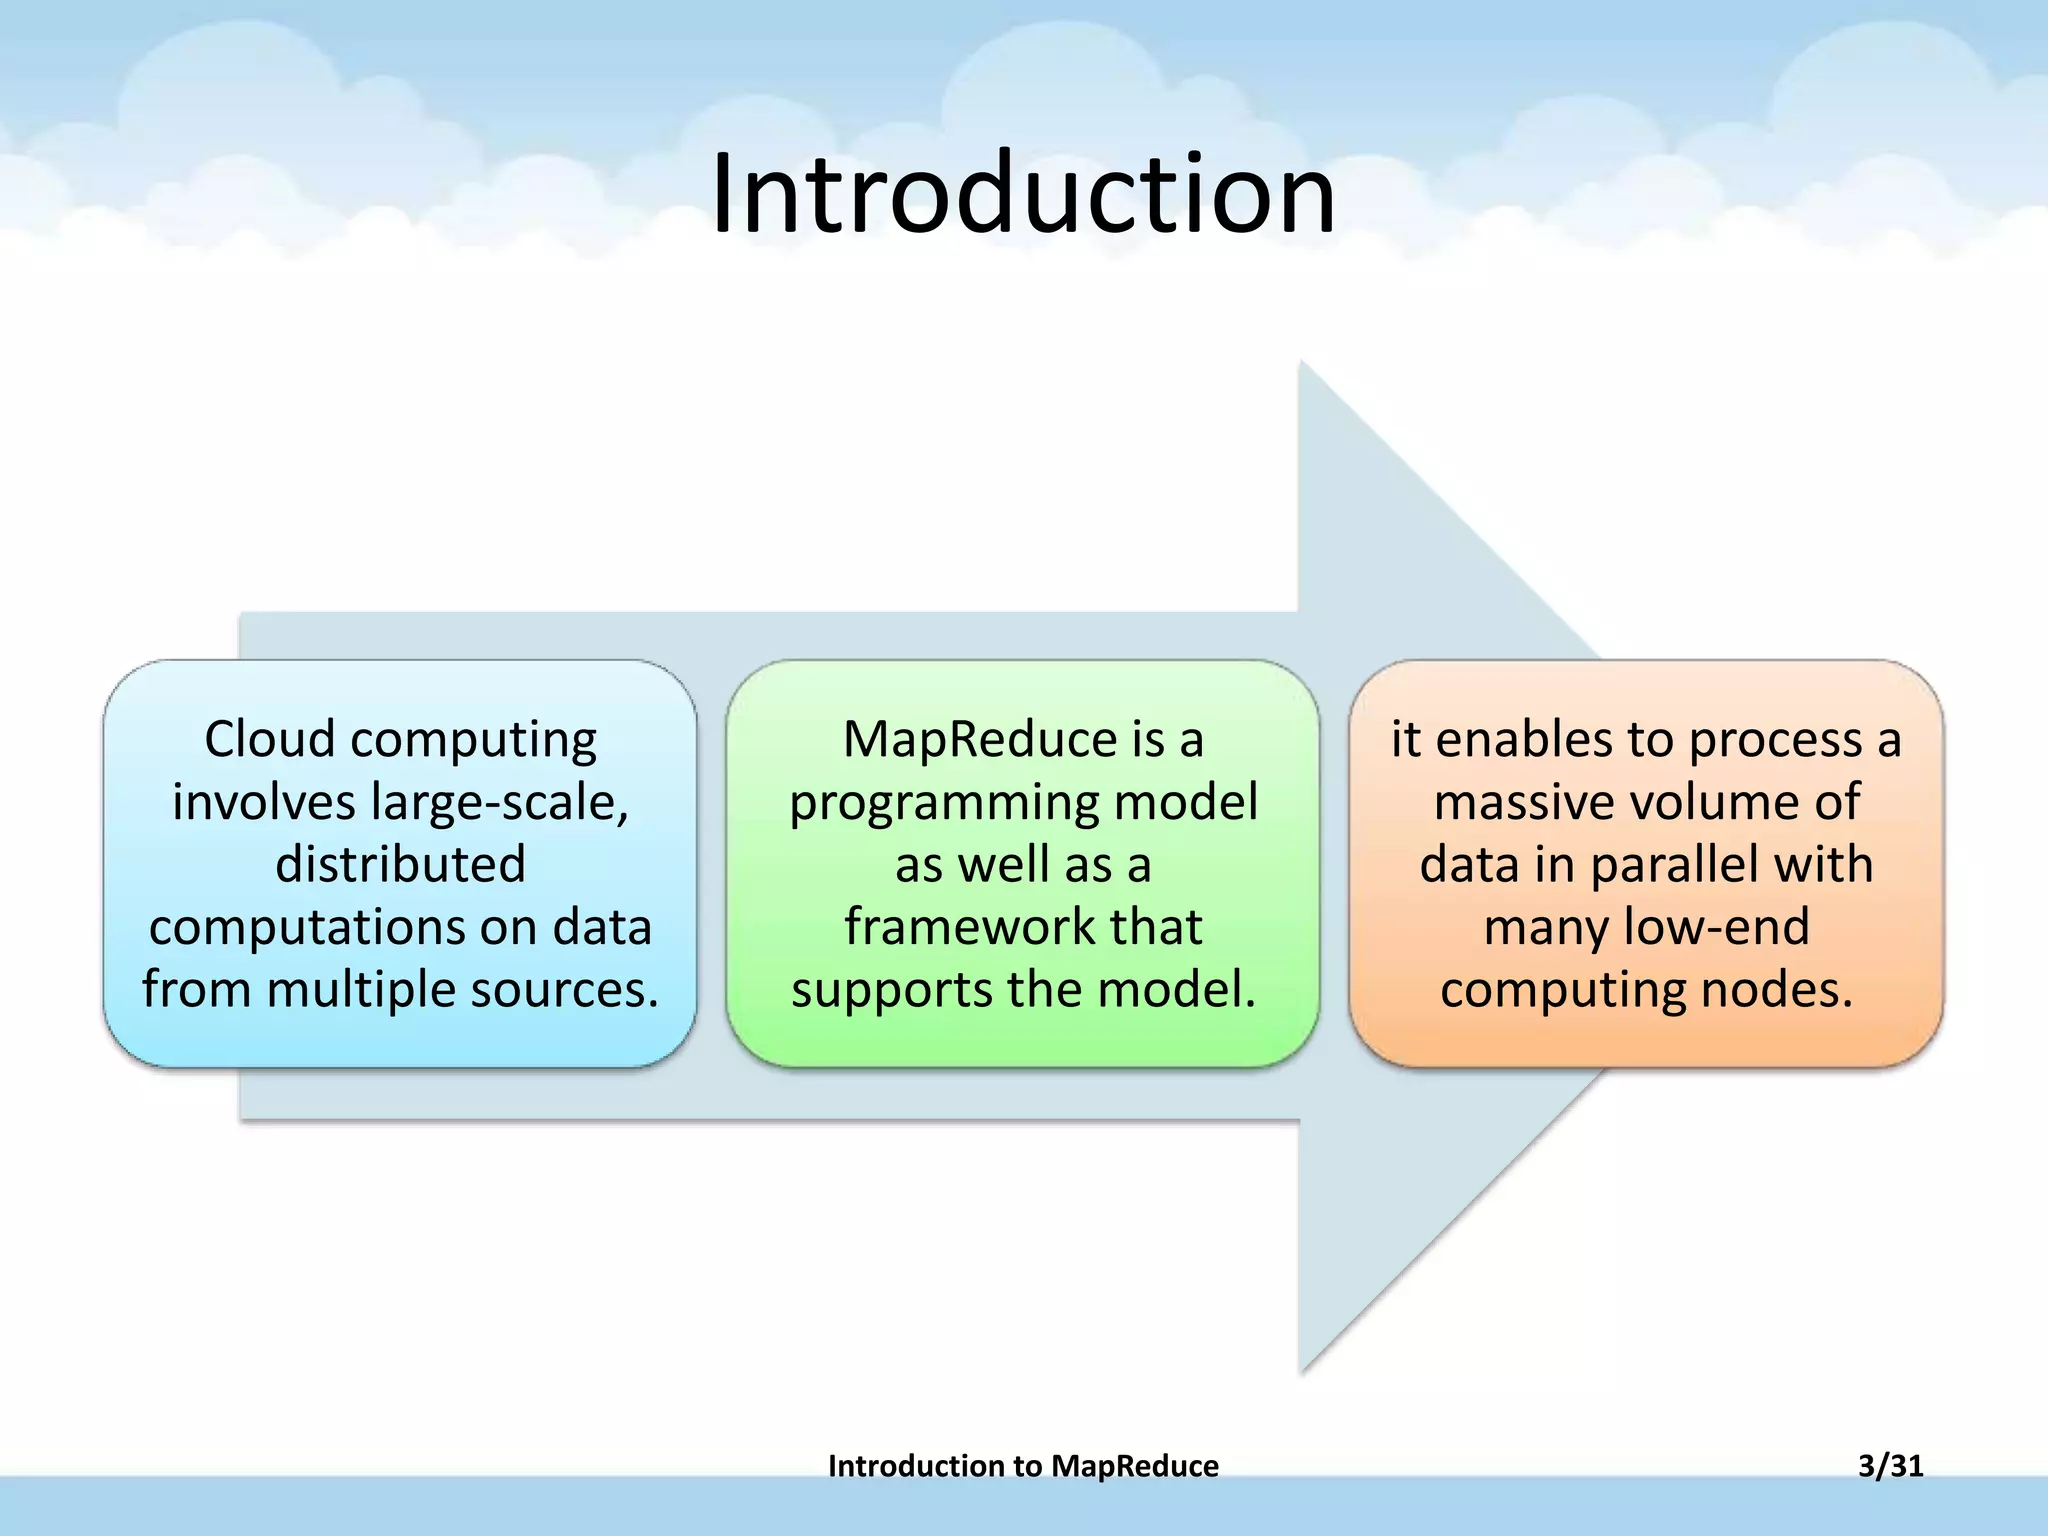
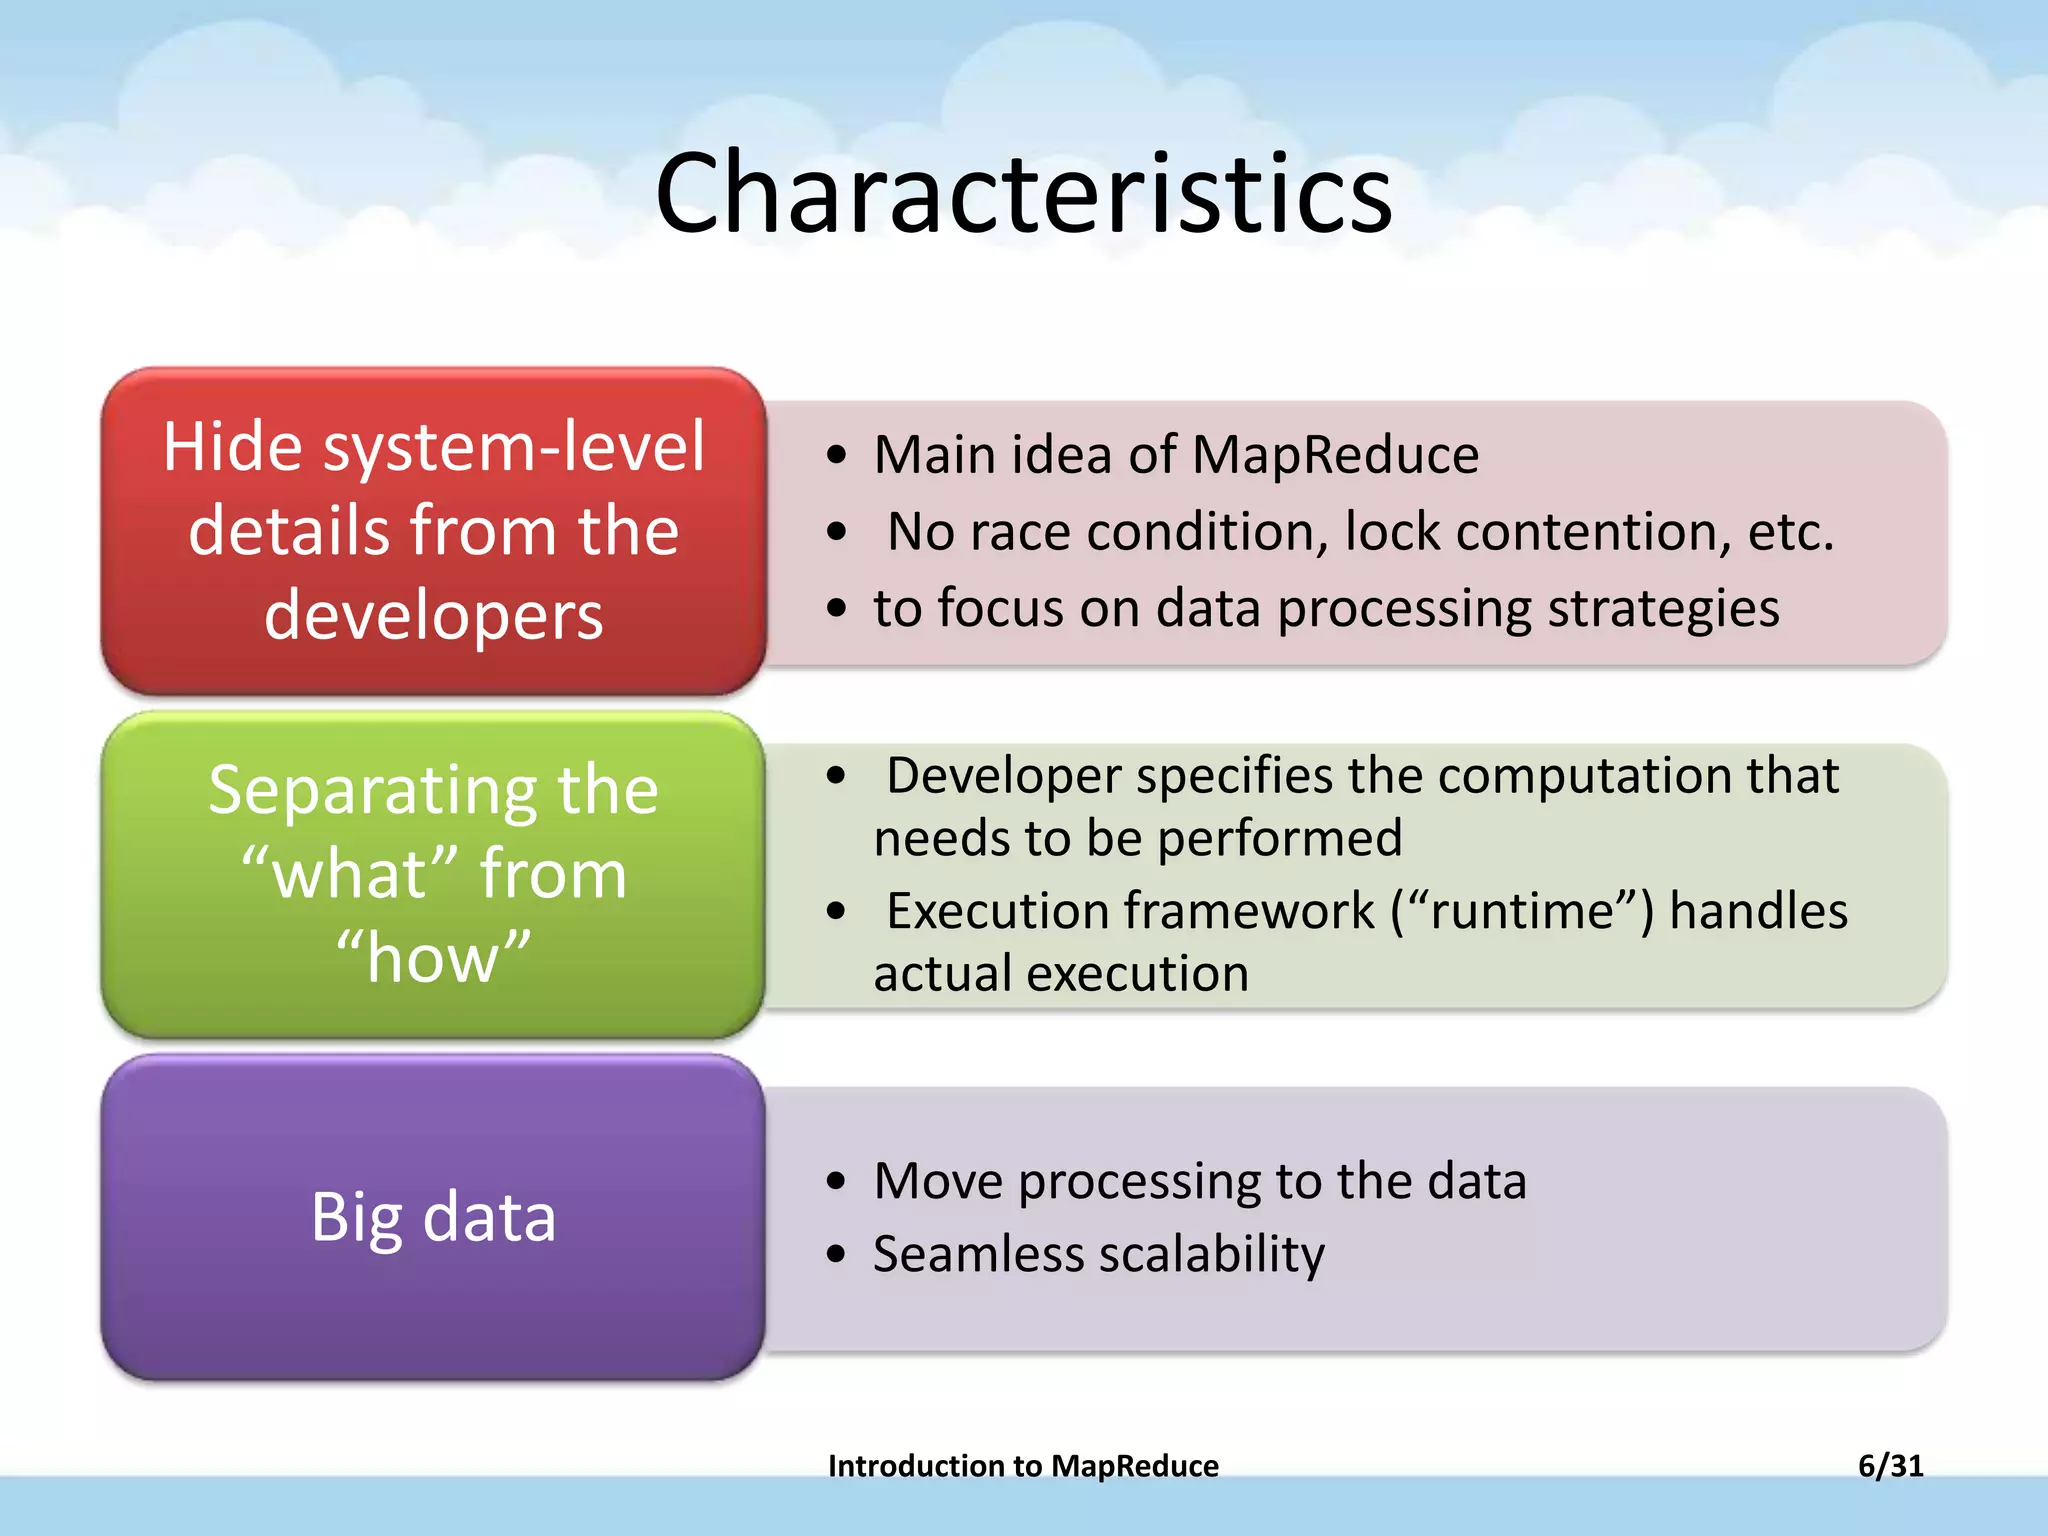
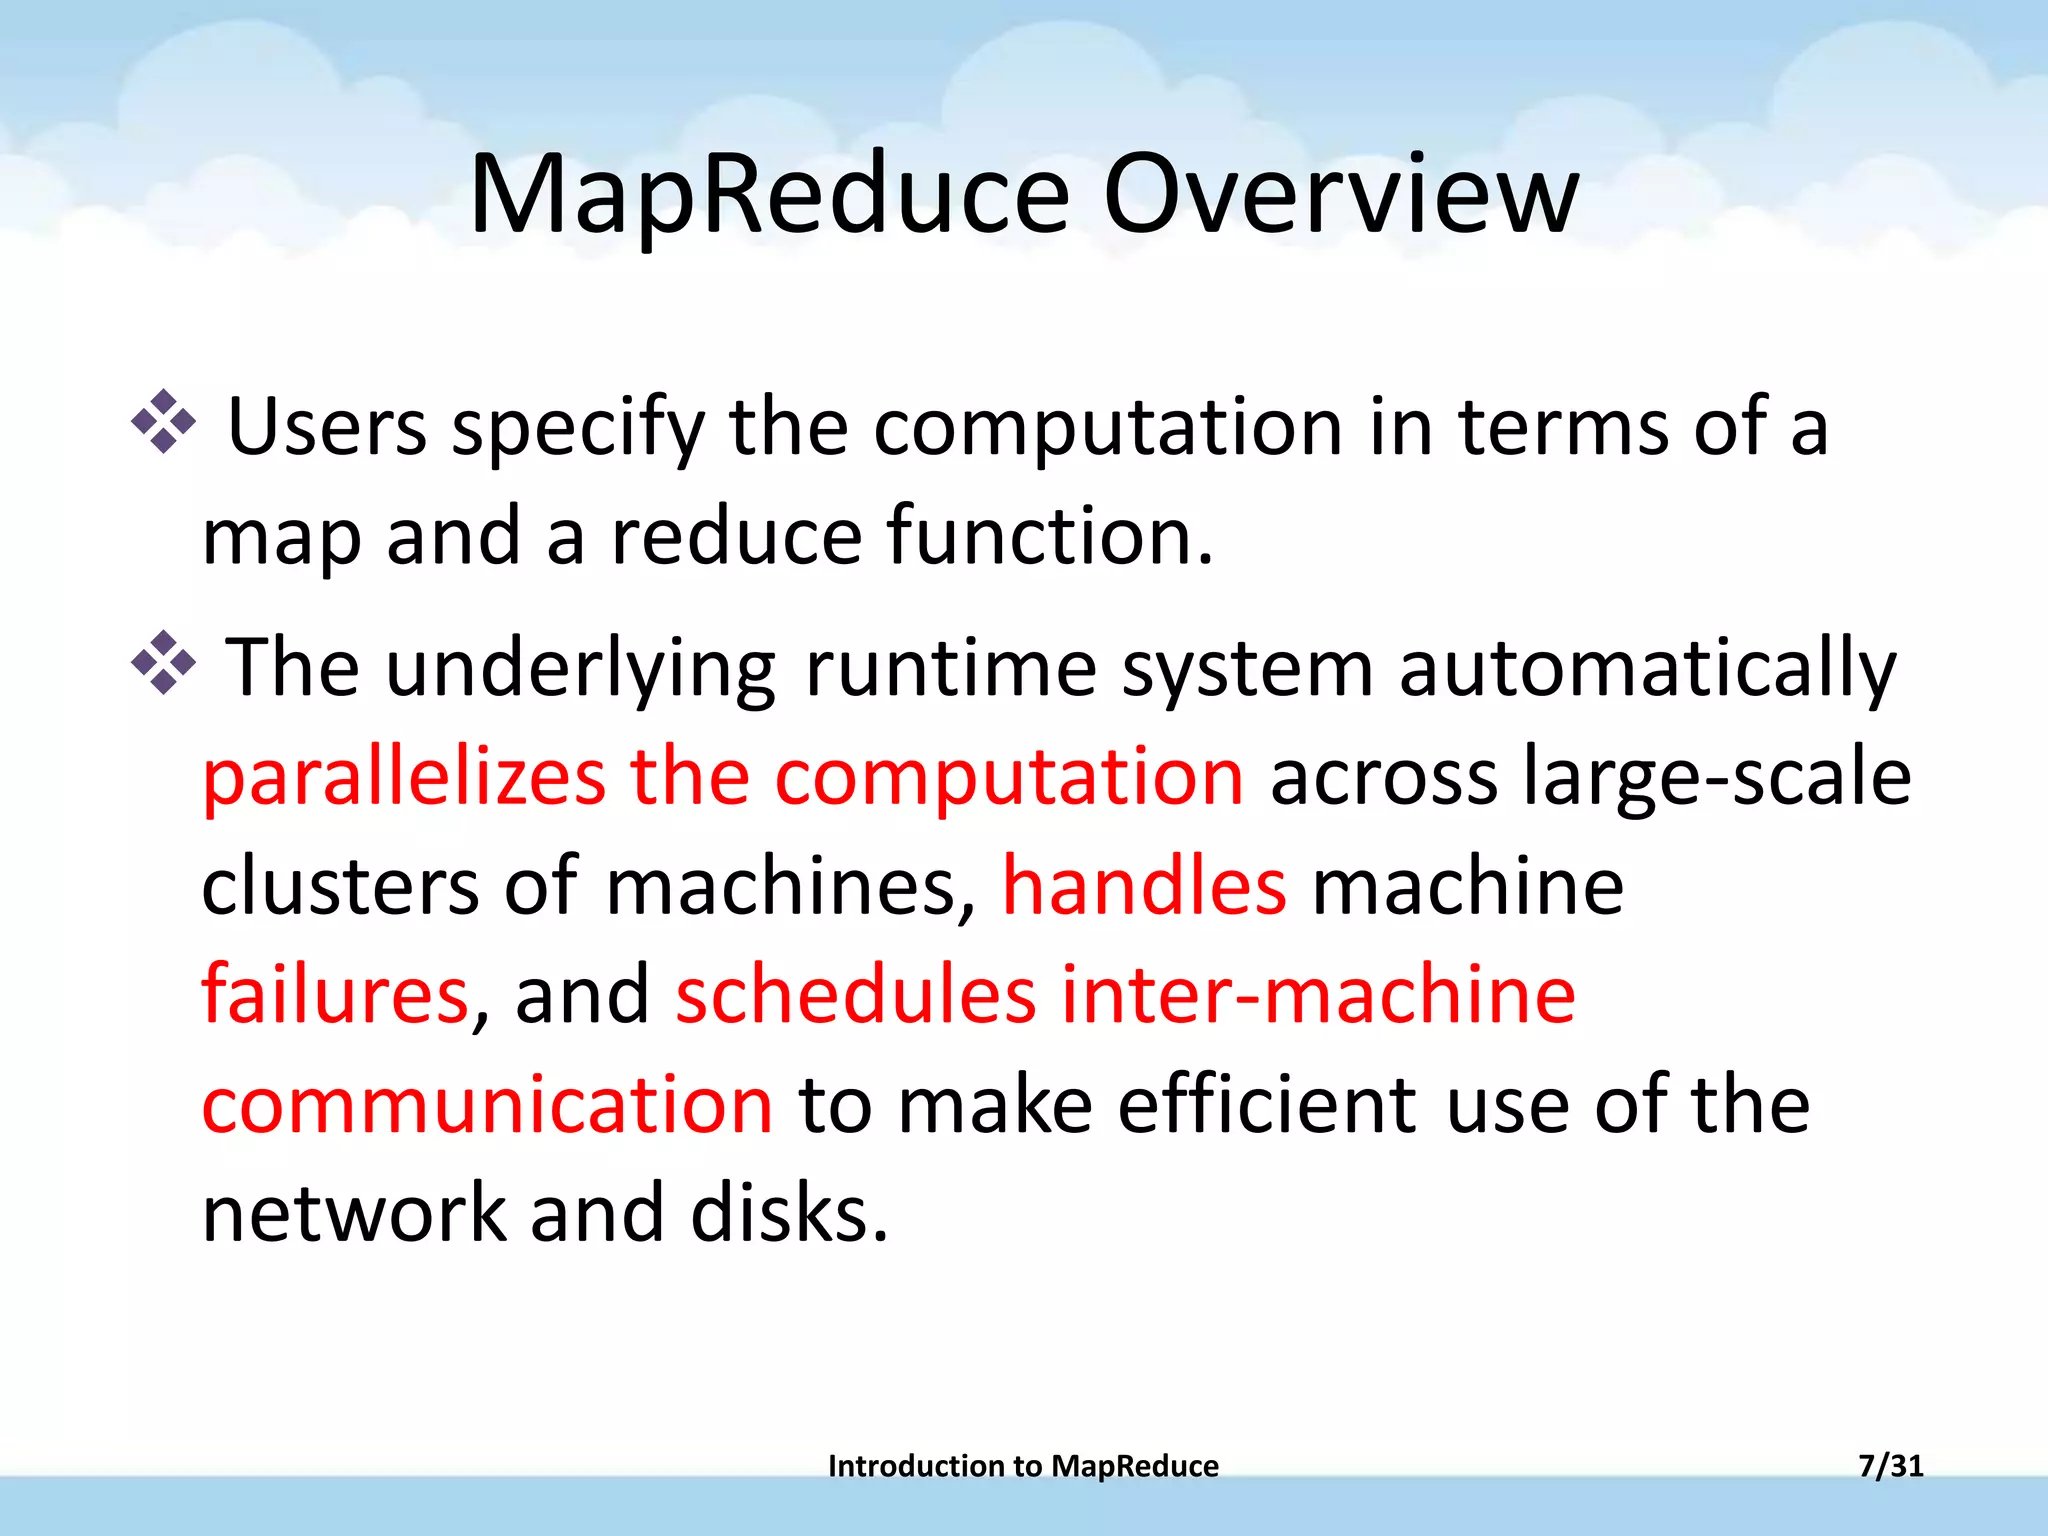
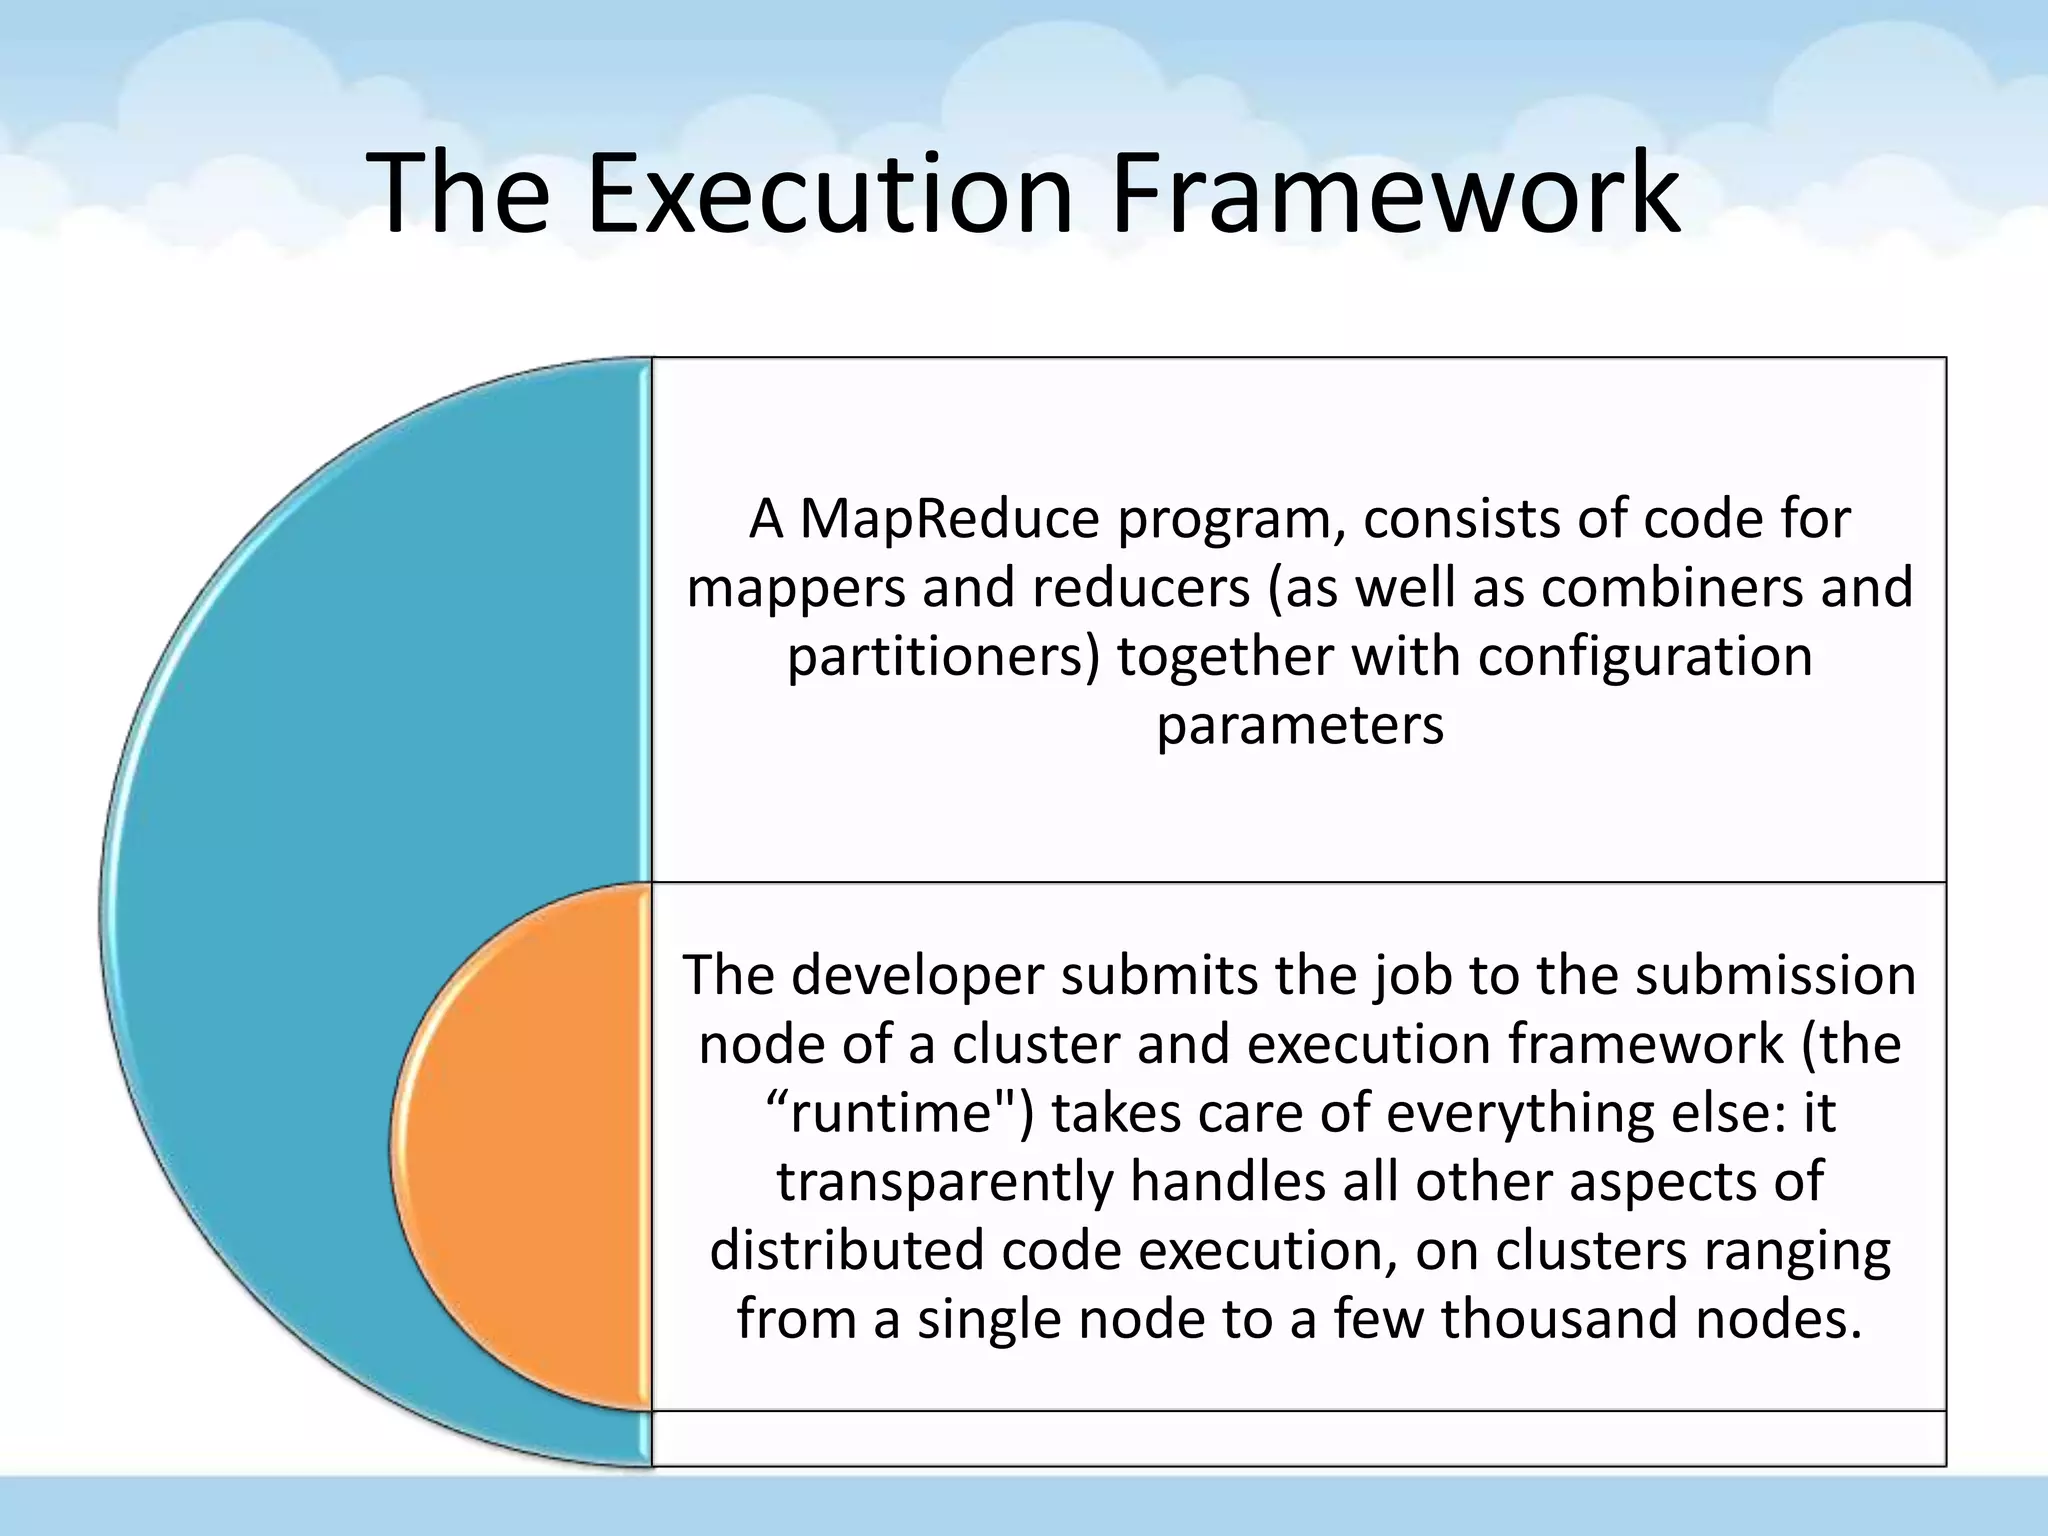
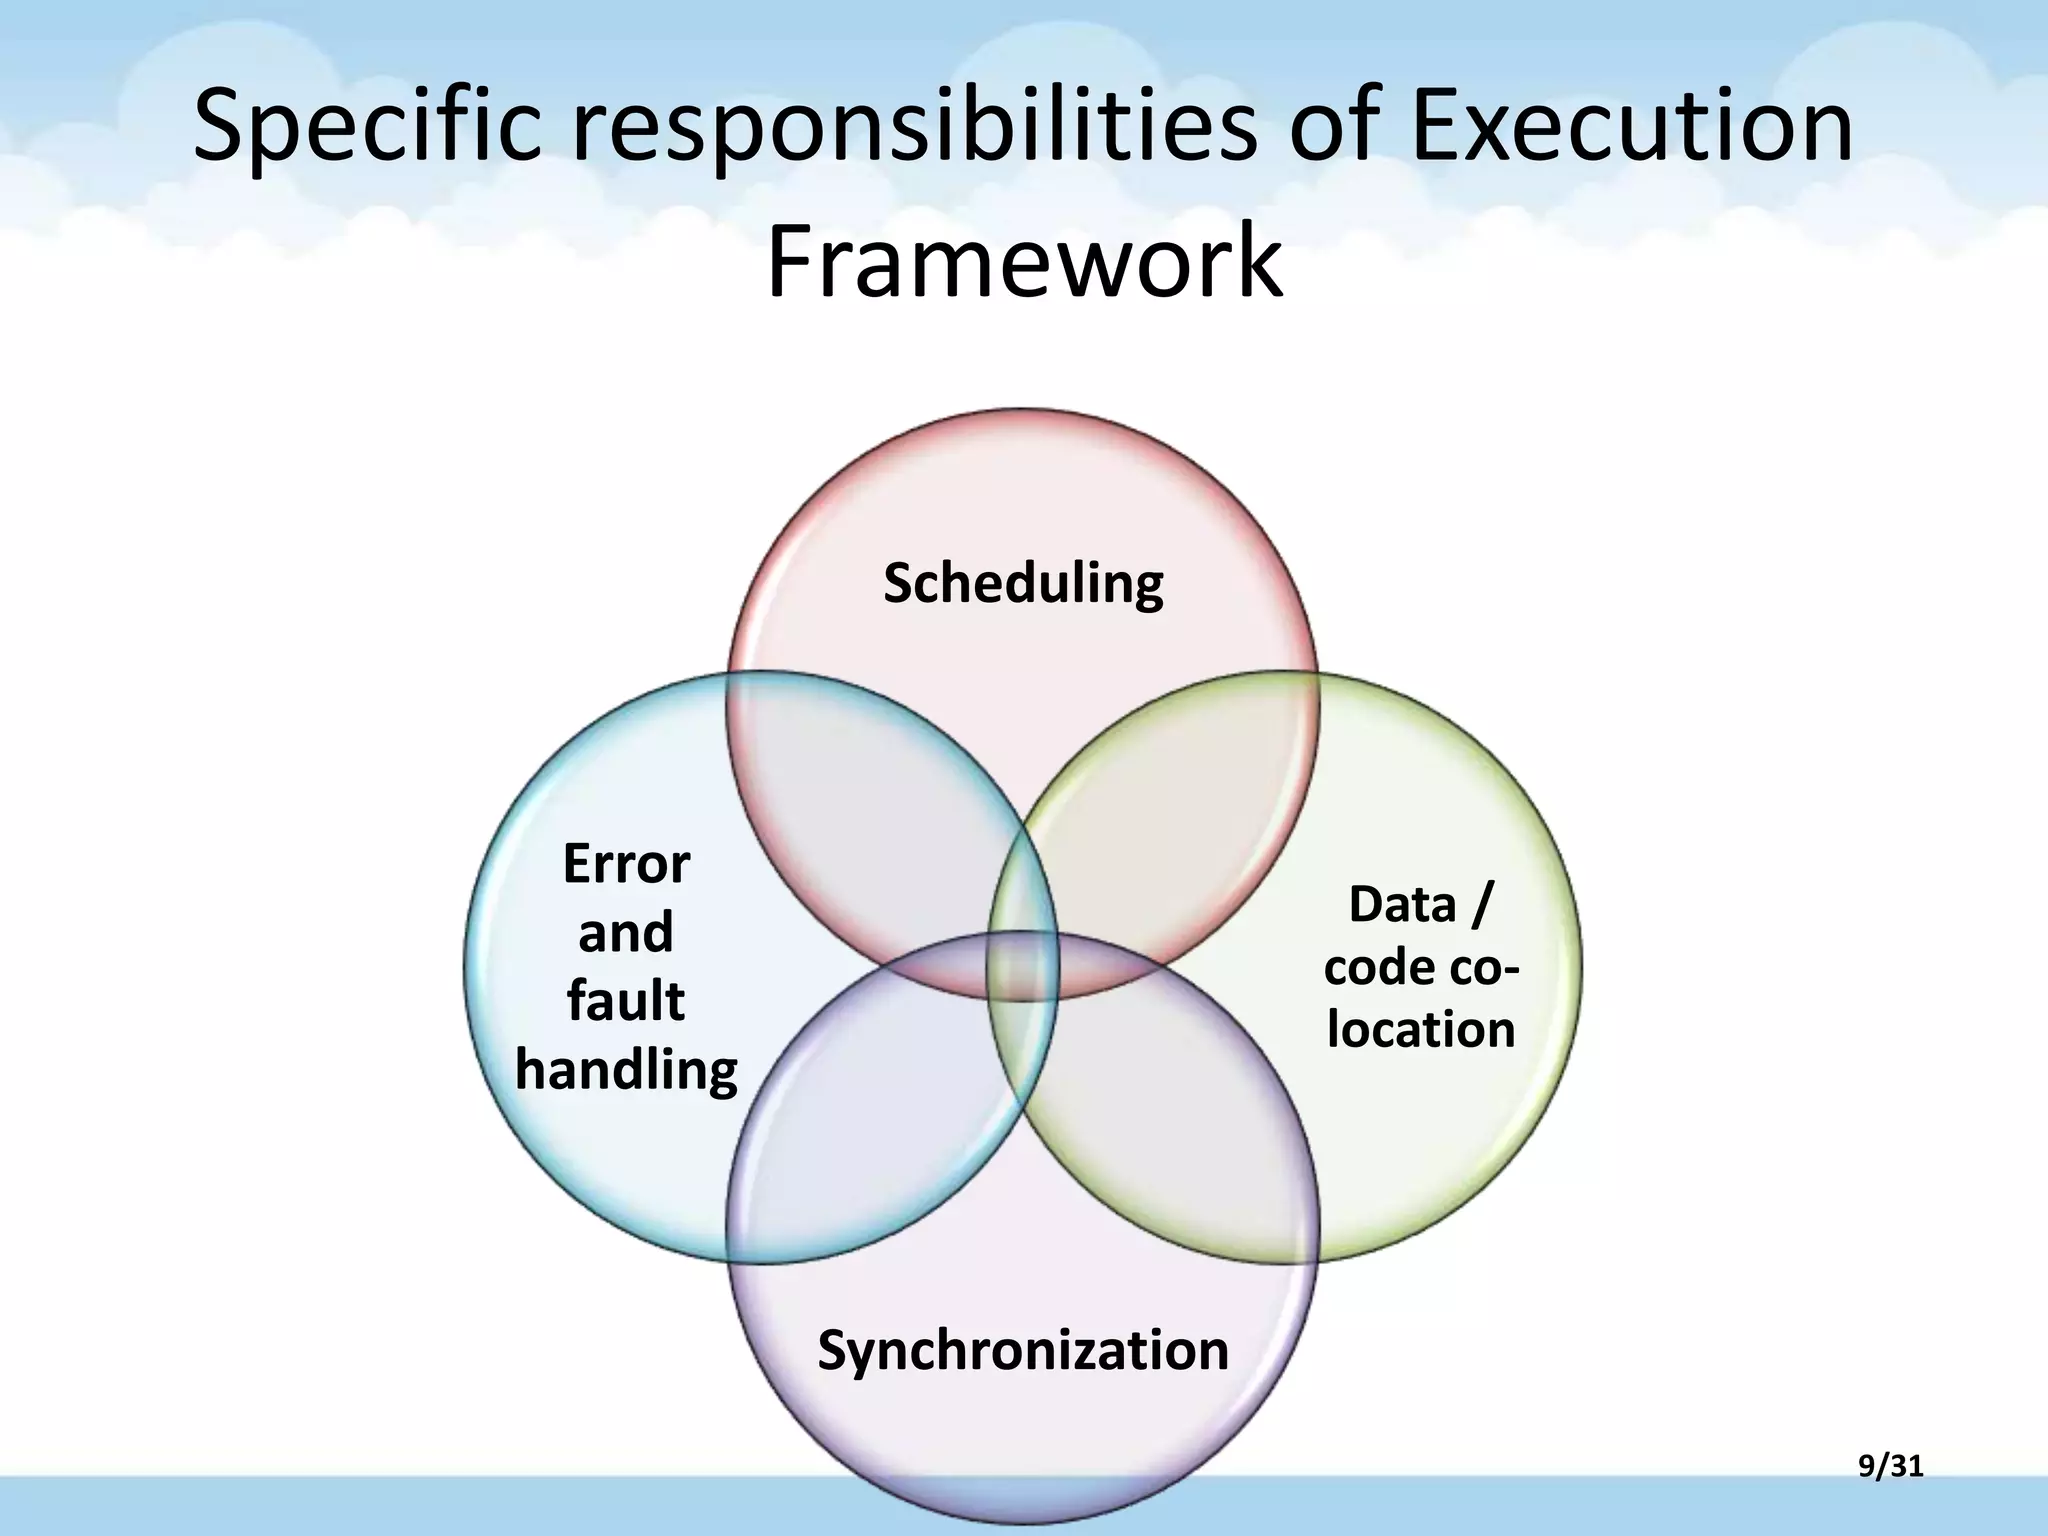
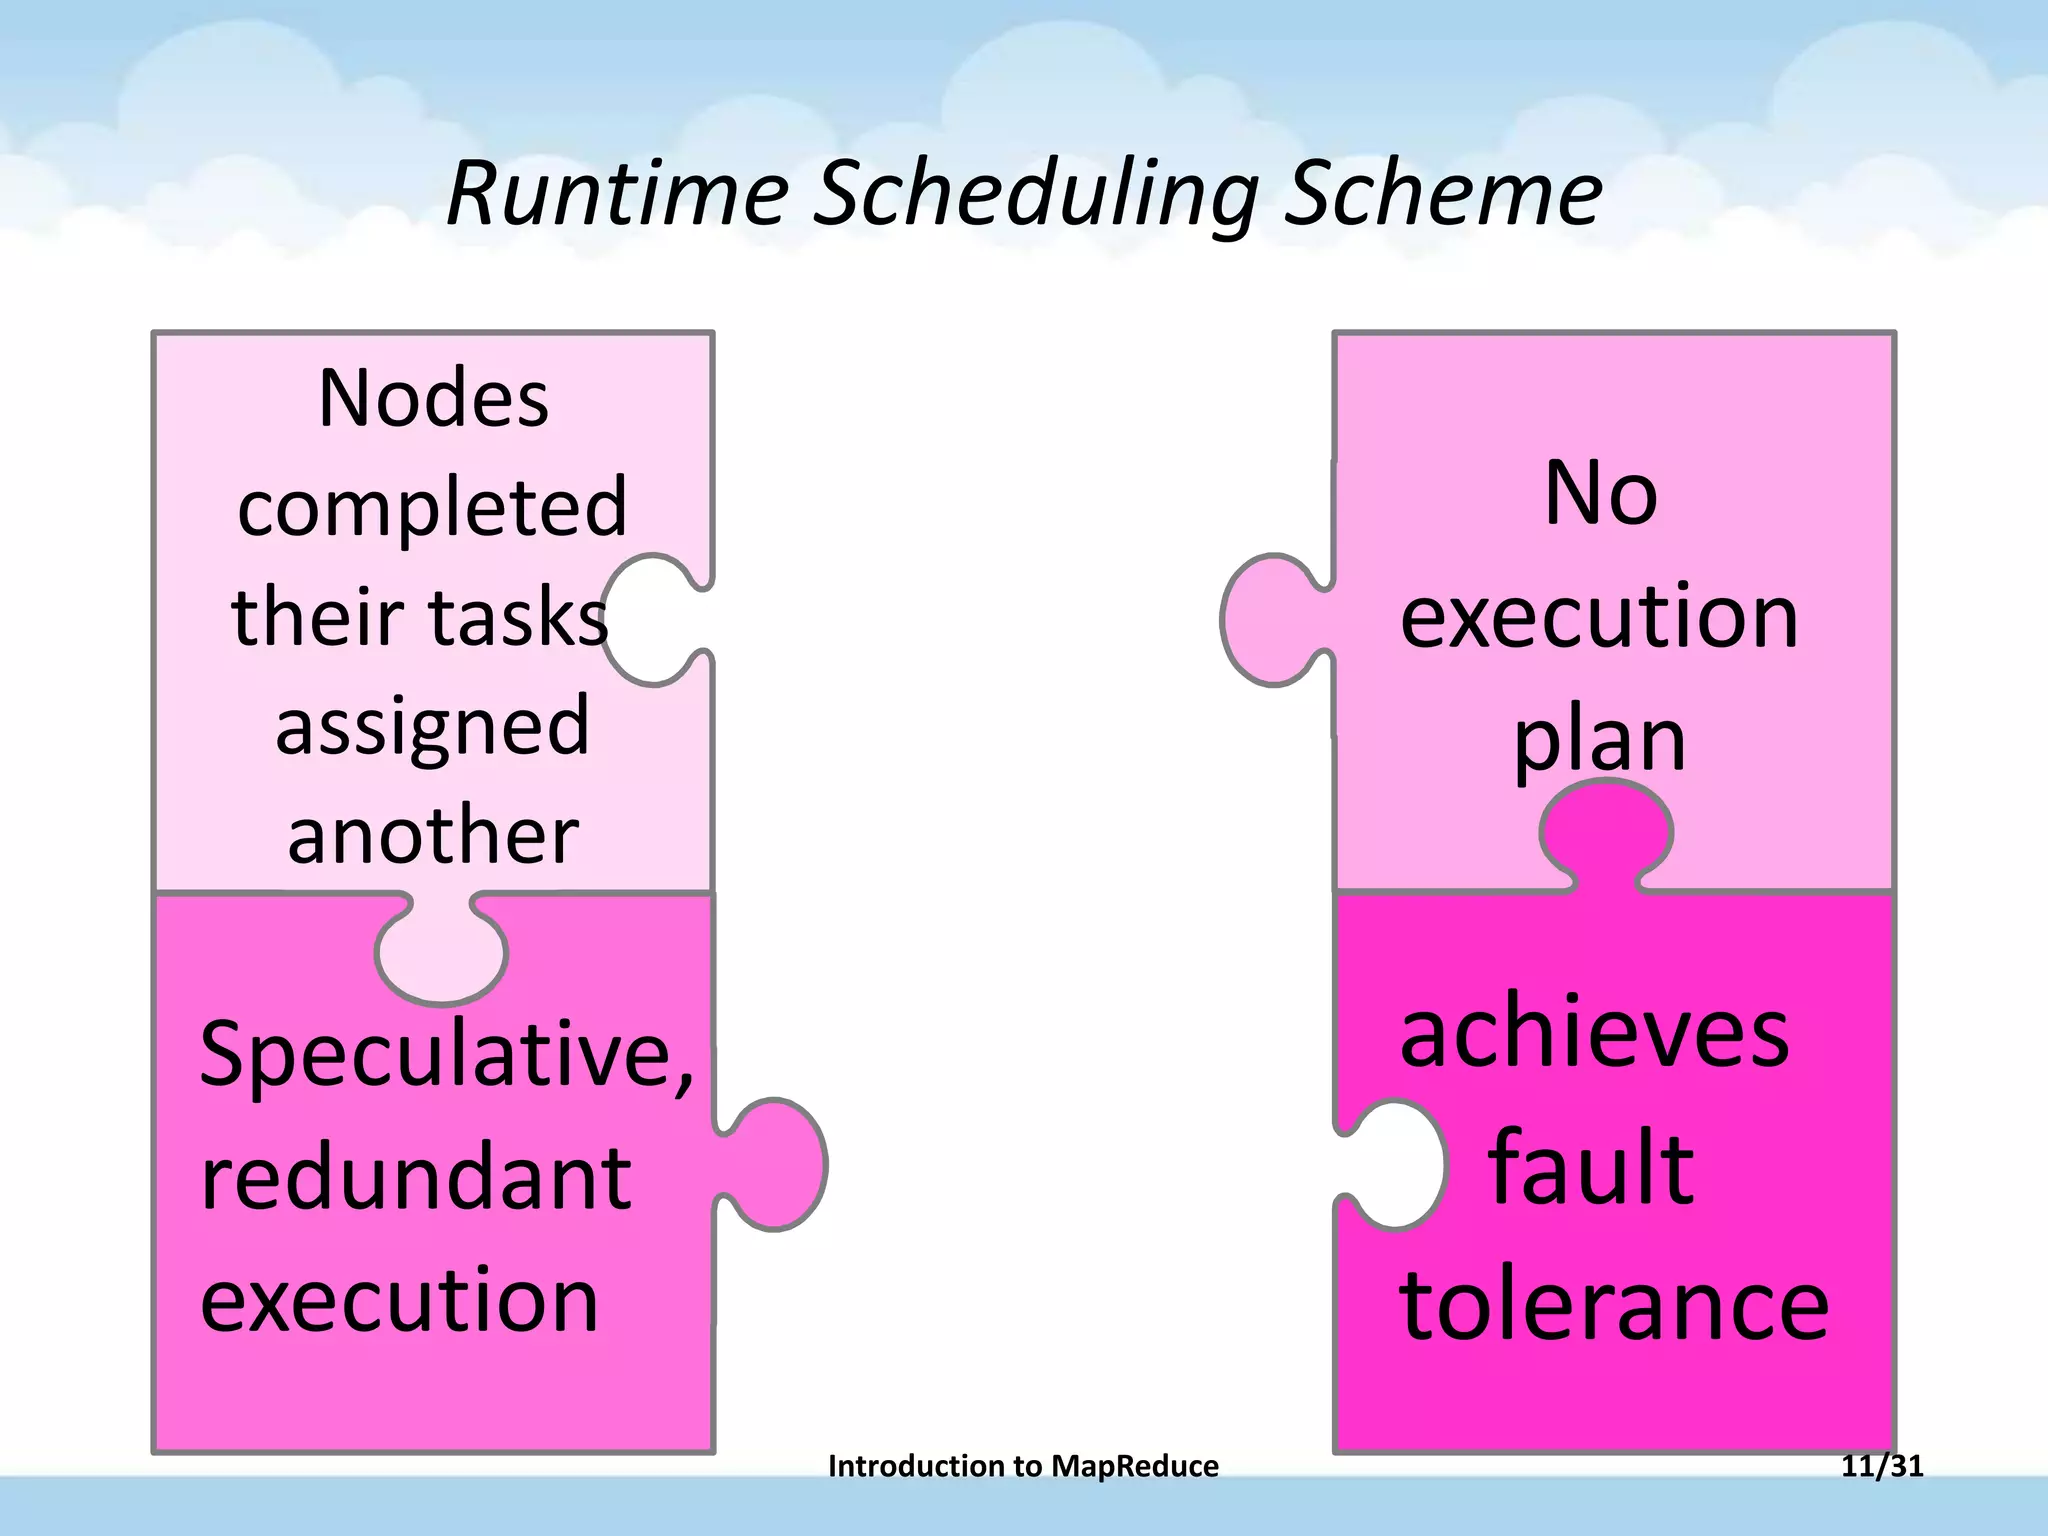
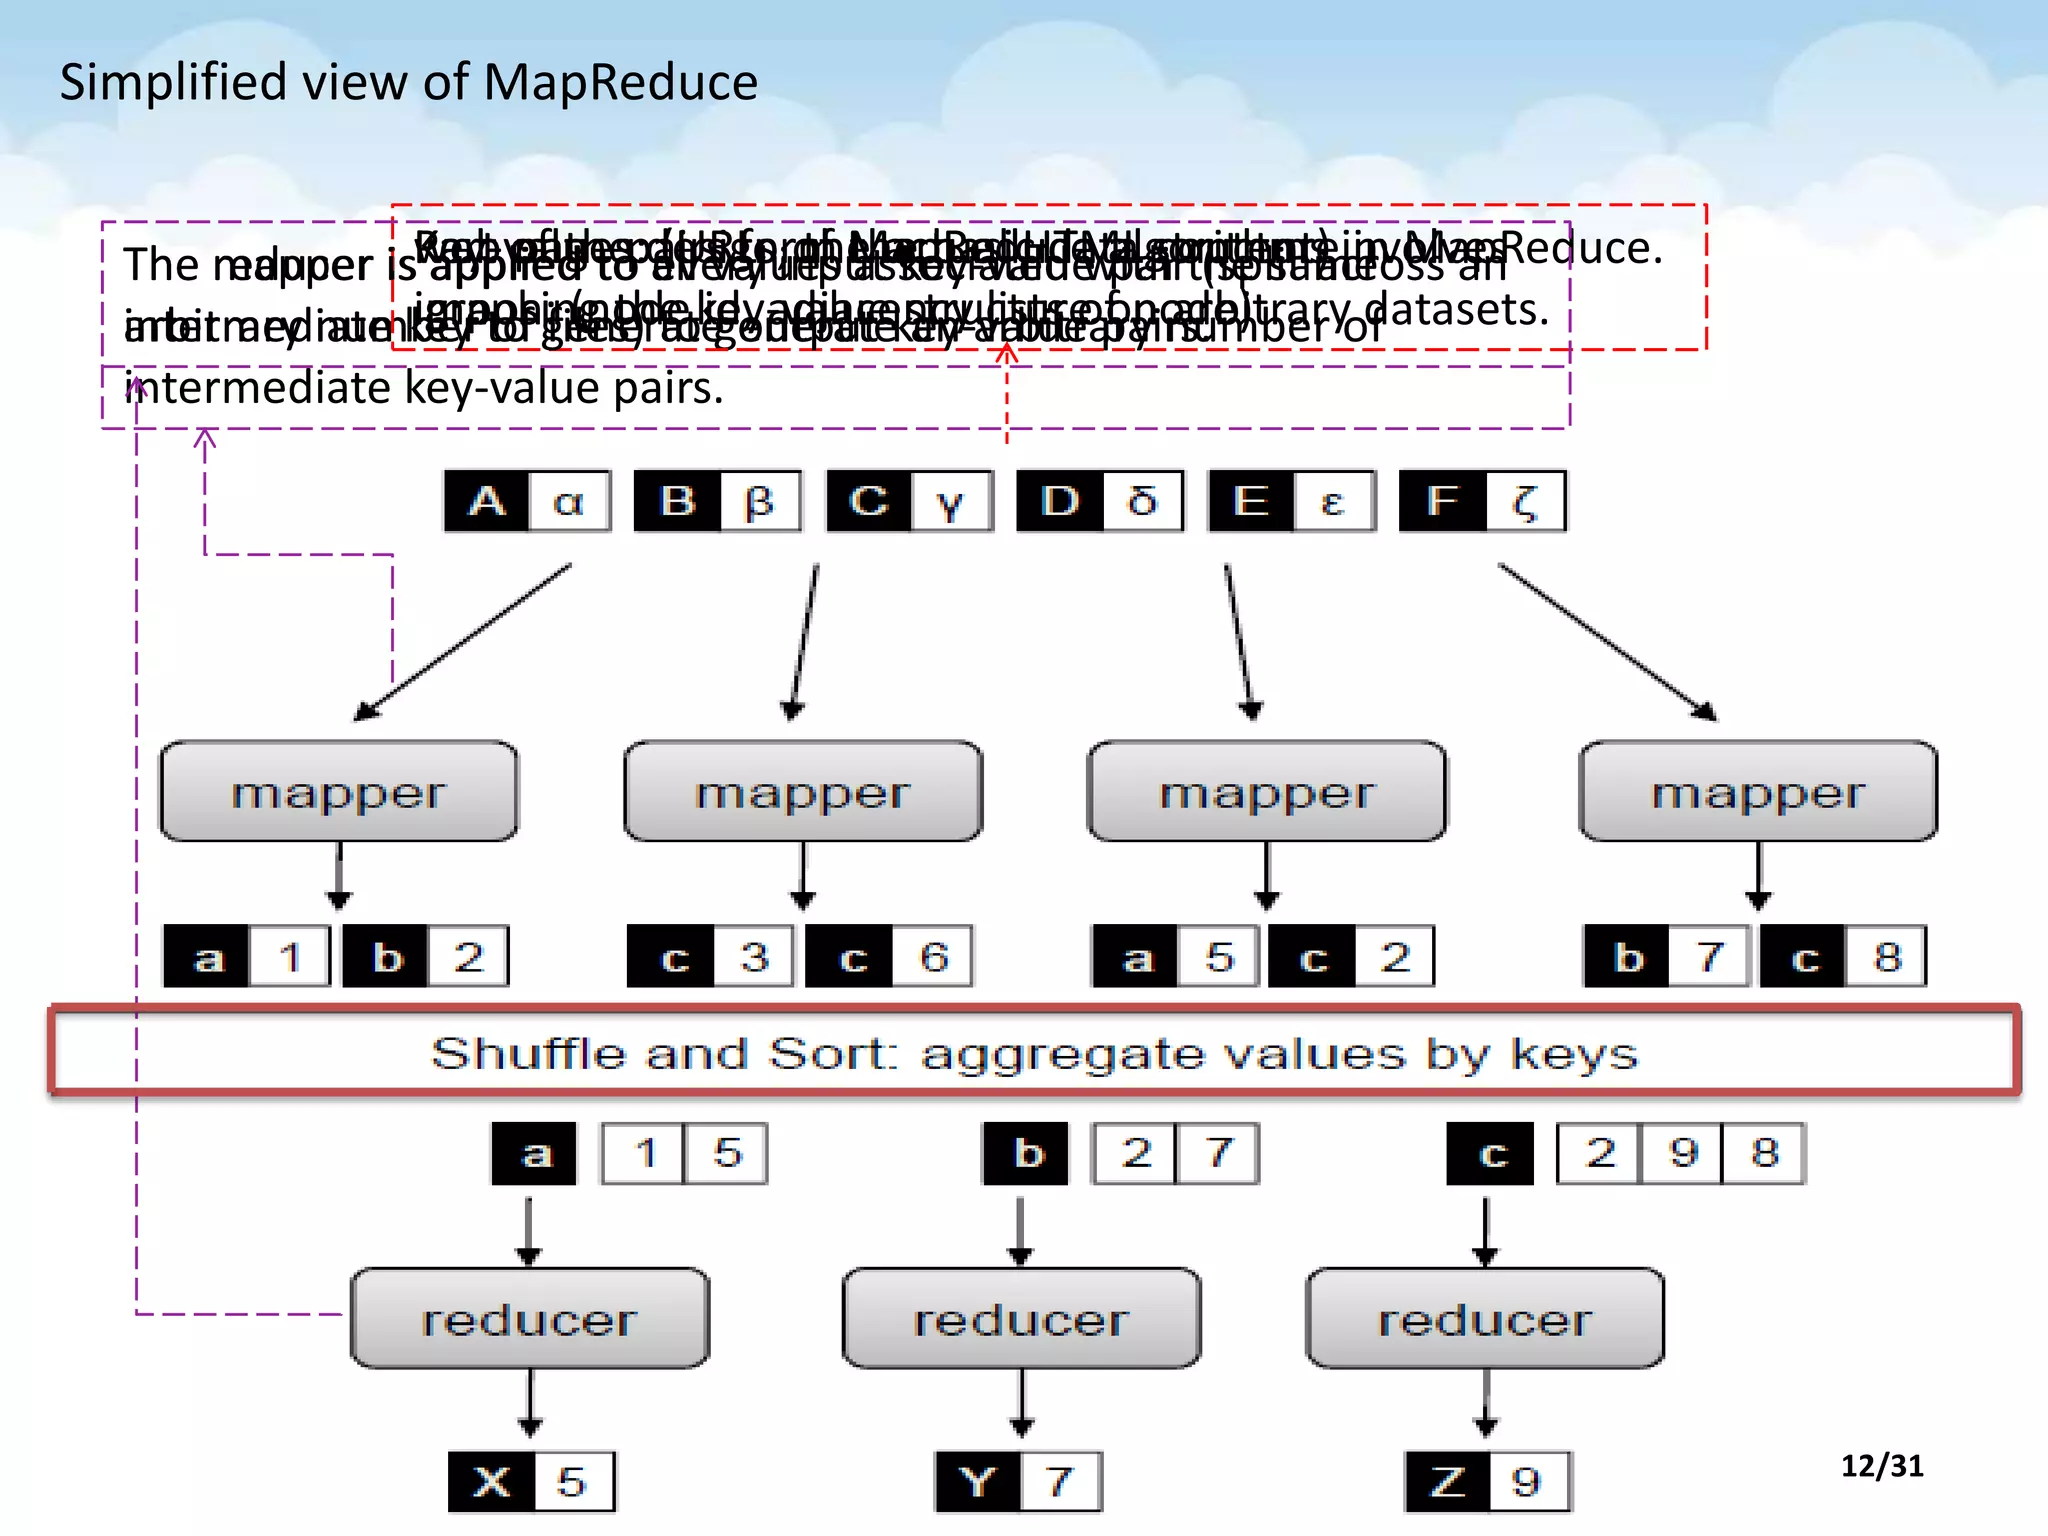
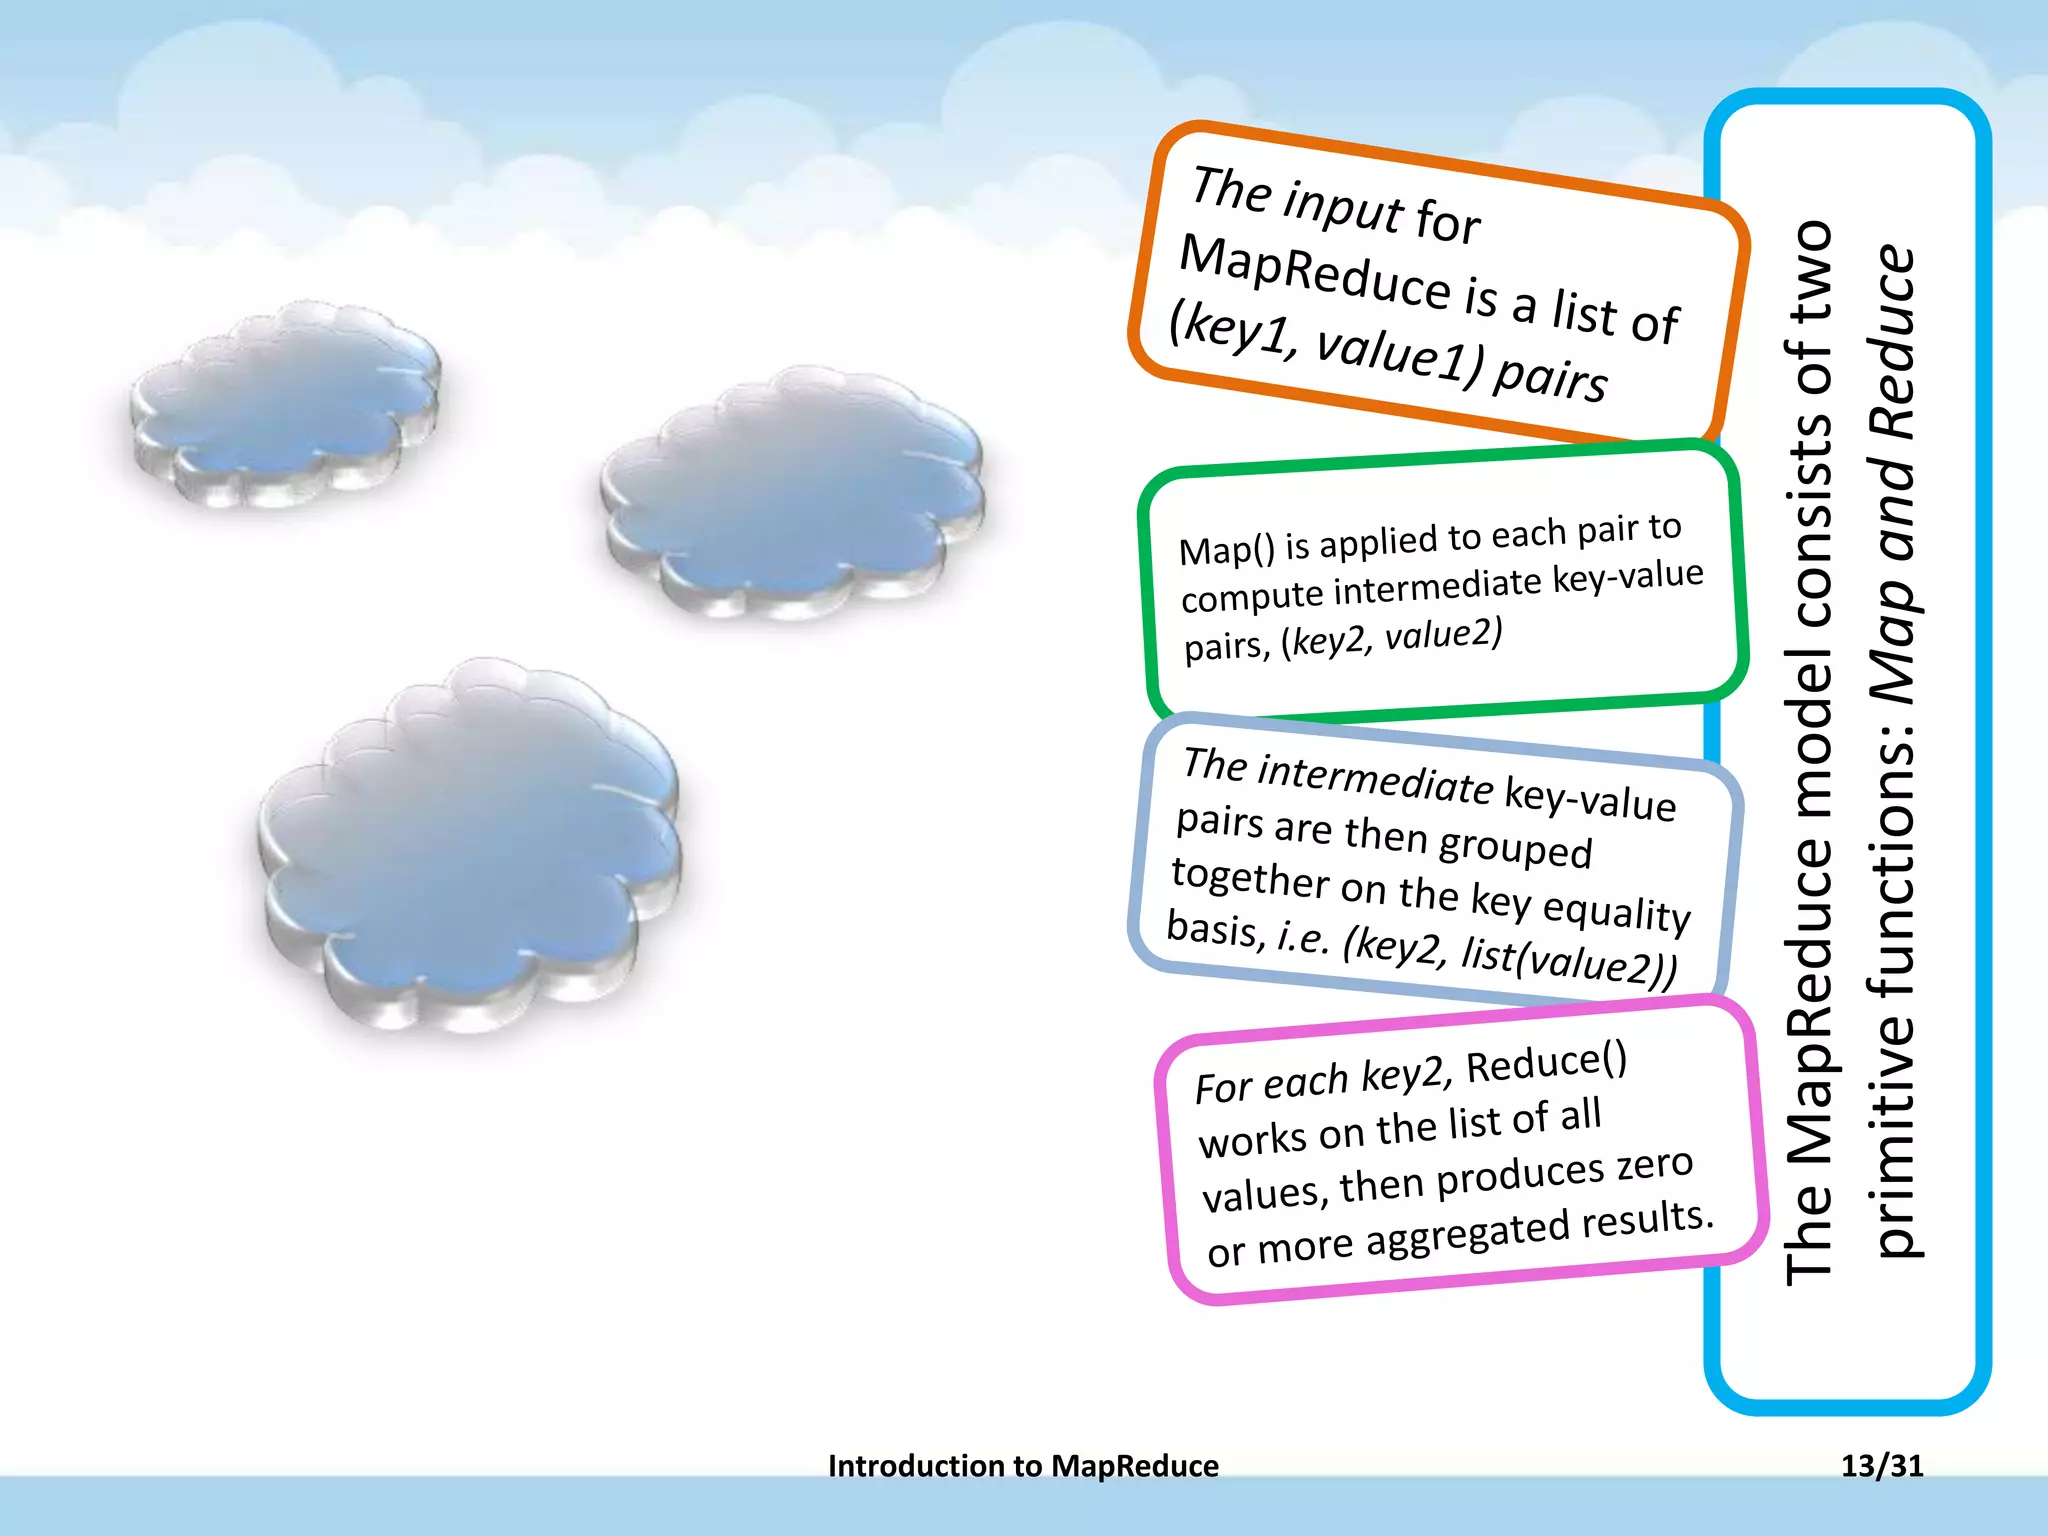
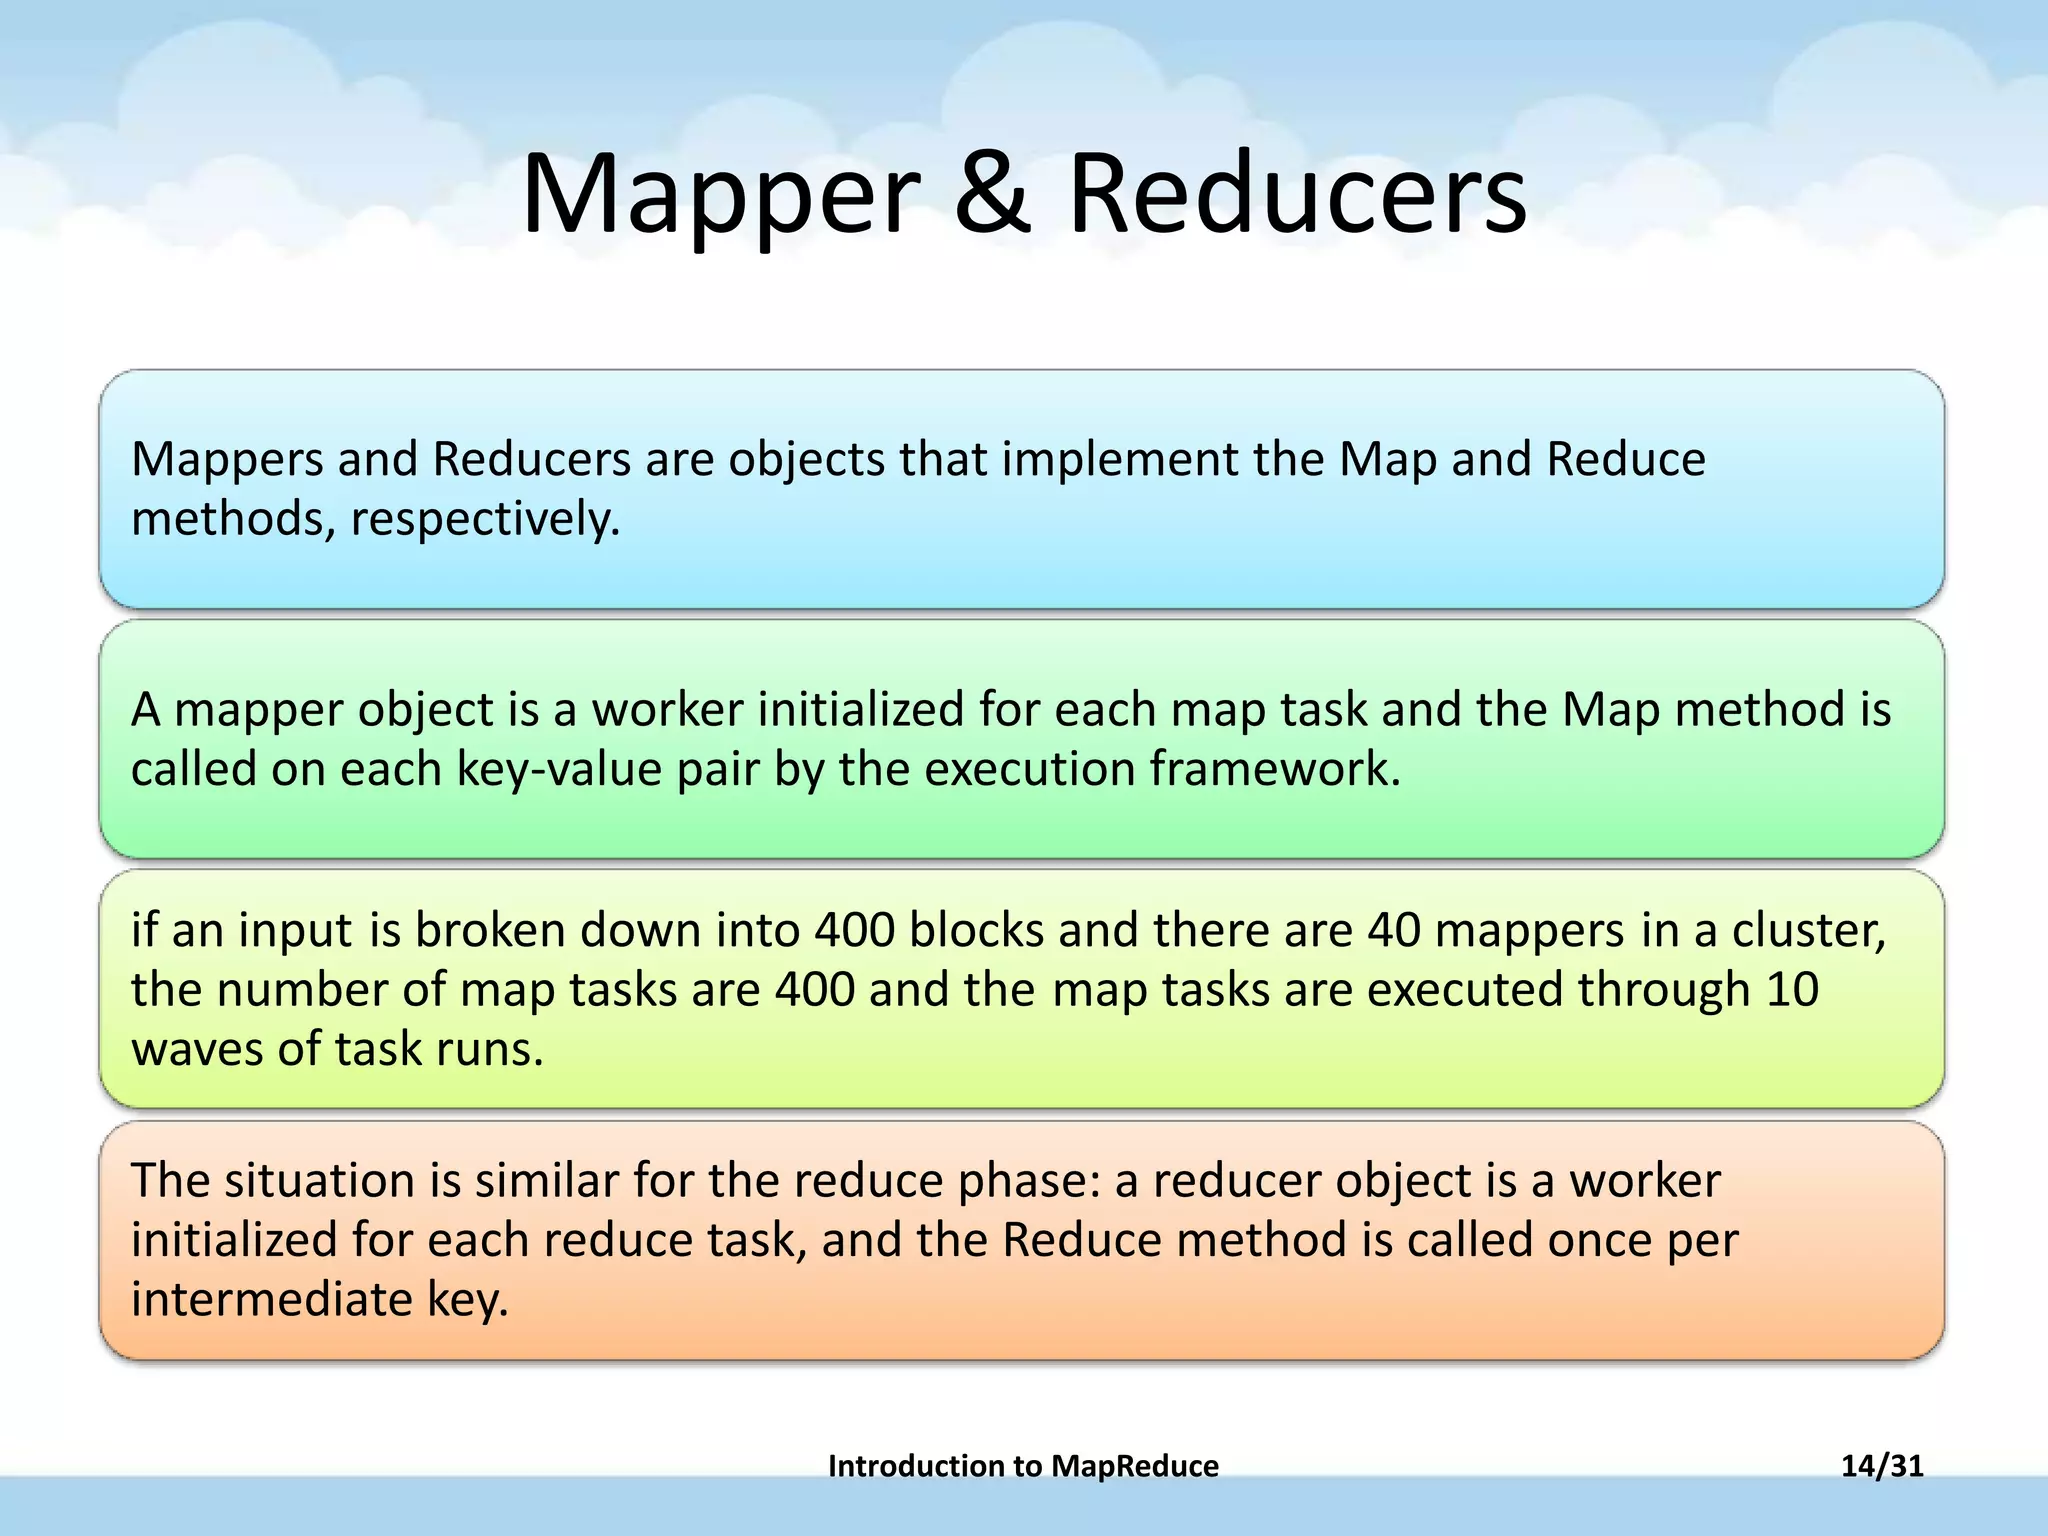
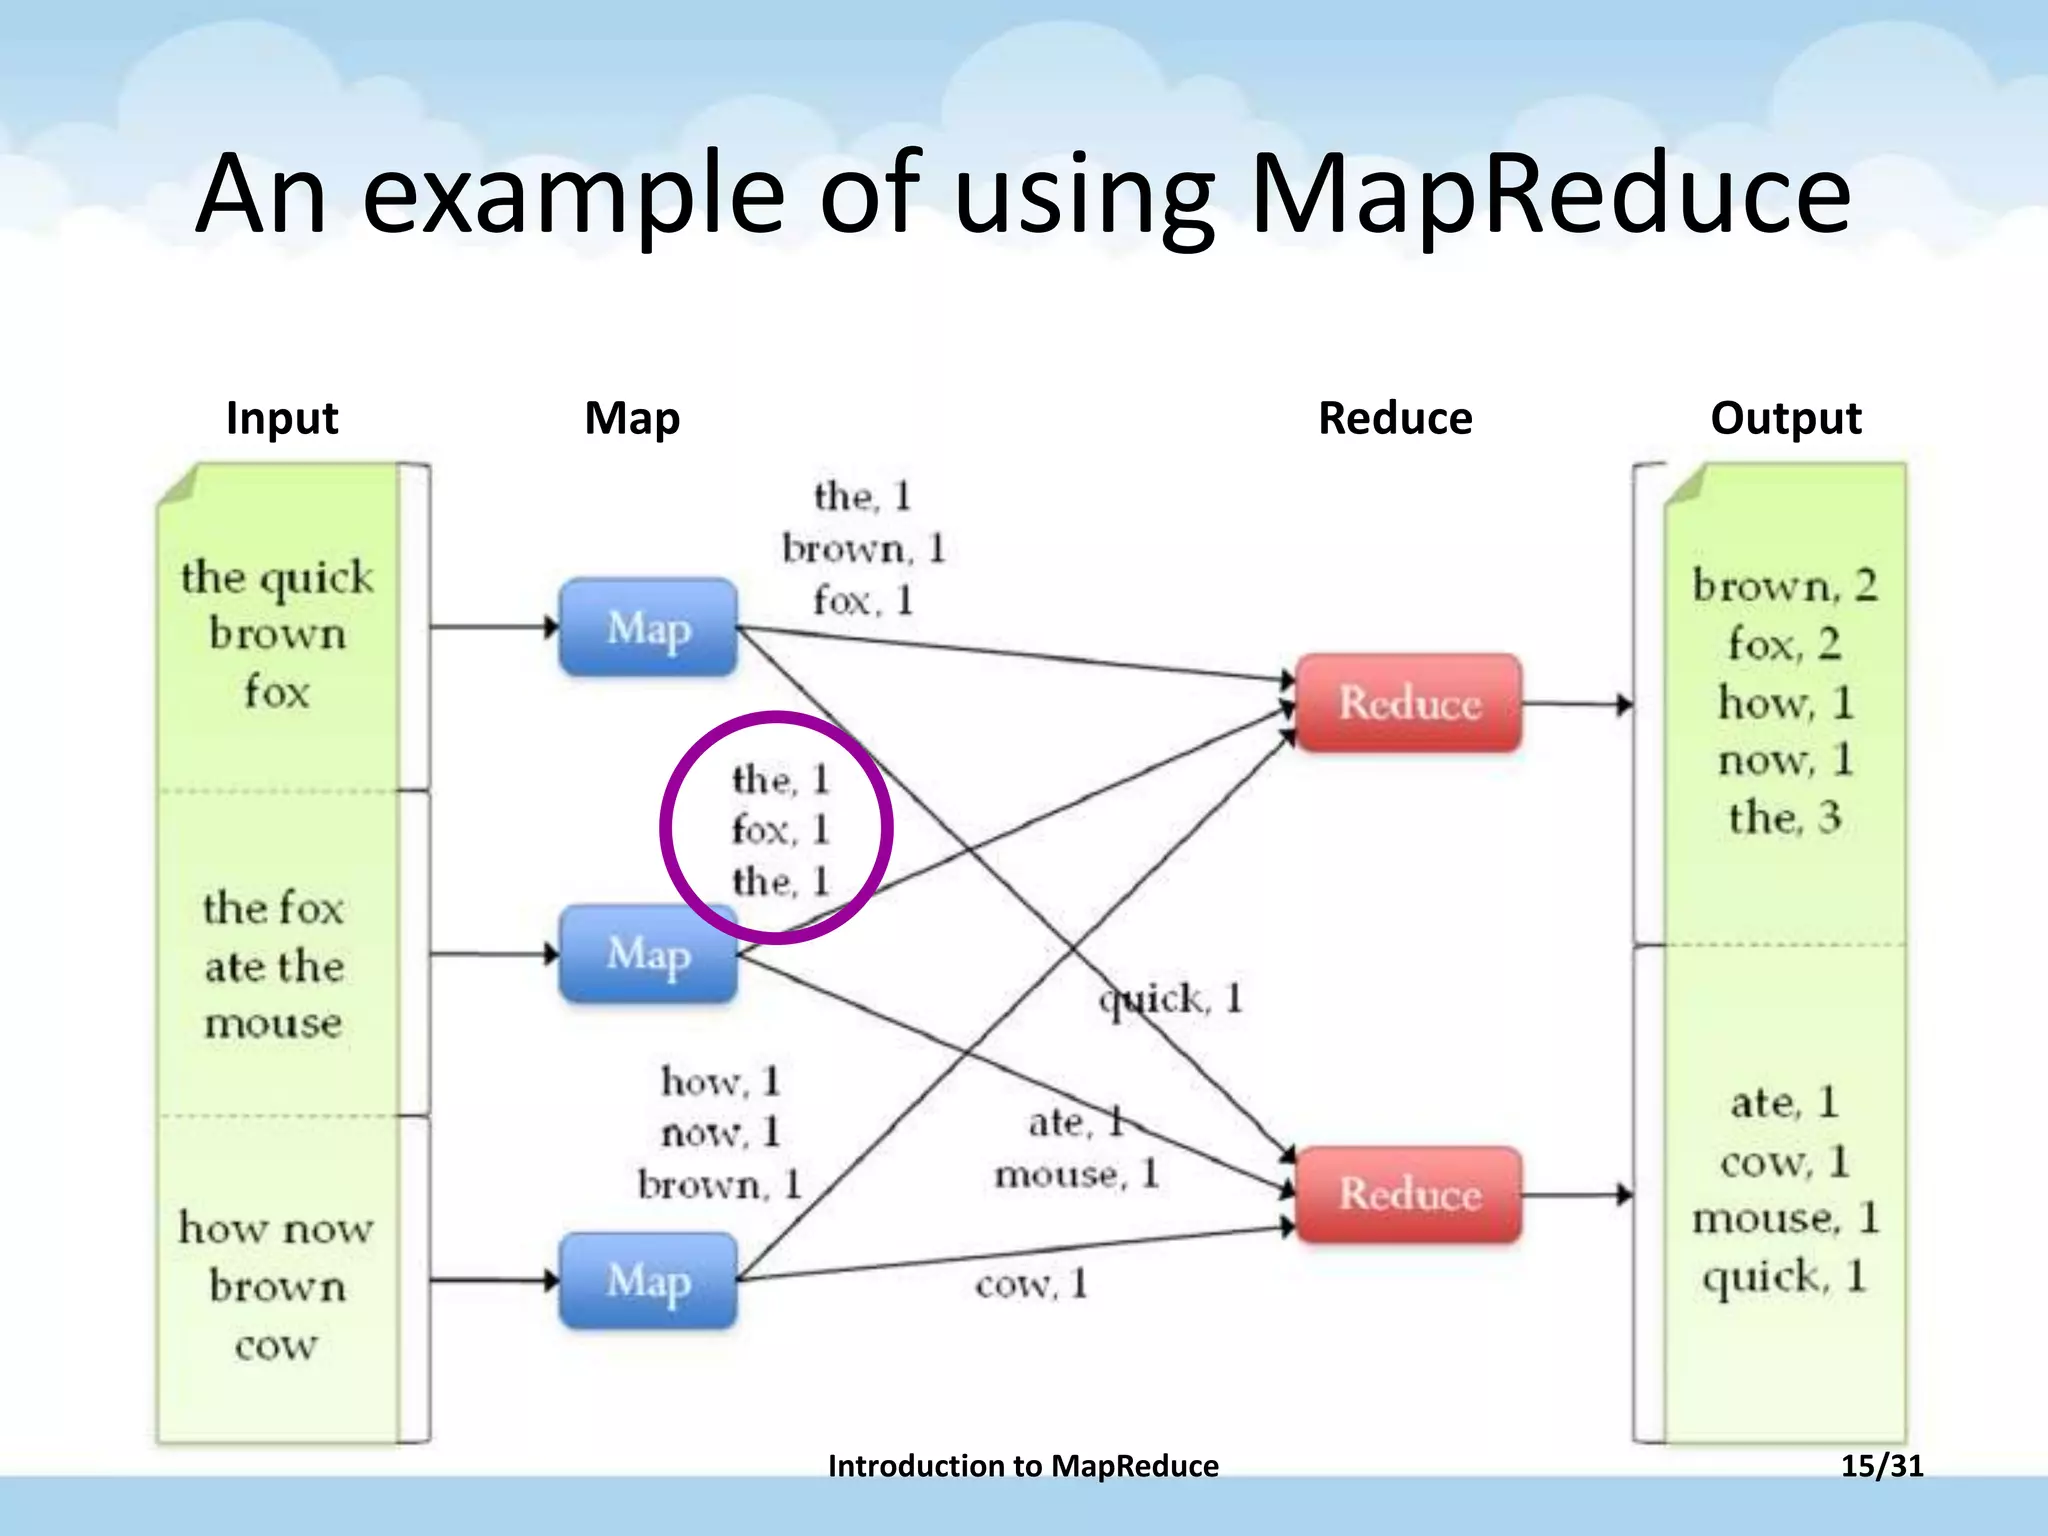
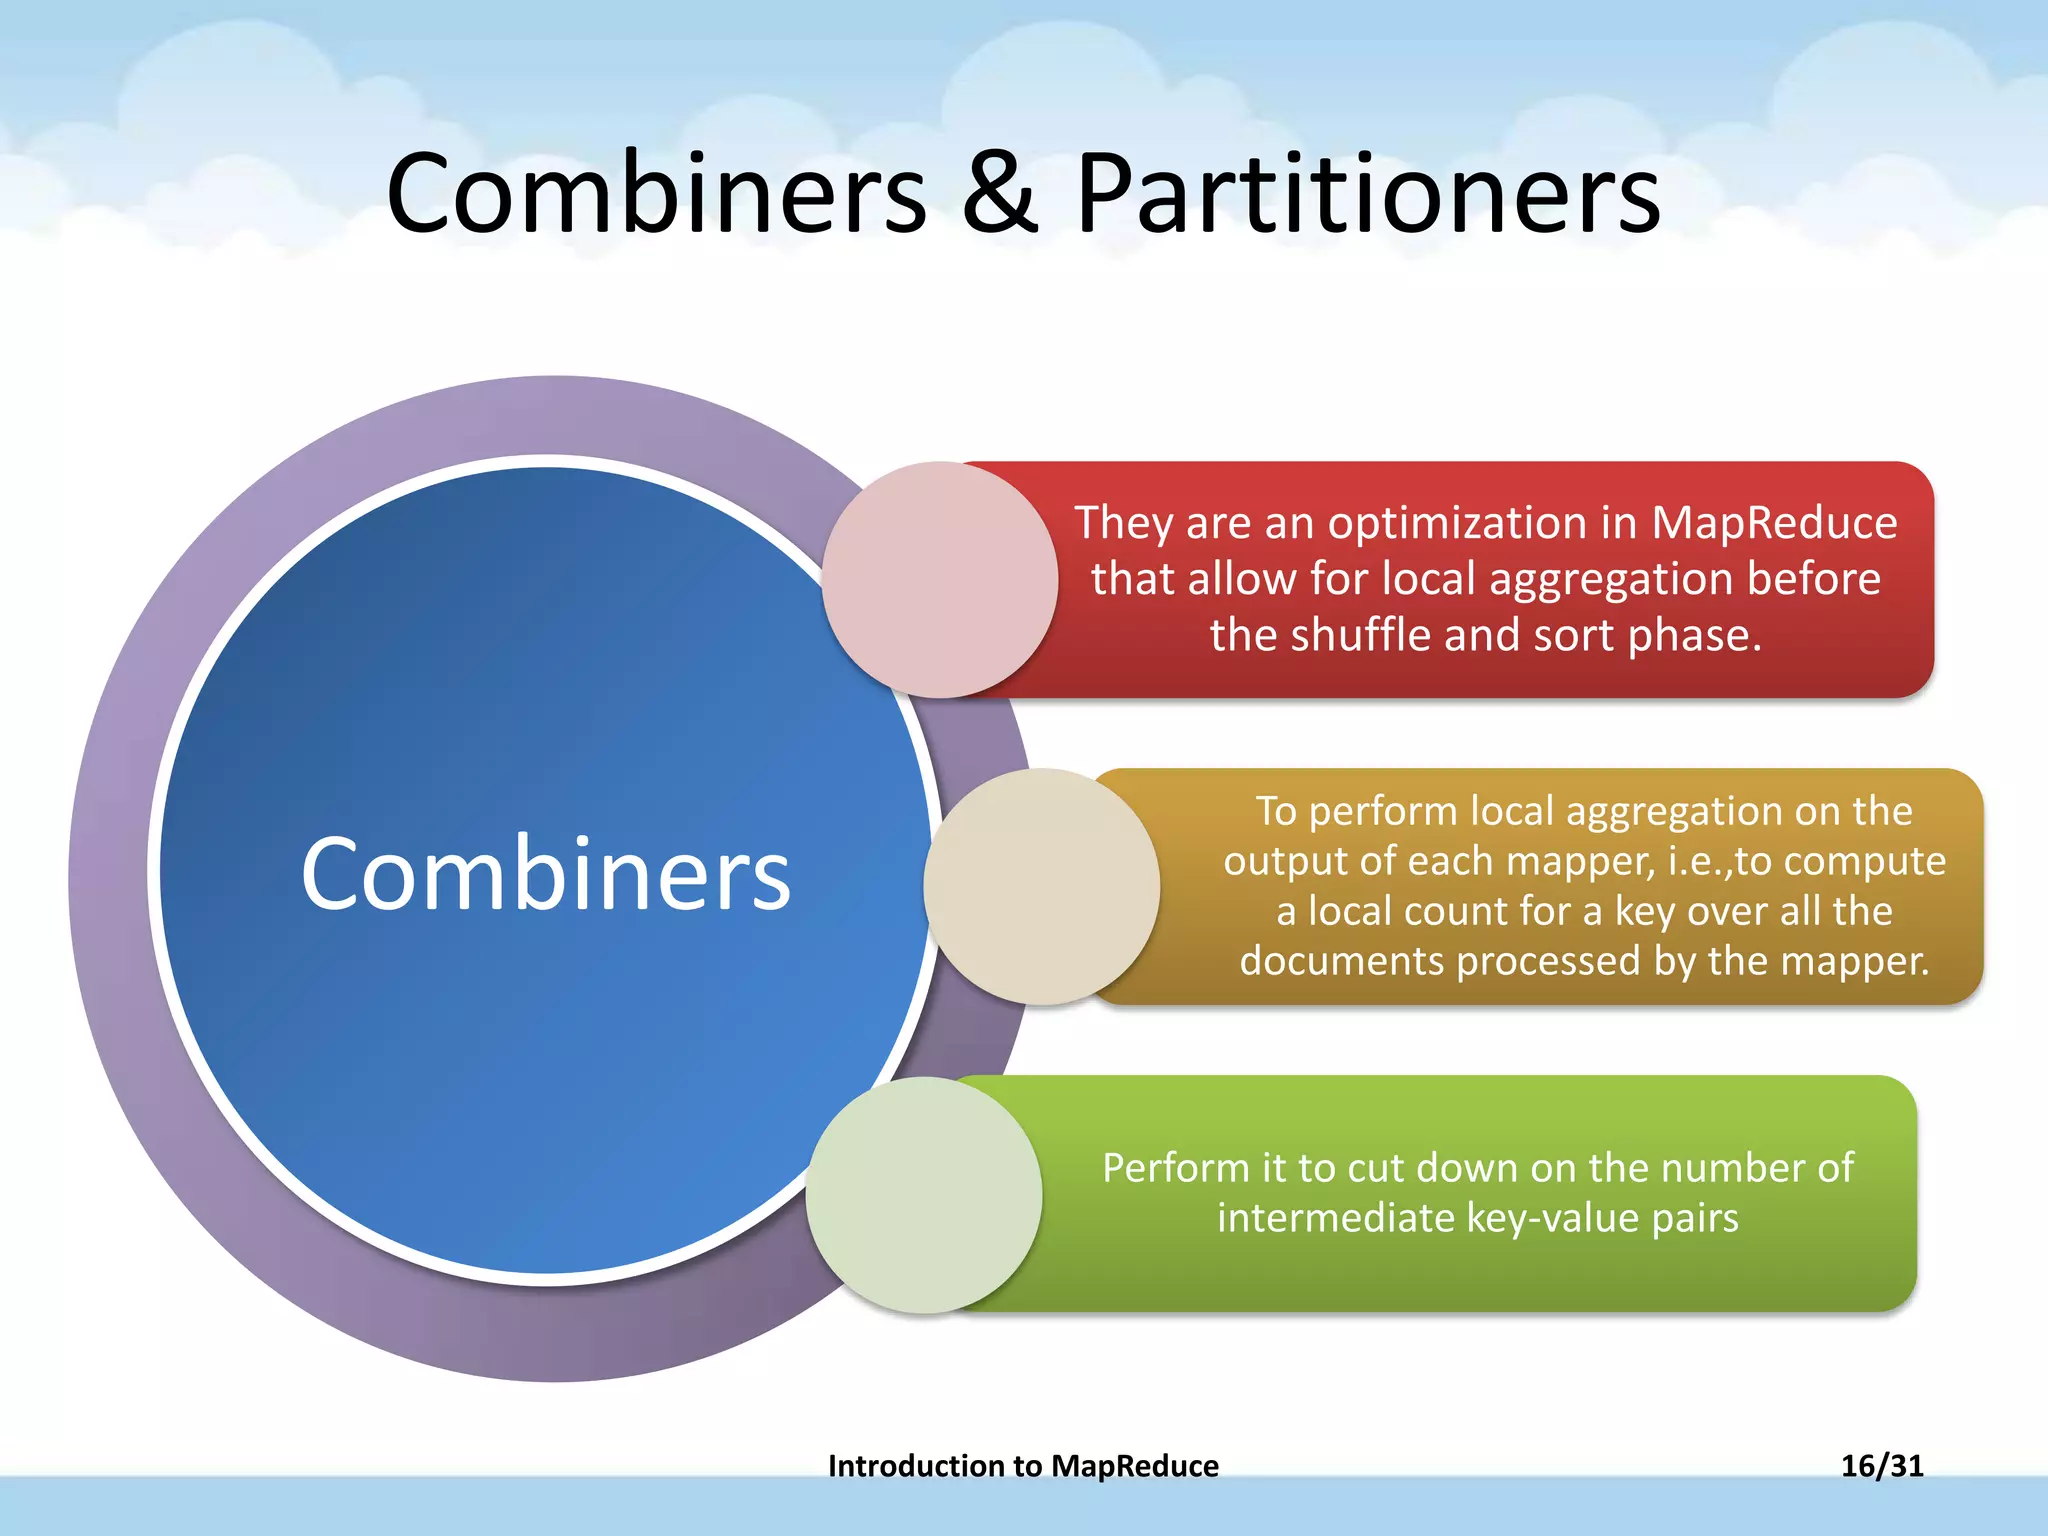
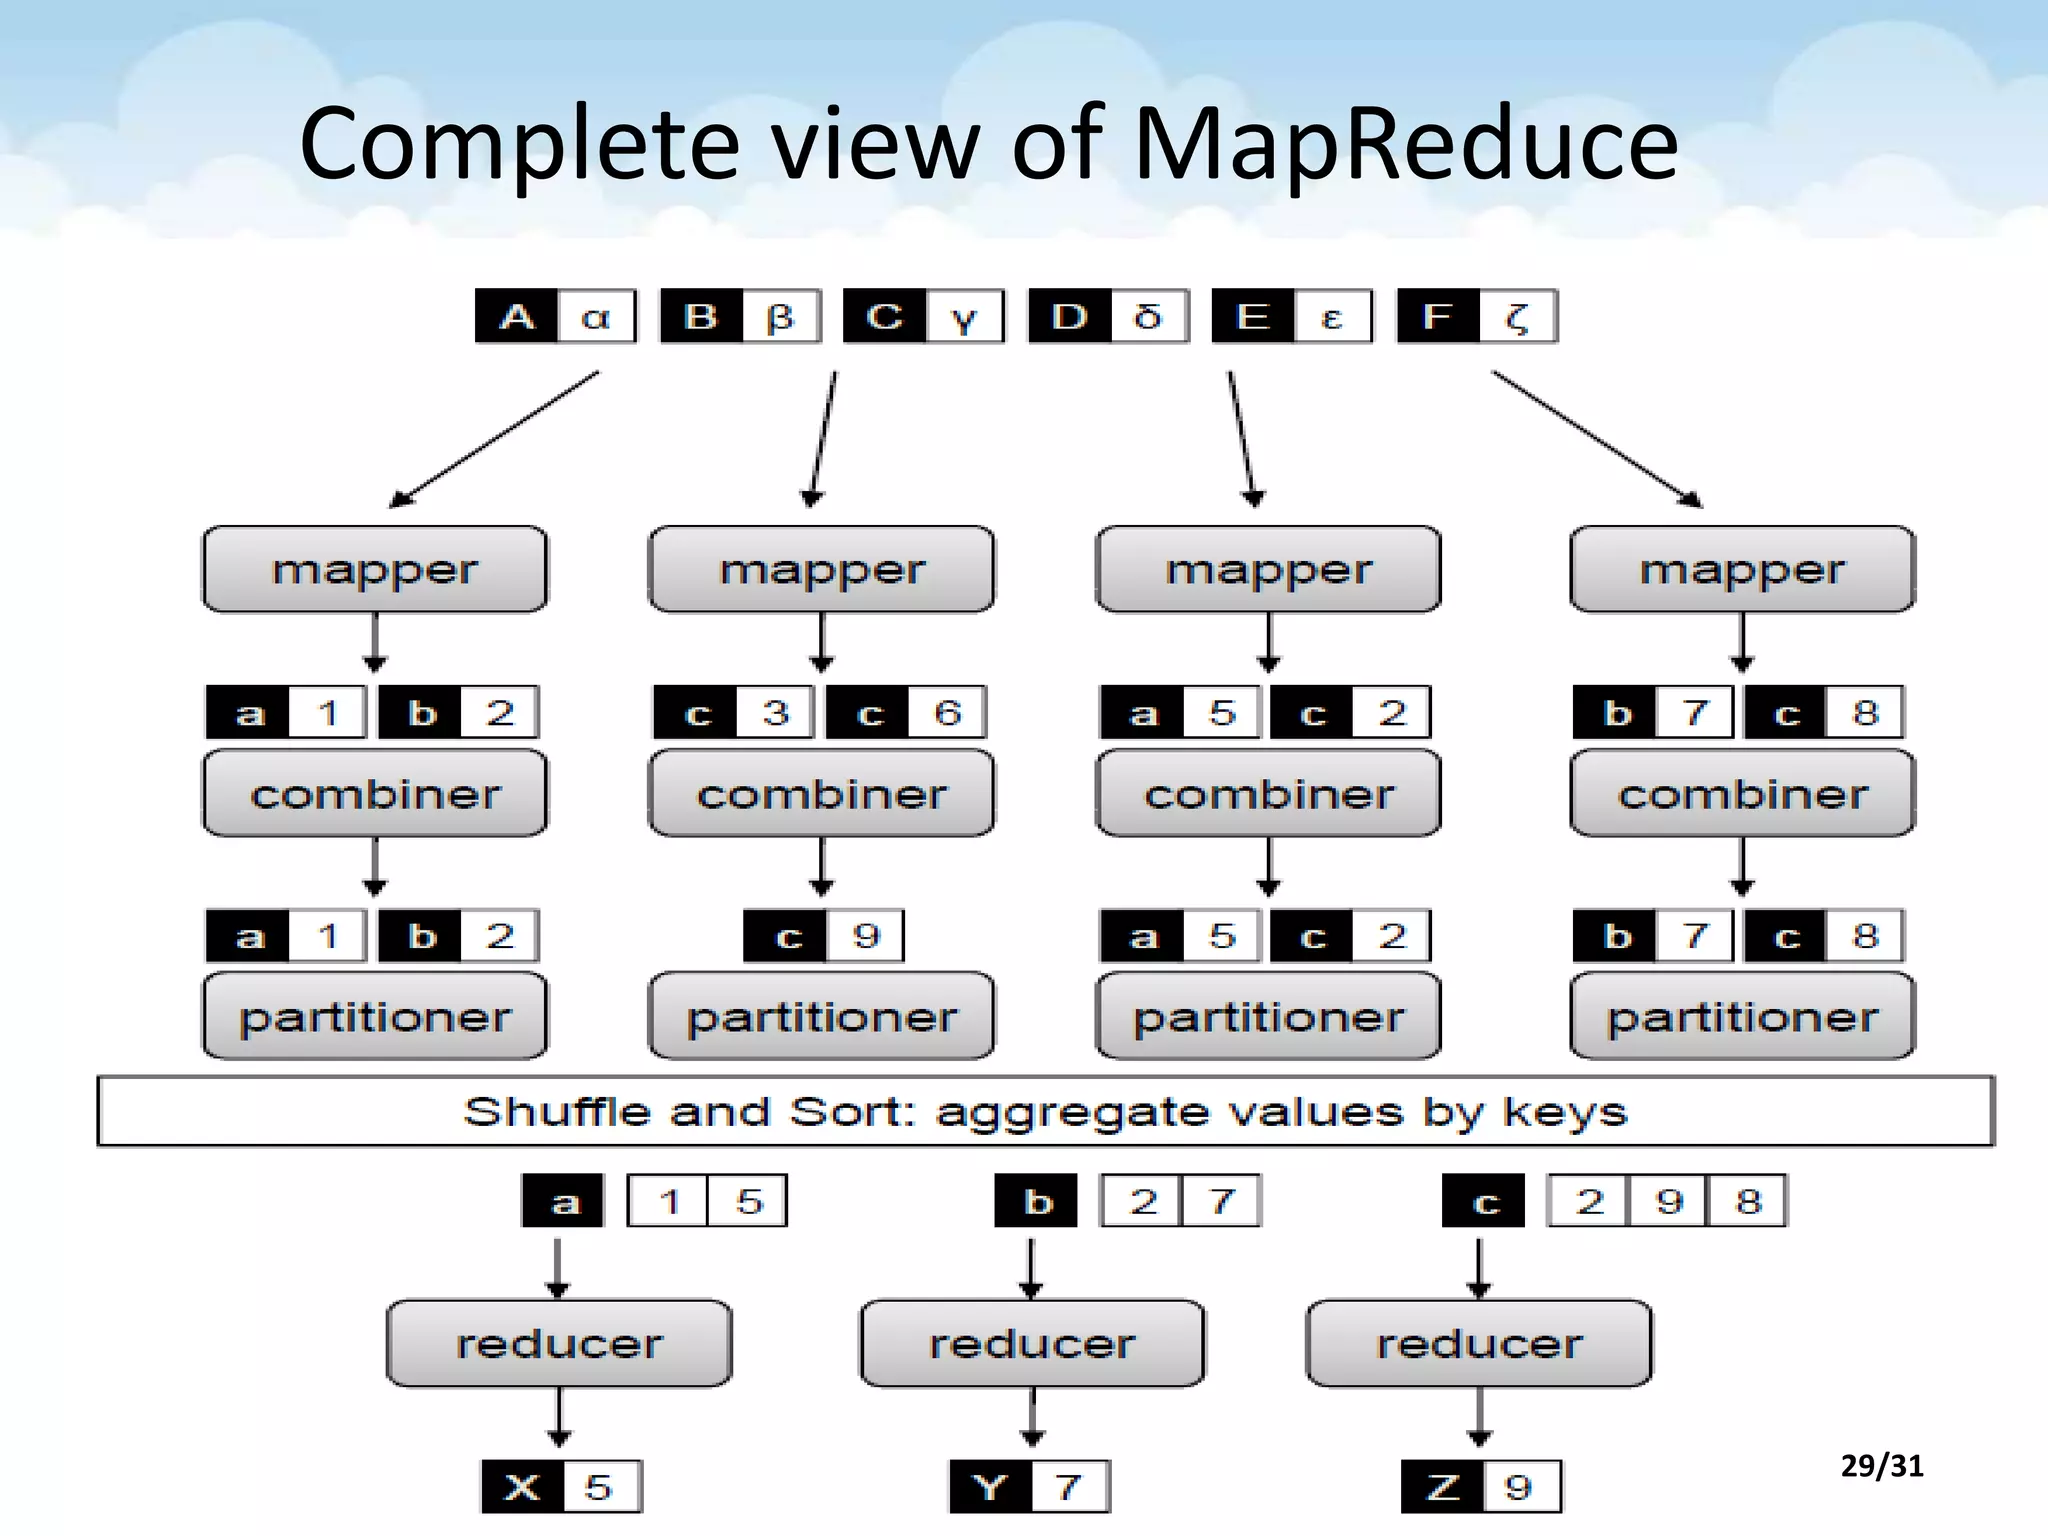
This document provides an introduction to MapReduce, including:
1) MapReduce is a programming model and framework that supports distributed processing of large datasets across clusters of machines. It handles parallelization, fault tolerance, and scheduling.
2) The MapReduce model consists of map and reduce functions that specify the computation. Mappers process input key-value pairs and produce intermediate outputs. Reducers combine intermediate outputs by key.
3) The execution framework handles scheduling, data/code distribution, synchronization, and fault handling to execute the user-specified map and reduce functions on large datasets in parallel across a cluster.
The document discusses MapReduce, a programming model used in distributed computing. It has two main phases - the Map phase and the Reduce phase. In the Map phase, data is processed and broken down into key-value pairs. The Reduce phase combines these pairs into smaller sets of data. MapReduce programs execute in three stages - the Map stage processes input data in parallel, the Shuffle stage consolidates records from Mappers, and the Reduce stage aggregates output to summarize the dataset. Hadoop is an open-source software that uses this model with a master-worker architecture and the HDFS distributed file system.
MapReduce : Simplified Data Processing on Large ClustersAbolfazl Asudeh
MapReduce is a programming model and associated implementation for processing large datasets in a distributed system. It allows users to specify a map function that processes input key-value pairs to generate intermediate output pairs, and a reduce function that merges all intermediate values associated with the same key. The MapReduce system automatically parallelizes the computation across large clusters and handles tasks like scheduling, parallelization, and failure recovery. An example of word counting demonstrates how text documents are broken into words as input pairs, mapped to count occurrences, and reduced to output word frequencies.
The document discusses MapReduce, a programming model for parallel processing of large datasets. It describes key concepts like mapping input data to intermediate key-value pairs, shuffling/sorting pairs by key, and reducing to aggregate values for each key. Mappers run in parallel on splits of input data, reducers run in parallel on partitions of the sorted intermediate data. The infrastructure and middleware work together closely to implement this model across a distributed system.
The document discusses different types of joins that can be performed in MapReduce including map-side joins and reduce-side joins. Map-side joins include replicated joins, where a small dataset is copied to each node and joined with the larger dataset, and semi-joins, where an initial large dataset is filtered before the join. Reduce-side joins, also called repartition joins, involve joining datasets in the reduce phase by setting the join key as the map output key so datasets are colocated for joining. Inequality joins are difficult to implement in MapReduce's key-equality paradigm.
The document summarizes the Pregel system, which was designed for large-scale graph processing. Pregel addresses the inefficiency of MapReduce for graph problems by allowing direct message passing between vertices during synchronized iterations. It provides fault tolerance through checkpointing and a master-worker architecture. Key contributions of Pregel include its distributed programming model and APIs for message passing, combining messages to reduce overhead, global communication through aggregators, and mutating graph topology. The paper notes strengths like fault tolerance but also weaknesses such as putting responsibility on the user and lack of master failure detection.
Meta-MapReduce- A Technique for Reducing Communication in MapReduce ComputationsShantanu Sharma
The federation of cloud and big data activities is the next challenge where MapReduce should be modified to avoid (big) data migration across remote (cloud) sites. This is exactly our scope of research, where only the very essential data for obtaining the result is transmitted, reducing communication, processing and preserving data privacy as much as possible. We propose an algorithmic technique for MapReduce algorithms, called Meta-MapReduce, that decreases the communication cost by allowing us to process and move metadata to clouds and from the map to reduce phases.
Spatial Data Integrator - Software Presentation and Use Casesmathieuraj
Spatial Data Integrator software is an open source ETL tool that adds spatial capabilities to Talend Open Studio for extracting, transforming, and loading geospatial data. It can be used to perform tasks like aggregating data from multiple sources, merging geographic layers, and chaining quality checks on digitized documents. The presentation demonstrated how to configure SDI, connect components, and execute jobs to perform these types of spatial data integration and management tasks.
MapReduce is a programming model used for processing large datasets in a distributed computing environment. It consists of two main tasks - the Map task which converts input data into intermediate key-value pairs, and the Reduce task which combines these intermediate pairs into a smaller set of output pairs. The MapReduce framework operates on input and output in the form of key-value pairs, with the keys and values implemented as serializable Java objects. It divides jobs into map and reduce tasks executed in parallel on a cluster, with a JobTracker coordinating task assignment and tracking progress.
The document describes MR+, an approach that modifies the MapReduce framework to allow map and reduce tasks to interleave and iterate over intermediate results. This helps address issues like skew in intermediate data distribution. MR+ maintains the simple MapReduce programming model while enabling architectural flexibility like scheduling reduce tasks after every few map tasks complete and recursively reducing populated keys. It aims to exploit structure in input data, estimate results early, and perform well on commodity clusters.
Assignment of Different-Sized Inputs in MapReduceShantanu Sharma
This document discusses challenges in assigning different sized inputs to reducers in MapReduce. It introduces the MapReduce programming model and describes two mapping schema problems: (1) the all-to-all mapping problem, where every pair of inputs must be assigned to a reducer, and (2) the X-to-Y mapping problem, where inputs from two disjoint sets must be assigned together. Both problems aim to minimize the number of reducers used while respecting reducer capacity limits. The problems are NP-hard for more than one or two reducers. Several heuristics are discussed to solve the problems, including bin packing algorithms.
MapReduce is a software framework that allows processing of massive datasets across distributed computers. It uses a simple programming model where a problem is broken down into map and reduce phases. In the map phase, data is converted to key-value pairs and in the reduce phase, all values associated with a key are processed to generate results. As an example, a word frequency count of Wikipedia could be generated using MapReduce by splitting the data, mapping each split to count word frequencies, shuffling by key, and reducing to generate final counts.
Towards Systematic Parallel Programming over MapReduceYu Liu
This document discusses programming with MapReduce and proposes a calculational approach for systematic parallel programming over MapReduce. It begins with background on MapReduce and examples of MapReduce programming. It then discusses issues with directly mapping sequential algorithms to MapReduce. The document proposes expressing computations as list homomorphisms, which can be automatically implemented as MapReduce jobs. It presents an interface for defining sequential functions as fold and unfold and discusses implementing list homomorphisms in MapReduce by representing lists and intermediate data. It evaluates the performance of the homomorphism-based approach.
Mizan: A System for Dynamic Load Balancing in Large-scale Graph ProcessingZuhair khayyat
- Mizan is a system for dynamic load balancing in large-scale graph processing using the Pregel framework. It monitors runtime characteristics of vertices and performs efficient fine-grained vertex migration to balance computation and communication across workers.
- Existing Pregel implementations focus on static graph partitioning but this is insufficient for highly dynamic algorithms where workload needs change frequently. Mizan adapts by migrating vertices as needed.
- In an evaluation on a 21-machine cluster, Mizan provided up to 84% improvement over static partitioning techniques, and reduced overhead by 40% even with inefficient initial partitioning. It also demonstrated linear scalability on a 1024-CPU supercomputer.
Map-Side Merge Joins for Scalable SPARQL BGP ProcessingAlexander Schätzle
In recent times, it has been widely recognized that, due to their inherent scalability, frameworks based on MapReduce are indispensable for so-called "Big Data" applications. However, for Semantic Web applications using SPARQL, there is still a demand for sophisticated MapReduce join techniques for processing basic graph patterns, which are at the core of SPARQL. Renowned for their stable and efficient performance, sort-merge joins have become widely used in DBMSs. In this paper, we demonstrate the adaptation of merge joins for SPARQL BGP processing with MapReduce. Our technique supports both n-way joins and sequences of join operations by applying merge joins within the map phase of MapReduce while the reduce phase is only used to fulfill the preconditions of a subsequent join iteration.
Our experiments with the LUBM benchmark show an average performance benefit between 15% and 48% compared to other MapReduce based approaches while at the same time scaling linearly with the RDF dataset size.
MapReduce is a programming model used to process large datasets in a distributed computing environment. It works in three stages - map, shuffle, and reduce. In the map stage, data is processed by the mapper and converted into intermediate key-value pairs. These pairs are shuffled and sorted in the shuffle stage. Finally, in the reduce stage, the intermediate data is processed by the reducer to generate the final output. MapReduce provides an easy way to scale applications by distributing processing across large clusters of commodity servers. It allows parallel processing of large datasets in a reliable, fault-tolerant manner.
MapReduce is one of the most important and major component in Hadoop Ecosystem. Whenever we are having a large set of data then in the case of the huge data set will be divided into smaller pieces and processing will be done on them in parallel in MapReduce.
This document provides an overview and introduction to MapReduce and functional programming concepts. It discusses:
- The map and fold/reduce functions and how they can be used to parallelize computations.
- How MapReduce borrows from functional programming by having users implement map and reduce functions to process large datasets in a parallel and distributed manner.
- Key aspects of MapReduce including automatic parallelization, fault tolerance, and optimizations like locality-aware task assignment and redundant execution of tasks.
MapReduce provides an easy way to process large datasets in a distributed manner. It uses mappers to process input data and generate intermediate key-value pairs, and reducers to combine those intermediate pairs into the final output. Key aspects include job tracking, splitting data into tasks, and storing intermediate output locally rather than on HDFS for efficiency, since it is discarded after reducing.
GRAPH MATCHING ALGORITHM FOR TASK ASSIGNMENT PROBLEMIJCSEA Journal
Task assignment is one of the most challenging problems in distributed computing environment. An optimal task assignment guarantees minimum turnaround time for a given architecture. Several approaches of optimal task assignment have been proposed by various researchers ranging from graph partitioning based tools to heuristic graph matching. Using heuristic graph matching, it is often impossible to get optimal task assignment for practical test cases within an acceptable time limit. In this paper, we have parallelized the basic heuristic graph-matching algorithm of task assignment which is suitable only for cases where processors and inter processor links are homogeneous. This proposal is a derivative of the basic task assignment methodology using heuristic graph matching. The results show that near optimal assignments are obtained much faster than the sequential program in all the cases with reasonable speed-up.
MapReduce is a programming framework that allows for distributed and parallel processing of large datasets. It consists of a map step that processes key-value pairs in parallel, and a reduce step that aggregates the outputs of the map step. As an example, a word counting problem is presented where words are counted by mapping each word to a key-value pair of the word and 1, and then reducing by summing the counts of each unique word. MapReduce jobs are executed on a cluster in a reliable way using YARN to schedule tasks across nodes, restarting failed tasks when needed.
Applications of FME in a Consultant EnvironmentSterling Geo
This document discusses how Mouchel, an infrastructure consultancy, uses FME (Feature Manipulation Engine) software in their work. Some suitable tasks for FME include repetitive tasks, tasks done over many catchment areas, tasks with changing variables, and tasks that follow strict procedures. Flood risk mapping is one major use of FME - it involves using spatial data and models to identify properties at risk of flooding and simulate different rainfall scenarios. FME is used for data preparation, transformation, running simulations, and post-processing results, helping Mouchel efficiently handle "big data" and deliver flood risk information and analyses to clients.
This document provides an overview of MapReduce theory and implementation:
- MapReduce is a programming model that allows for automatic parallelization and distribution of large-scale data processing across hundreds/thousands of CPUs.
- It borrows concepts from functional programming, requiring users to implement map and reduce functions. Map processes key-value pairs in parallel while reduce combines intermediate outputs.
- The MapReduce framework handles fault tolerance, locality of data and tasks, and other optimizations to make large data processing efficient and scalable.
A novel methodology for task distributionijesajournal
Modern embedded systems are being modeled as Heterogeneous Reconfigurable Computing Systems
(HRCS) where Reconfigurable Hardware i.e. Field Programmable Gate Array (FPGA) and soft core
processors acts as computing elements. So, an efficient task distribution methodology is essential for
obtaining high performance in modern embedded systems. In this paper, we present a novel methodology
for task distribution called Minimum Laxity First (MLF) algorithm that takes the advantage of runtime
reconfiguration of FPGA in order to effectively utilize the available resources. The MLF algorithm is a list
based dynamic scheduling algorithm that uses attributes of tasks as well computing resources as cost
function to distribute the tasks of an application to HRCS. In this paper, an on chip HRCS computing
platform is configured on Virtex 5 FPGA using Xilinx EDK. The real time applications JPEG, OFDM
transmitters are represented as task graph and then the task are distributed, statically as well dynamically,
to the platform HRCS in order to evaluate the performance of the designed task distribution model. Finally,
the performance of MLF algorithm is compared with existing static scheduling algorithms. The comparison
shows that the MLF algorithm outperforms in terms of efficient utilization of resources on chip and also
speedup an application execution.
Transforming Data into Information: Supporting Dashboards with FMESafe Software
Data inventories provide high value to an organization if properly exploited. This presentation will focus on the journey we embarked on to open up a disparate collection of data inventories and expose their contents in a way that is efficient and user friendly. Tableau offers a rich interactive experience that allows the user to gain insight and enhance the decision-making process and was identified as the platform for viewing the inventories.
The greatest challenge with this process was translating the disparate data sources to a format Tableau can read and making this process repeatable for frequent updates. The data was represented in several formats including GIS, excel, Access database tables, and text files. Blending the data within Tableau presented a challenge due to the varying formats, therefore FME was used as the middle man to translate the data from its source to a native Tableau data extract. The process of creating the source data also included merging data in different formats based on both attribute values and spatial proximity. FME’s data format versatility and powerful spatial processing made it the perfect tool for the job. In many cases, the data is best represented by watershed or project footprint rather than by Tableau's available default geometry, so the utility of the dashboard was greatly improved using custom geometry created in FME. This presentation will explore the data blending challenges encountered in this project and the solutions developed in FME.
sexy maps comes to R - ggplot+ google maps= ggmap #rstatsAjay Ohri
ggmap is an R package that enables the visualization of spatial data superimposed on static maps from sources like Google Maps and OpenStreetMap. It combines these map images with the layered grammar of graphics implementation in ggplot2. This allows spatial data and models to be easily plotted on top of map backgrounds for contextualization. Key features include downloading maps via the get_map function and then plotting with ggmap using the consistent scales and conventions of ggplot2. The package facilitates the interpretation of spatial analyses and questions by non-experts through these informative visualizations.
Why hadoop map reduce needs scala, an introduction to scoobi and scaldingXebia Nederland BV
This document provides an overview and comparison of Scoobi and Scalding, which are Scala libraries for implementing a higher-level programming model for Hadoop MapReduce. Scoobi uses source code generation to turn manipulations of distributed collection objects into MapReduce jobs, while Scalding wraps around Cascading. Both aim to provide a more intuitive and familiar Scala-based approach compared to lower-level MapReduce programming. The document discusses features of each library and notes that while they have similar capabilities, Scoobi may be closer to idiomatic Scala syntax while Scalding is more widely used due to Twitter's involvement in its development.
This document introduces Pig, an open source platform for analyzing large datasets that sits on top of Hadoop. It provides an example of using Pig Latin to find the top 5 most visited websites by users aged 18-25 from user and website data. Key points covered include who uses Pig, how it works, performance advantages over MapReduce, and upcoming new features. The document encourages learning more about Pig through online documentation and tutorials.
Apache Hive provides SQL-like access to your stored data in Apache Hadoop. Apache HBase stores tabular data in Hadoop and supports update operations. The combination of these two capabilities is often desired, however, the current integration show limitations such as performance issues. In this talk, Enis Soztutar will present an overview of Hive and HBase and discuss new updates/improvements from the community on the integration of these two projects. Various techniques used to reduce data exchange and improve efficiency will also be provided.
The document discusses big data and distributed computing. It provides examples of the large amounts of data generated daily by organizations like the New York Stock Exchange and Facebook. It explains how distributed computing frameworks like Hadoop use multiple computers connected via a network to process large datasets in parallel. Hadoop's MapReduce programming model and HDFS distributed file system allow users to write distributed applications that process petabytes of data across commodity hardware clusters.
This document provides an overview of Hadoop architecture. It discusses how Hadoop uses MapReduce and HDFS to process and store large datasets reliably across commodity hardware. MapReduce allows distributed processing of data through mapping and reducing functions. HDFS provides a distributed file system that stores data reliably in blocks across nodes. The document outlines components like the NameNode, DataNodes and how Hadoop handles failures transparently at scale.
This document provides an overview of big data. It defines big data as large volumes of diverse data that are growing rapidly and require new techniques to capture, store, distribute, manage, and analyze. The key characteristics of big data are volume, velocity, and variety. Common sources of big data include sensors, mobile devices, social media, and business transactions. Tools like Hadoop and MapReduce are used to store and process big data across distributed systems. Applications of big data include smarter healthcare, traffic control, and personalized marketing. The future of big data is promising with the market expected to grow substantially in the coming years.
This presentation, by big data guru Bernard Marr, outlines in simple terms what Big Data is and how it is used today. It covers the 5 V's of Big Data as well as a number of high value use cases.
International Journal of Computational Engineering Research(IJCER) is an intentional online Journal in English monthly publishing journal. This Journal publish original research work that contributes significantly to further the scientific knowledge in engineering and Technology.
Parallel Data Processing with MapReduce: A SurveyKyong-Ha Lee
This document summarizes a survey on parallel data processing with MapReduce. It provides an overview of the MapReduce framework, including its architecture, key concepts of Map and Reduce functions, and how it handles parallel processing. It also discusses some inherent pros and cons of MapReduce, such as its simplicity but also performance limitations. Finally, it outlines approaches studied in recent literature to improve and optimize the MapReduce framework.
MapReduce is a programming model for processing large datasets in a distributed system. It involves a map step that performs filtering and sorting, and a reduce step that performs summary operations. Hadoop is an open-source framework that supports MapReduce. It orchestrates tasks across distributed servers, manages communications and fault tolerance. Main steps include mapping of input data, shuffling of data between nodes, and reducing of shuffled data.
The document summarizes the MapReduce programming model and associated implementation developed by Google for processing and generating large datasets in a distributed computing environment. It describes how users specify computations using map and reduce functions, and the underlying system automatically parallelizes execution across large clusters, handles failures, and coordinates inter-machine communication. The authors note over 10,000 distinct programs have been implemented using MapReduce internally at Google to process over 20 petabytes of data daily across its clusters.
2004 map reduce simplied data processing on large clusters (mapreduce)anh tuan
The document describes MapReduce, a programming model and associated implementation for processing large datasets across distributed systems. It allows users to specify map and reduce functions to process key-value pairs. The runtime system handles parallelization across machines, partitioning data, scheduling execution, and handling failures. Hundreds of programs have been implemented using MapReduce at Google to process terabytes of data on thousands of machines.
The document describes MapReduce, a programming model and associated implementation for processing large datasets across distributed systems. MapReduce allows users to specify map and reduce functions to process key-value pairs. The runtime system automatically parallelizes and distributes the computation across clusters, handling failures and communication. Hundreds of programs have been implemented using MapReduce at Google to process terabytes of data on thousands of machines.
The document describes MapReduce, a programming model and associated implementation for processing large datasets across distributed systems. It allows users to specify map and reduce functions to process key-value pairs. The runtime system handles parallelization across machines, partitioning data, scheduling execution, and handling failures. Hundreds of programs have been implemented using MapReduce at Google to process terabytes of data on thousands of machines.
The document describes MapReduce, a programming model and implementation for processing large datasets across clusters of computers. The model uses map and reduce functions to parallelize computations. Map processes key-value pairs to generate intermediate pairs, and reduce merges values with the same intermediate key. The implementation handles parallelization, distribution, and fault tolerance transparently. Hundreds of programs have been implemented using MapReduce at Google, processing terabytes of data on thousands of machines daily.
Mapreduce - Simplified Data Processing on Large ClustersAbhishek Singh
The document describes MapReduce, a programming model and implementation for processing large datasets across clusters of computers. It allows users to write map and reduce functions to parallelize tasks. The MapReduce library automatically parallelizes jobs, distributes data and tasks, handles failures and coordinates communication between machines. It is scalable, processing terabytes of data on thousands of machines, and easy for programmers without parallel experience to use.
This document introduces MapReduce, a programming model for processing large datasets across distributed systems. It describes how users write map and reduce functions to specify computations. The MapReduce system automatically parallelizes jobs by splitting input data, running the map function on different parts in parallel, collecting output, and running the reduce function to combine results. It handles failures and distribution of work across machines. Many common large-scale data processing tasks can be expressed as MapReduce jobs. The system has been used to process petabytes of data on thousands of machines at Google.
This document introduces MapReduce, a programming model and associated implementation for processing large datasets across distributed systems. The key aspects are:
1. Users specify map and reduce functions that process key-value pairs. The map function produces intermediate key-value pairs and the reduce function merges values for the same key.
2. The system automatically parallelizes the computation by partitioning input data and scheduling tasks on a cluster. It handles failures, data distribution, and load balancing.
3. The implementation runs on large Google clusters and is highly scalable, processing terabytes of data on thousands of machines. Hundreds of programs use MapReduce daily at Google.
This document discusses generating frequent itemsets using the RElim algorithm on Hadoop clusters. It begins with an abstract describing frequent itemset mining and how MapReduce is useful for large-scale data mining applications. It then provides background on Hadoop and MapReduce, describing how it partitions data and computation across clusters. The document introduces association rule mining and describes how traditional algorithms like Apriori have limitations at large scales. It proposes using the RElim algorithm on Hadoop's MapReduce framework to overcome these limitations and efficiently generate frequent itemsets from big data.
MapReduce is a programming model for processing large datasets in a distributed system. It allows parallel processing of data across clusters of computers. A MapReduce program defines a map function that processes key-value pairs to generate intermediate key-value pairs, and a reduce function that merges all intermediate values associated with the same intermediate key. The MapReduce framework handles parallelization of tasks, scheduling, input/output handling, and fault tolerance.
The document provides an introduction to MapReduce, including:
- MapReduce is a framework for executing parallel algorithms across large datasets using commodity computers. It is based on map and reduce functions.
- Mappers process input key-value pairs in parallel, and outputs are sorted and grouped by the reducers.
- Examples demonstrate how MapReduce can be used for tasks like building indexes, joins, and iterative algorithms.
The document provides an overview of MapReduce, including:
1) MapReduce is a programming model and implementation that allows for large-scale data processing across clusters of computers. It handles parallelization, distribution, and reliability.
2) The programming model involves mapping input data to intermediate key-value pairs and then reducing by key to output results.
3) Example uses of MapReduce include word counting and distributed searching of text.
This document discusses embarrassingly parallel problems and the MapReduce programming model. It provides examples of MapReduce functions and how they work. Key points include:
- Embarrassingly parallel problems can be easily split into independent parts that can be solved simultaneously without much communication. MapReduce is well-suited for these types of problems.
- MapReduce involves two functions - map and reduce. Map processes a key-value pair to generate intermediate key-value pairs, while reduce merges all intermediate values associated with the same intermediate key.
- Implementations like Hadoop handle distributed execution, parallelization, data partitioning, and fault tolerance. Users just provide map and reduce functions.
This document provides an overview of Hadoop MapReduce scheduling algorithms. It discusses several commonly used algorithms like FIFO, fair scheduling, and capacity scheduler. It also introduces more advanced algorithms such as LATE, SAMR, ESAMR, locality-aware scheduling, and center-of-gravity scheduling that aim to improve metrics like fairness, throughput, response time, and resource utilization. The document concludes by listing references for further reading on MapReduce scheduling techniques.
Hadoop MapReduce is an open source framework for distributed processing of large datasets across clusters of computers. It allows parallel processing of large datasets by dividing the work across nodes. The framework handles scheduling, fault tolerance, and distribution of work. MapReduce consists of two main phases - the map phase where the data is processed key-value pairs and the reduce phase where the outputs of the map phase are aggregated together. It provides an easy programming model for developers to write distributed applications for large scale processing of structured and unstructured data.
In this presentation , i provide in depth information about the how MapReduce works. It contains many details about the execution steps , Fault tolerance , master / worker responsibilities.
This document provides an overview of MapReduce and Hadoop frameworks. It describes how MapReduce works by dividing data processing into two phases - map and reduce. The map phase processes input data in parallel and produces intermediate key-value pairs, while the reduce phase aggregates the intermediate outputs by key. Hadoop provides an implementation of MapReduce by running tasks on a distributed file system and coordinating execution across clusters.
1. Introduction to MapReduce
Masoumeh Rezaei jam
In the name of God
Distributed Systems course
Department of Computer Engineering
University of Tabriz
22th May 2012
3. Introduction
Cloud computing
involves large-scale,
distributed
computations on data
from multiple sources.
MapReduce is a
programming model
as well as a
framework that
supports the model.
it enables to process a
massive volume of
data in parallel with
many low-end
computing nodes.
Introduction to MapReduce 3/31
4. Introduction (cont.)
The Emergence of
MapReduce
Introduced by Google in
2004 to support simplified
distributed computing on
clusters of computers
Social-networking
services, video-sharing
sites, web-based email
services, and applications
Introduction to MapReduce 4/31
5. Importance
of
MapReduce
Von Neumann isn't sufficient
Scales to large clusters of machines
Organize computations on clusters
Effective tool for tackling large-data
The model is easy to use
Importance of MapReduce
5/31Introduction to MapReduce
6. Characteristics
• Main idea of MapReduce
• No race condition, lock contention, etc.
• to focus on data processing strategies
Hide system-level
details from the
developers
• Developer specifies the computation that
needs to be performed
• Execution framework (“runtime”) handles
actual execution
Separating the
“what” from
“how”
• Move processing to the data
• Seamless scalability
Big data
6/31Introduction to MapReduce
7. MapReduce Overview
Users specify the computation in terms of a
map and a reduce function.
The underlying runtime system automatically
parallelizes the computation across large-scale
clusters of machines, handles machine
failures, and schedules inter-machine
communication to make efficient use of the
network and disks.
Introduction to MapReduce 7/31
8. The Execution Framework
A MapReduce program, consists of code for
mappers and reducers (as well as combiners and
partitioners) together with configuration
parameters
The developer submits the job to the submission
node of a cluster and execution framework (the
“runtime") takes care of everything else: it
transparently handles all other aspects of
distributed code execution, on clusters ranging
from a single node to a few thousand nodes.
9. Specific responsibilities of Execution
Framework
Scheduling
Data /
code co-
location
Synchronization
Error
and
fault
handling
9/31
11. The mapper is applied to every input key-value pair (split across an
arbitrary number of files) to generate an arbitrary number of
intermediate key-value pairs.
Simplified view of MapReduce
Key-value pairs form the basic data structure in MapReduce.Part of the design of MapReduce algorithms involves
imposing the key-value structure on arbitrary datasets.
web pages: (URLs, the actual HTML content)
graph: (node id, adjacency lists of node)
The reducer is applied to all values associated with the same
intermediate key to generate output key-value pairs.
12/31
13. Mapper & Reducers
Mappers and Reducers are objects that implement the Map and Reduce
methods, respectively.
A mapper object is a worker initialized for each map task and the Map method is
called on each key-value pair by the execution framework.
if an input is broken down into 400 blocks and there are 40 mappers in a cluster,
the number of map tasks are 400 and the map tasks are executed through 10
waves of task runs.
The situation is similar for the reduce phase: a reducer object is a worker
initialized for each reduce task, and the Reduce method is called once per
intermediate key.
Introduction to MapReduce 14/31
14. An example of using MapReduce
Input Map Reduce Output
15/31Introduction to MapReduce
15. PowerPoint has new
layouts that give you
more ways to present
your words, images
and media.
Combiners
Combiners & Partitioners
They are an optimization in MapReduce
that allow for local aggregation before
the shuffle and sort phase.
To perform local aggregation on the
output of each mapper, i.e.,to compute
a local count for a key over all the
documents processed by the mapper.
Perform it to cut down on the number of
intermediate key-value pairs
16/31Introduction to MapReduce
16. PowerPoint has new
layouts that give you
more ways to present
your words, images
and media.
Partitioners
Combiners & Partitioners (cont.)
They are responsible for dividing
up the intermediate key space
and assigning intermediate
key-value pairs to reducers.
The execution framework uses
this information to copy the data
to the right location during the
shuffle and sort phase.
Simplest partitioner involves computing the
hash value of the key and then taking the
mod of that value with the number of
reducers.
17/31Introduction to MapReduce
17. ONE TAB TWO TAB FOUR TAB FIVE
Before starting the Map task, an input file is loaded on the
distributed file system.
At loading, the file is partitioned into multiple data blocks with
same size, typically 64MB.
Each block is triplicated to guarantee fault-tolerance.
Steps of MapReduce Execution
18/31Introduction to MapReduce
18. TWO TAB TWO TAB FOUR TAB FIVE
Each block is then assigned to a mapper.
The mapper applies Map() to each record in the data block.
Steps of MapReduce Execution
19/31Introduction to MapReduce
19. THREE TAB FOUR TAB FIVE
The intermediate outputs produced by the mappers are then
sorted locally for grouping key-value pairs sharing the same key.
Steps of MapReduce Execution
20/31Introduction to MapReduce
20. FOUR TAB FOUR TAB FIVE
After local sort, Combine() is optionally applied to perform pre-
aggregation on the grouped key-value pairs,
so that the communication cost of transfer all the intermediate
outputs to reducers is minimized.
Steps of MapReduce Execution
21/31Introduction to MapReduce
21. FIVE TAB FIVE
The mapped outputs are stored in local disks of the mappers,
partitioned into R, where R is the number of Reduce tasks in the
MR job.
This partitioning is basically done by a hash function, e.g.
hash(key) mod R.
Steps of MapReduce Execution
22/31Introduction to MapReduce
22. SIX TAB FIVE
When all Map tasks are completed, the MapReduce scheduler
assigns Reduce tasks to workers.
Steps of MapReduce Execution
23/31Introduction to MapReduce
23. SEVEN
Since all mapped outputs are already partitioned and stored in
local disks, each reducer performs the shuffling by simply pulling
its partition of the mapped outputs from mappers.
Steps of MapReduce Execution
24/31Introduction to MapReduce
24. EIGHT
A reducer reads the intermediate results and merge them by the
intermediate keys, i.e. key2, so that all values of the same key
are grouped together.
Sometime this grouping is done by external merge-sort.
Steps of MapReduce Execution
25/31Introduction to MapReduce
25. NINE
Then each reducer applies Reduce() to the intermediate values
for each key2 it encounters.
The output of reducers are stored and triplicated in HDFS.
Steps of MapReduce Execution
26/31Introduction to MapReduce
26. Introduction to MapReduce
Hadoop Architecture
the single opportunity for global synchronization is the barrier between the map
and reduce phases
Due to that between the map and reduce tasks, the map phase of a job is only as
fast as the slowest map task. Similarly, the completion time of a job is bounded by
the running time of the slowest reduce task.
27/31
27. MapReduce Execution
the number of Map tasks does not depend on the number of nodes,
but the number of input blocks.
Each block is assigned to a single Map task.
28/31
29. Conclusion
In this peresentation, MapReduce as a
programming model for expressing distributed
computations on massive amounts of data
and an execution framework for large-scale
data processing on clusters of commodity
servers was discussed.
MapReduce can enhance the productivity for
junior developers who lack the experience of
distributed/parallel development.
Introduction to MapReduce 30/31
30. References
Jimmy Lin, Chris Dyer, “Data-Intensive Text Processing with MapReduce,”
2010
R. Buyya, C. Shin Yeo, S. Venugopal, J. Broberg, I. Brandic, “Cloud
computing and emerging IT platforms: Vision, hype, and reality for
delivering computing as the 5th utility,” 2009.
Kyong-Ha Lee, Yoon-Joon Lee, Hyunsik Choi, Yon Dohn Chung, Bongki
Moon, “Parallel Data Processing with MapReduce: A Survey,” 2011
B.Thirumala Rao , Dr. L.S.S.Reddy , “Survey on Improved Scheduling in
Hadoop MapReduce in Cloud Environments,” 2011
Jeffrey Dean, Sanjay Ghemawat , “MapReduce: Simplified Data
Processing on Large Clusters,” 2008
Introduction to MapReduce 31/31
Editor's Notes
Shaded text boxes with arrows(Intermediate)To reproduce the top shape with text effects on this slide, do the following:On the Home tab, in theSlides group, click Layout, and then click Blank.On the Home tab, in theDrawing group, click Shapes, and then under Rectangles, click Rounded Rectangle (second option from the left). On the slide, drag to draw a rounded rectangle.Select the rectangle. Under DrawingTools, on the Format tab, in the Size group, do the following:In the Shape Height box, enter .52”.In the Shape Width box, enter 3.75”.Drag the yellow diamond adjustment handle (at the top left of the rectangle) to the right to increase the amount of rounding at the corners of the rectangle. Select the rectangle. On the Home tab, in the bottom right corner of the Drawing group, click the Format Shape dialog box launcher. In the Format Shape dialog box, click Fill in the left pane, select Gradient fill in the right pane, and then do the following:In the Type list, select Linear. Click the button next to Direction, and then clickLinear Down (first row, second option from the left).Under Gradient stops, click Add gradient stop or Remove gradient stop until two stops appear in the slider.Also under Gradient stops, customize the gradient stops that you added as follows:Select the first stop in the slider, and then do the following:In the Position box, enter0%.Click the button next to Color, and then under Theme Colorsclick White, Background 1(first row, first option from the left).Select the last stop in the slider, and then do the following:In the Position box, enter100%.Click the button next to Color, and then under Theme Colorsclick White, Background 1, Darker 15%(third row, first option from the left).Also in the Format Shape dialog box, click Line Color in the left pane, select Gradient Line in the right pane, and then do the following:In the Type list, select Linear. Click the button next to Direction, and then clickLinear Up (second row, second option from the left). Under Gradient stops, click Add gradient stop or Remove gradient stop until two stops appear in the slider.Also under Gradient stops, customize the gradient stops that you added as follows:Select the first stop in the slider, and then do the following:In the Position box, enter0%.Click the button next to Color, and then under Theme Colorsclick White, Background 1(first row, first option from the left).Select the last stop in the slider, and then do the following:In the Position box, enter100%.Click the button next to Color, and then under Theme Colorsclick White, Background 1, Darker 25%(fourth row, first option from the left).Also in the Format Shape dialog box, click Line Style in the left pane, and then in the right pane, in the Width box, enter 2 pt. Also in the Format Shapedialog box, click Glow and Soft Edges in the left pane, and then in the right pane, under Glow, do the following:In the Size box, enter 5. Click the button next to Color, and then under Theme Colorsclick White, Background 1, Darker 25% (fourth row, first option from the left).On the slide, right-click the rounded rectangle, click Edit Text, then enter text. Select the text. On the Home tab, in the Font group, select Franklin Gothic Medium Cond from the Font list, select 24 from the Font Size list, and then click the arrow next to Font Color and under Theme Colorsclick White, Background 1, Darker 35% (fifth row, first option from the left).On the Home tab, in the Paragraph group, click Align Text Left to align the text left in the text box.Under Drawing Tools, on the Format tab, in the bottom right corner of the WordArt Styles group, click the Format Text Effects dialog box launcher. In the Format Text Effects dialog box, click Text Box in the left pane. In the right pane, under Internal margin, enter 0.6” in the Left box to increase the left margin in the rounded rectangle to accommodate the embossed circle. To reproduce the olive-green circle and arrow for the top shape on this slide, do the following:On the Home tab, in the Drawing group, click Shapes, and then under Basic Shapes click Oval (first row, second option from the left). Press and hold SHIFT to constrain the shape to a circle, and then on the slide, drag to draw a circle. Select the circle. Under DrawingTools, on the Format tab, in the Size group, do the following:In the Shape Height box, enter .4”.In the Shape Width box, enter .4”.On the Home tab, in the bottom right corner of the Drawing group, click the Format Shape dialog box launcher. In the Format Shape dialog box, click Fill in the left pane. In the right pane, select Solid Fill, and then click the button next to Color and under Theme Colors click Olive Green, Accent 3, Lighter 60% (third row, seventh option from the left). Also in the Format Shape dialog box, click Line Color in the left pane, and then select No line in the right pane.Also in the Format Shape dialog box, click Shadow in the left pane, and then do the following:Click the button next to Presets, and then under Inner click Inside Diagonal Top Left (first row, first option from the left).In the Transparency box, enter 80%.In the Distance box, enter 2 pt. Drag the circle onto the left side of the rounded rectangle. On the Home tab, in the Drawing group, click Shapes, and then under Block Arrows click Chevron (second row, eighth option from the left). On the slide, drag to draw the chevron on the circle.Select the chevron. Under DrawingTools, on the Format tab, in the Size group, do the following:In the Shape Height box, enter .23”.In the Shape Width box, enter .23”.On the Home tab, in the Drawing group, click Shape Fill, and then click White, Background 1 (first row, first option from the left). On the Home tab, in the Drawing group, click Shape Outline, and then click No Outline. Press and hold SHIFT and select all three shapes.On the Home tab, in the Drawing group, click Arrange, point to Align, and then click Align Middle. To reproduce the other shapes and arrange them on this slide, do the following:Press and hold SHIFT and select all three shapes.On the Home tab, in the Drawing group, click Arrange, and then under Group Objects click Group.On the Home tab, in the Clipboard group, click the arrow to the right of Copy, and then click Duplicate. Repeat the process until you have a total of four groups of shapes.Separate each group of shapes and loosely arrange them on the slide.Press and hold SHIFT and select all four groups of shapes.On the Home tab, in the Drawing group, click Arrange, and then do the following:Point to Align, and then click Align Selected Objects.Point to Align, and click Distribute Vertically.Point to Align, and then click Align Center. Under Group Objects click Group.Point to Align, and make sure Align to Slide is selected.Point to Align, and then click Align Center.Point to Align, and then click Align Middle.To change the color for the duplicate circles (second, third, and fourth from the top), do the following:Press and hold SHIFT and select all four groups of shapes.On the Home tab, in the Drawing group, click Arrange, and click Ungroup. Select the circle that you would like to change.Under Drawing Tools, on the Format tab, in the Shape Stylesgroup, click the arrow next toShape Fill, and then do the following:For the second circle from the top, under Theme Colors, clickBlue, Accent 1, Lighter 60% (third row, fifth option from the left).For the third circle from the top, under Theme Colors, clickPurple, Accent 4, Lighter 60% (third row, eighth option from the left).For the fourth circle from the top, under Theme Colors, clickRed, Accent 2, Lighter 60% (third row, sixth option from the left).To reproduce the background on this slide, do the following:Right-click the slide background area, and then clickFormat Background.In the Format Background dialog box, click Fill in the left pane, select Gradient fill in the right pane, and then do the following:In the Type list, select Radial.Click the button next to Direction, and then clickFrom Center (third option from the left).Under Gradient stops, click Add gradient stop or Remove gradient stop until two stops appear in the slider.Also under Gradient stops, customize the gradient stops that you added as follows:Select the first stop in the slider, and then do the following:In the Position box, enter0%.Click the button next to Color, and then under Theme Colorsclick White, Background 1, Darker 15% (third row, first option from the left).Select the last stop in the slider, and then do the following:In the Position box, enter80%.Click the button next to Color, and then under Theme Colorsclick White, Background 1 (first row, first option from the left).
مپ ردیوس که بوسیله ی گوگل عمومی شده است، ابزار پردازش داده ی مقیاس پذیر و تحمل پذیر خطا است که امکان پردازش حجم بزرگی از داده را بطور موازی با تعداد زیادی از گره های محاسباتی غیر قدرتمند فراهم میکند. مپ ردیوس یک مدل برنامه نویسی بعلاوه ی چارچوبی است که آنرا ساپورت میکند.
One of the most significant advantages of MapReduce is that it provides an abstraction that hides many system-level details from the programmer. Therefore, a developer can focus on what computations need to be performed, as opposed to how those computations are actually carried out or how to get the data to the processes that depend on them.
spreading data across the local disks of nodes in a cluster
یک برنامه ی مپ ردیوس که بعنوان یک job ارجاع داده می شود، کد برای مپرها و ردیوسر ها (بعلاوه ی ترکیب کنندها و تقسیم کننده ها) که با هم با پارامترهای پیکر بندی (مثلا اینکه کجا ورودی می نشیند و کجا خروجی باید ذخیره شود) بسته بندی شده اند را شامل می شودتوسعه دهنده(developer) کار(job) را به گره ی فرمانبر واگذار می کند و چارچوب اجرا(execution framework که گاهی "runtime" نامیده می شود) از هرچیز دیگری مراقبت می کند: بطور شفاف تمام جنبه های دیگر-ه اجرای توزیع شده ی کد را روی کلاسترهای از رنج-ه یک گره ی تنها تا چند هزار گره را اداره می کند. وظایف خاص شامل موارد زیر می شود:
زوج های کلید-مقدار ساختمان داده ی پایه در مپ ریوس را شکل می دهند. کلیدها و مقدارها میتوانند مقدماتی مثل اینتیجرها باشند یا ساختمان های پیچیده ی اختیاری مثل تیوپل. معمولا برنامه نویسان برای ساده تر کردن تسک، انواع داده ی خودشان را تعریف میکنند.قسمتی از طراحی الگوریتم مپ ردیوس، درگیر تحمیل کردن-ه ساختار-ه کلید-مقدار روی مجموعه های داده ی اختیاری می شود. مثلا برای مجموعه ای از صفحات وب، کلیدها URL ها هستند و مقدارها، محتوای HTML-ه واقعی
ایده اصلی آن مخفی کردن جزئیات اجرای موازی است و به کاربر اجازه می دهد تا فقط روی استراتژی های پردازش داده تمرکز کند.شامل دو تابع اولیه است: مپ و ردیوسورودی-ه مپ ردیوس لیستی از جفت های (کلید1و مقدار 1) است و مپ() برای هر جفت بکار برده می شود تا جفتهای (کلید 2 و مقدار 2)-ه میانی را محاسبه کند.جفتهای کلید-مقدار باهم دیگر براساس مقدار کلید دسته بندی می شوند، یعنی (کلید2 و لیست(مقدار 2)). برای هر کلید2، ردیوس روی لیستی از همه ی مقادیر کار میکند و سپس صفر یا بیشتر نتیجه ی جمع شده را تولید می کند.---خودم:در مثال شمارش تعداد کلمات متن، کلید همان کلمات هستند. که آنها را براساس تعداد تکرارشان لیست کرده یا همان جمع میکند.---کاربر می تواند تابعهای مپ و ردیوس را تعریف کند، اگرچه آنها چارچوبهای مپ ردیوس را می خواهند.
دو عنصر افزوده وجود دارند که مدل برنامه نویسی را کامل می کنند: تقسیم کننده ها و ادغام کننده هاتقسیم کننده ها مسئول-ه به اشتراک گذاشتن-ه فضای کلید میانی هستند و زوج های کلید-مقدار میانی را به ردیوسرها واگذار می کنند. به عبارت دیگر، تقسیم کننده مشخص می کند که یک زوج-ه کلید-مقدار میانی، باید به کدام تسک کپی شود. در داخل-ه هر ردیوسر، کلیدها در ترتیب-ه مرتب شده پردازش می شوند (که اینکه چطور "دسته بندی" پیاده سازی شده است می باشد.)
برای این بطور محلی مرتب میشوند تا تمام زوجهایی که کلید یکسان دارند و در حافظه های مپرهای متفاوتی قرار دارند، بتوانند دسته بندی و گروپ شوندبرای مشخص کردن اینکه هر کلید به کدام تسکِ ردیوس واگذار شود، از تابع هش استفاده می شود.خودم: چون تعداد تسک های مپ و ردیوس لزوما برابر نیست و به این طریق نگاشت مپ به ردیوس مدبریت می شود.
Animated tab slides over five headers(Intermediate)Tip: You will need to use drawing guides to position the shapes and text on the slide. To display and set the drawing guides, do the following:On the Home tab, in the Slides group, click Layout, and then click Blank.Right-click the slide background area, and then click Grid and Guides.In the Grid and Guides dialog box, underGuidesettings, select Display drawing guides on screen. (Note: One horizontal and one vertical guide will display on the slide at 0.00, the default position. As you drag the guides, the cursor will display the new position.) On the slide, do the following:Press and hold CTRL, select the vertical guide, and then drag it left to the 3.50 position.Press and hold CTRL, select the vertical guide, and then drag it left to the 1.75 position.Press and hold CTRL, select the vertical guide, and then drag it right to the 1.75 position.Press and hold CTRL, select the vertical guide, and then drag it right to the 3.50 position.To reproduce the long, thin rectangle on this slide, do the following:On the Home tab, in the Drawing group, click Shapes, and then under Rectangles click Rectangle (first option from the left). On the slide, drag to draw a rectangle. Select the rectangle. Under DrawingTools, on the Format tab, in the Size group, do the following: In the ShapeHeight box, enter 0.05”.In the ShapeWidth box, enter 10”.Under DrawingTools, on the Format tab, in the bottom right corner of the ShapeStyles group, click the FormatShape dialog box launcher. In the FormatShape dialog box, in the left pane, click LineColor. In the LineColor pane, select Noline.Also in the FormatShape dialog box, in the left pane, click Shadow. In the Shadow pane, click the button next to Presets, under Outer click OffsetBottom (first row, second option from the left), and then do the following:In the Transparency box, enter 68%.In the Blur box, enter 3.5 pt.In the Distance box, enter 2.2 pt.Also in the FormatShape dialog box, in the left pane, click 3-D Format. In the 3-D Format pane, do the following:Under Bevel, click the button next to Top, and then under Bevel click Circle (first row, first option from the left). Next to Top, in the Width box, enter 15 pt,and in the Height box, enter 3 pt.Under Surface, click the button next to Lighting, and then under Neutral click Balance (first row, second option from the left). In the Angle box, enter 145°. On the slide, drag the rectangle about 0.25” above the 0.00 horizontal drawing guide. (Note: To view the ruler, on the View tab, in the Show/Hide group, select Ruler.)On the Home tab, in the Drawing group, click Arrange, point to Align, and then do the following:Click Align to Slide. Click AlignCenter.To reproduce the tab (rounded rectangle) on this slide, do the following:On the Home tab, in the Drawing group, click the More arrow to expand the shapes gallery, and then under Rectangles click Round Same Side Corner Rectangle (eighth option from the left). On the slide, drag to draw a rounded rectangle. On the slide, select the rounded rectangle. Under DrawingTools, on the Format tab, in the Size group, do the following: In the ShapeHeight box, enter 0.58”.In the ShapeWidth box, enter 1.33”.Under DrawingTools, on the Format tab, in the bottom right corner of the ShapeStyles group, click the FormatShape dialog box launcher. In the FormatShape dialog box, in the left pane, click LineColor. In the LineColor pane, select Noline.Also in the FormatShape dialog box, in the left pane, click Shadow. In the Shadow pane, click the button next to Presets, under Outer click OffsetBottom (first row, second option from the left), and then do the following:In the Transparency box, enter 68%.In the Blur box, enter 3.5 pt.In the Distance box, enter 2.2 pt.Also in the FormatShape dialog box, in the left pane, click 3-D Format. In the 3-D Format pane, do the following:Under Bevel, click the button next to Top, and then under Bevel click Circle (first row, first option from the left). Next to Top, in the Width box, enter 4 pt,and in the Height box, enter 4 pt.Under Surface, click the button next to Lighting, and then under Neutral click Balance (first row, second option from the left). In the Angle box, enter 145°. On the slide, drag the rounded rectangle until the bottom edge touches the top edge of the long, thin rectangle and it is centered on the 3.50 left vertical drawing guide.To reproduce the first text box on this slide, do the following:On the Insert tab, in the Text group, click TextBox. On the slide, drag to draw a text box. Enter TAB ONE,and then select the text. On the Home tab, in the Font group, do the following:In the Font list, select TW Cen MT Condensed.In the FontSize box, enter 22 pt. On the Home tab, in the Paragraph group, click Center to center the text in the text box.On the slide, drag the text box onto the rounded rectangle until the bottom edge of the text is 0.5” above the 0.00 horizontal drawing guide and it is centered on the 3.50 left vertical drawing guide.To reproduce the other text boxes on this slide, do the following:On the slide, select the first text box. On the Home tab, in the Clipboard group, click the arrow under Copy, and then click Duplicate. Repeat this process three more times for a total of five text boxes.Click in one of the duplicate text boxes, delete TAB ONE, and then enter TAB TWO. Drag the second text box until the bottom edge of the text is 0.5” above the 0.00 horizontal drawing guide and it is centered on the 1.75 left vertical drawing guide.Click in another duplicate text box, delete TAB ONE, and then enter TAB THREE.Drag the third text box until the bottom edge of the text is 0.5” above the 0.00 horizontal drawing guide and it is centered on the 0.00 vertical drawing guide. Click in another duplicate text box, delete TAB ONE, and then enter TAB FOUR.Drag the fourth text box until the bottom edge of the text is 0.5” above the 0.00 horizontal drawing guide and it is centered on the 1.75 right vertical drawing guide.Click in the last duplicate text box, delete TAB ONE, and then enter TAB FIVE.Drag the fifth text box until the bottom edge of the text is 0.5” above the 0.00 horizontal drawing guide and it is centered on the 3.50 right vertical drawing guide.Select the text in the first text box. On the Home tab, in the Font group, click the arrow next to Font Color, and then under ThemeColors click White, Background 1 (first row, first option from the left). Repeat this process for each of the other text boxes. To reproduce the animation effects on this slide, do the following:On the Animations tab, in the Advanced Animations group, click Animation Pane. On the Home tab, in the Editing group, click Select, and then click Selection Pane.In the Selection and Visibility task pane, select the rounded rectangle (“Round Same Side Corner Rectangle” object). In the Animation group, click the More arrow to expand the effects gallery, then under MotionPaths, click Lines. In the Animation group, click Effect Options and under Direction, click Right.On the slide, point to the endpoint (red arrow) of the selected motion path until the cursor becomes a two-headed arrow. Press and hold SHIFT, and then drag the endpoint to the 1.75 left vertical drawing guide. In the Selection and Visibility taskpane, select the rounded rectangle again. In the Advanced Animation group, click Add Animation, and under MotionPaths, click Lines. In the Animation group, click Effect Options and under Direction, click Right.In the Animation Pane, select the second animation effect (right motion path for the rounded rectangle).On the slide, point to the endpoint (red arrow) of the selected motion path until the cursor becomes a two-headed arrow. Press and hold SHIFT, and then drag the endpoint to the 0.00 vertical drawing guide. On the slide, point to the starting point (green arrow) of the selected motion path until the cursor becomes a two-headed arrow. Press and hold SHIFT, and then drag the starting point to the 1.75 left vertical drawing guide. In the Selection and Visibility taskpane, select the rounded rectangle again. In the Advanced Animation group, click Add Animation, and under MotionPaths, click Lines. In the Animation group, click Effect Options and under Direction, click Right.In the CustomAnimation task pane, select the third animation effect (right motion path for the rounded rectangle). On the slide, point to the endpoint (red arrow) of the selected motion path until the cursor becomes a two-headed arrow. Press and hold SHIFT, and then drag the endpoint to the 1.75 right vertical drawing guide. On the slide, point to the starting point (green arrow) of the selected motion path until the cursor becomes a two-headed arrow. Press and hold SHIFT, and then drag the starting point to the 0.00 vertical drawing guide. In the Selection and Visibility taskpane, select the rounded rectangle again. In the Advanced Animation group, click Add Animation, and under MotionPaths, click Lines. In the Animation group, click Effect Options and under Direction, click Right.In the CustomAnimation task pane, select the fourth animation effect (right motion path for the rounded rectangle).On the slide, point to the endpoint (red arrow) of the selected motion path until the cursor becomes a two-headed arrow. Press and hold SHIFT, and then drag the endpoint to the 3.50 right vertical drawing guide. On the slide, point to the starting point (green arrow) of the selected motion path until the cursor becomes a two-headed arrow. Press and hold SHIFT, and then drag the starting point to the 1.75 right vertical drawing guide. In the Animation Pane, press and hold down CTRL and select all four animation effects. On the Animations tab, in the Timing group, do the following:In the Start list, select On Click.In the Duration list, enter 01.00.On the View tab, in the Show group, clear Ruler and clear Guides.To reproduce the background effects on this slide, do the following:Right-click the slide background area, and then click Format Background. In the Format Background dialog box, click Fill in the left pane, select Gradient fill in the Fill pane, and then do the following:In the Type list, select Linear.Click the button next to Direction, and then click Linear Up (second row, second option from the left).Under Gradient stops, click Add or Remove until two stops appear on the slider, and customize the gradient stops as follows:Select Stop 1 on the slider, and then do the following:In the Position box, enter 65%.Click the button next to Color, and under Theme Colors, click White, Background 1 (first row, first option from the left).Select Stop 2 on the slider, and then do the following:In the Position box, enter 100%.Click the button next to Color, and under Theme Colors, click Blue, Accent 1, Lighter 60% (third row, fifth option from the left).
عمل ضمنی بین فازهای مپ و ردیوس، عمل گروه بندی-ه توزیع شده روی کلیدهای میانی هست.
Rotating numbers on a curved path(Advanced)Tip: To draw the curved line on this slide, you will need to use the ruler and the drawing guides.To display the ruler and the drawing guides, do the following:On the View tab, in the Show/Hide group, select Ruler. Right-click the slide background area, and then click Grid and Guides. In the Grid and Guides dialog box, under Guide settings, select Display drawing guides on screen. (Note: One horizontal and one vertical guide will display on the slide at 0.00, the default position.)To reproduce the curved line on this slide, do the following:On the Insert tab, in the Illustrations group, click Shapes, and then under Lines click Curve (10th option from the left). To draw the curved line on the slide, do the following:Click the first point 0.25” to the left of the left edge of the slide and 0.75” below the horizontal drawing guide.Click the second point 3” to the left of the vertical drawing guide and 1” above the horizontal drawing guide.Click the third point 1.5” to the right of the vertical drawing guide and 0.5” below the horizontal drawing guide.Double-click the fourth and final point 0.25” to the right of the right edge of the slide and 1.5” above the horizontal drawing guide. Select the curved line. UnderDrawing Tools, on the Format tab, in the Shape Styles group, click Shape Outline, and then do the following: Under Theme Colors,clickWhite, Background 1, Darker 35% (fifth row, first option from the left). Point to Dashes, and then click Square Dot (third option from the top).Point to Weight, and then click 1 ½ pt. To reproduce the “1” on this slide, do the following:On the Home tab, in theSlides group, click Layout, and then click Blank.On the Insert tab, in the Text group, click Text Box, and then on the slide, drag to draw the text box.Enter 1 in the text box, and then select the text. On the Home tab, in the Font group, do the following:In the Font list, select Impact.In the Font Size box, enter 140.On the Home tab, in the Paragraph group, click Align Text Left to align the text left in the text box. Select the text box. Under Drawing Tools, on the Format tab, in the bottom right corner of the WordArt Styles group, click the Format Text Effects dialog box launcher. In the Format Text Effects dialog box, click Text Fill in the left pane, select Gradient fill in the Text Fill pane, and then do the following:In the Type list, select Linear.Click the button next to Direction, and then click Linear Down (first row, second option from the left).Under Gradient stops, click Add gradient stops or Remove gradient stops until two stops appear in the slider.Also under Gradient stops, customize the gradient stops that you added as follows:Select the first stop in the slider, and then do the following:In the Position box, enter 0%.Click the button next to Color, and then under Theme Colors click White, Background 1 (first row, first option from the left).In the Transparency box, enter 50%.Select the last stop in the slider, and then do the following:In the Position box, enter 85%.Click the button next to Color, and then under Theme Colors click White, Background 1 (first row, first option from the left).In the Transparency box, enter 0%.Also in the Format Text Effects dialog box, click Text Outline in the left pane. In the Text Outline pane, select Solid line, click the button next to Color, and then click More Colors. In the Colors dialog box, on the Custom tab, enter values for Red: 49, Green: 133, Blue: 156.Also in the Format Text Effects dialog box, click Outline Style in the left pane. In the Outline Style pane, in the Width box, enter 2.5 pt. Also in the Format Text Effects dialog box, click Shadow in the left pane. In the Shadow pane, click the button next to Presets, under Outer click Offset Diagonal Bottom Left (first row, third option from the left), and then do the following:In the Transparency box, enter 82%.In the Size box, enter 100%.In the Blur box, enter 8 pt.In the Angle box, enter 135°.In the Distance box, enter 30 pt. Also in the Format Text Effects dialog box, click 3-D Rotation in the left pane. In the 3-D Rotation pane, under Rotation, in the Z box, enter 15°.Also in the Format Text Effects dialog box, click Glow and Soft Edges in the left pane, and in the Glow and Soft Edges pane, do the following:In the Size box, enter 8 pt.Click the button next to Color, and then click More Colors. In the Colors dialog box, on the Custom tab, enter values for Red: 29, Green: 199, Blue: 244.Drag the text box onto the left part of the curved line, slightly to the right of the peak of the curve. To reproduce the animation effects for the “1” on this slide, do the following:On the slide, select the text box. On the Animations tab, in the Advanced Animation group, click Add Animation, and then under Entrance, click Fade.Also on the Animations tab, in the Timing group, do the following:In theStart list, selectWith Previous. In the Duration box, enter 1.00.Also on the Animations tab, in the Advanced Animation group, click Add Animation, and then under Emphasis click Spin.Also on the Animations tab, in the Animation group, click the Effect Options dialog box launcher. In the Spin dialog box, do the following:On the Effect tab, under Settings, do the following:In the Amount list, in the Custom box, enter 30°, and then press ENTER.Select Clockwise.Select Auto-Reverse.On the Timing tab, do the following:In theStart list, selectWith Previous. In the Duration list, select 1 seconds (Fast).On the Animations tab, in the Advanced Animation group, click Add Animation, and then click More Motion Paths. In the Add Motion Path dialog box, under Lines & Curves, click Arc Down.Also on the Animations tab, in the Timing group, do the following:In the Start list, select With Previous.In the Duration box, enter 2.00.On the slide, right-click the motion path and then click Edit Points. In Edit Points mode, do the following: Right-click the line and then click Add Point. Repeat until the line has five points.Select the second, third, and fourth points individually. Drag each point so that it is along the dashed curved line. Drag the end point off the right side of the slide. (Note: Click at least 1.5” off the right edge of the slide so that the text and its shadow exit completely.)On the slide, right-click the motion path, and then click Reverse Path Direction.On the View tab, in the Show/Hide group, clear Ruler.Right-click the slide background area, and then click Grid and Guides. In the Grid and Guides dialog box, under Guide settings, clear Display drawing guides on screen. To reproduce the animated “2” on this slide, do the following:Select the first text box. On the Home tab, in the Clipboard group, click the arrow to the right of Copy, and then click Duplicate.Click in the second text box, delete 1, and then enter 2.Select the second text box. UnderDrawing Tools, on the Format tab, in the bottom right corner of the WordArt Styles group, click the FormatTextEffects dialog box launcher. In the Format Text Effects dialog box, click Text Fill in the left pane, select Gradient fill in the Text Fill pane, and then do the following:In the Type list, select Linear.Click the button next to Direction, and then click Linear Down (first row, second option from the left).Under Gradient stops, click Add gradient stop or Remove gradient stop until two stops appear in the slider.Also under Gradient stops, customize the gradient stops that you added as follows:Select the first stop in the slider, and then do the following:In the Position box, enter 0%.Click the button next to Color, and then under Theme Colors click White, Background 1 (first row, first option from the left).In the Transparency box, enter 50%.Select the last stop in the slider, and then do the following:In the Position box, enter 85%.Click the button next to Color, click More Colors, and then in the Colors dialog box, on the Custom tab, enter values for Red: 198, Green: 217, Blue: 241.In the Transparency box, enter 0%.Also in the Format Text Effects dialog box, click Text Outline in the left pane. In the Text Outline pane, select Solid line, click the button next to Color, and then click More Colors. In the Colors dialog box, on the Custom tab, enter values for Red: 228, Green: 108, Blue: 10.Also in the Format Text Effects dialog box, click 3-D Rotation in the left pane. In the 3-D Rotation pane, under Rotation, in the Z box, enter 350°.Also in the Format Text Effects dialog box, click Glow and Soft Edges in the left pane, in the Glow and Soft Edges pane, click the button next to Color, and then click More Colors. In the Colors dialog box, on the Custom tab, enter values for Red: 255, Green: 144, Blue: 4.Drag the second text box onto the curved line, to the right of the “1” text box and approximately in the middle of the slide. On the Animations tab, in the Advanced Animation group, click Animation Pane.Press and hold CTRL, and then in the Animation Pane, select the fourth and fifth animation effects (fade and spin effects for the second text box). On the Animations tab, in the Timing group, do the following:In the Delay box, enter 0.5.In the Duration box, enter 0.9 seconds. In the Animation Pane, select the sixth animation effect (motion path for the second text box). On the Animations tab, in the Timing group, do the following:In the Delay box, enter 0.5.In the Duration box, enter 1.8 seconds. In the Animation Pane, select the sixth animation effect. On the slide, right-click the selected motion path, and then click Edit Points. Drag the points on the path to match the path to the curved line. (Note: The starting point will be further to the right of the right edge of the slide than the starting point for the first motion path.)To reproduce the animated “3” on this slide, do the following:On the slide, select the second text box. On the Home tab, in the Clipboard group, click the arrow to the right of Copy, and then click Duplicate.Drag the third text box away from the second text box.Click in the third text box, delete 2, and then enter 3. Select the third text box. UnderDrawing Tools, on the Format tab, in the bottom right corner of the WordArt Styles group, click the FormatTextEffects dialog box launcher. In the Format Text Effects dialog box, click Text Fill in the left pane, select Gradient fill in the Text Fill pane, and then do the following:In the Type list, select Linear.Click the button next to Direction, and then click Linear Down (first row, second option from the left).Under Gradient stops, click Add gradient stop or Remove gradient stop until two stops appear in the slider.Also under Gradient stops, customize the gradient stops that you added as follows:Select the first stop in the slider, and then do the following:In the Position box, enter 0%.Click the button next to Color, and then under Theme Colors click White, Background 1 (first row, first option from the left).In the Transparency box, enter 50%.Select the last stop in the slider,and then do the following:In the Position box, enter 85%.Click the button next to Color, click More Colors, and then in the Colors dialog box, on the Custom tab, enter values for Red: 198, Green: 217, Blue: 241.In the Transparency box, enter 0%.Also in the Format Text Effects dialog box, click Text Outline in the left pane. In the Text Outline pane, select Solid line, click the button next to Color, and then click More Colors. In the Colors dialog box, on the Custom tab, enter values for Red: 119, Green: 147, Blue: 60.Also in the Format Text Effects dialog box, click 3-D Rotation in the left pane. In the 3-D Rotation pane, under Rotation, in the Z box, enter 5°.Also in the Format Text Effects dialog box, click Glow and Soft Edges in the left pane, and in the Glow and Soft Edges pane, under Glow, click the button next to Color, and then click More Colors. In the Colors dialog box, on the Custom tab, enter values for Red: 168, Green: 224, Blue: 52.Drag the third text box to the right of the second text box, above the curve.In the Animation Pane, select the seventh animation effect (fade effect for the third text box). On the Animations tab, in the Timing group, do the following:In the Delay box, enter 0.9.In the Duration box, enter 0.7 seconds. In the Animation Pane, select the eighth animation effect (spin effect for the third text box). On the Animations tab, in the Timing group, do the following:In the Delay box, enter 0.9.In the Duration box, enter 0.75 seconds. In the Animation Pane, select the ninth animation effect (motion path for the third text box). On the Animations tab, in the Timing group, do the following:In the Delay box, enter 0.9.In the Duration box, enter 1.5 seconds. In the Animation Pane, select the ninth animation effect (motion path for the third text box). On the slide, right-click the selected motion path, and then click Edit Points. Drag the points on the path to match the path to the curved line. (Note: The endpoint will be above the curved line and the path will eventually meet the curve. The starting point will be further to the right of the right edge of the slide than the starting point for the first motion path.)To reproduce the background on this slide, do the following: Right-click the slide background area, and then click Format Background. In the Format Background dialog box, click Fill in the left pane, select Gradient fill in the Fill pane, and then do the following:In the Type list, select Radial.Click the button next to Direction, and then click From Corner (fifth option from the left).Under Gradient stops, click Add gradient stop or Remove gradient stop until two stops appear in the slider.Also under Gradient stops, customize the gradient stops that you added as follows:Select the first stop in the slider, and then do the following:In the Position box, enter 0%.Click the button next to Color, and then under Theme Colors click White, Background 1 (first row, first option from the left).Select the last stop in the slider, and then do the following: In the Position box, enter 100%.Click the button next to Color, and then under Theme Colors click White, Background 1, Darker 35% (fifth row, first option from the left).