Download to read offline
![Measurement of National Output
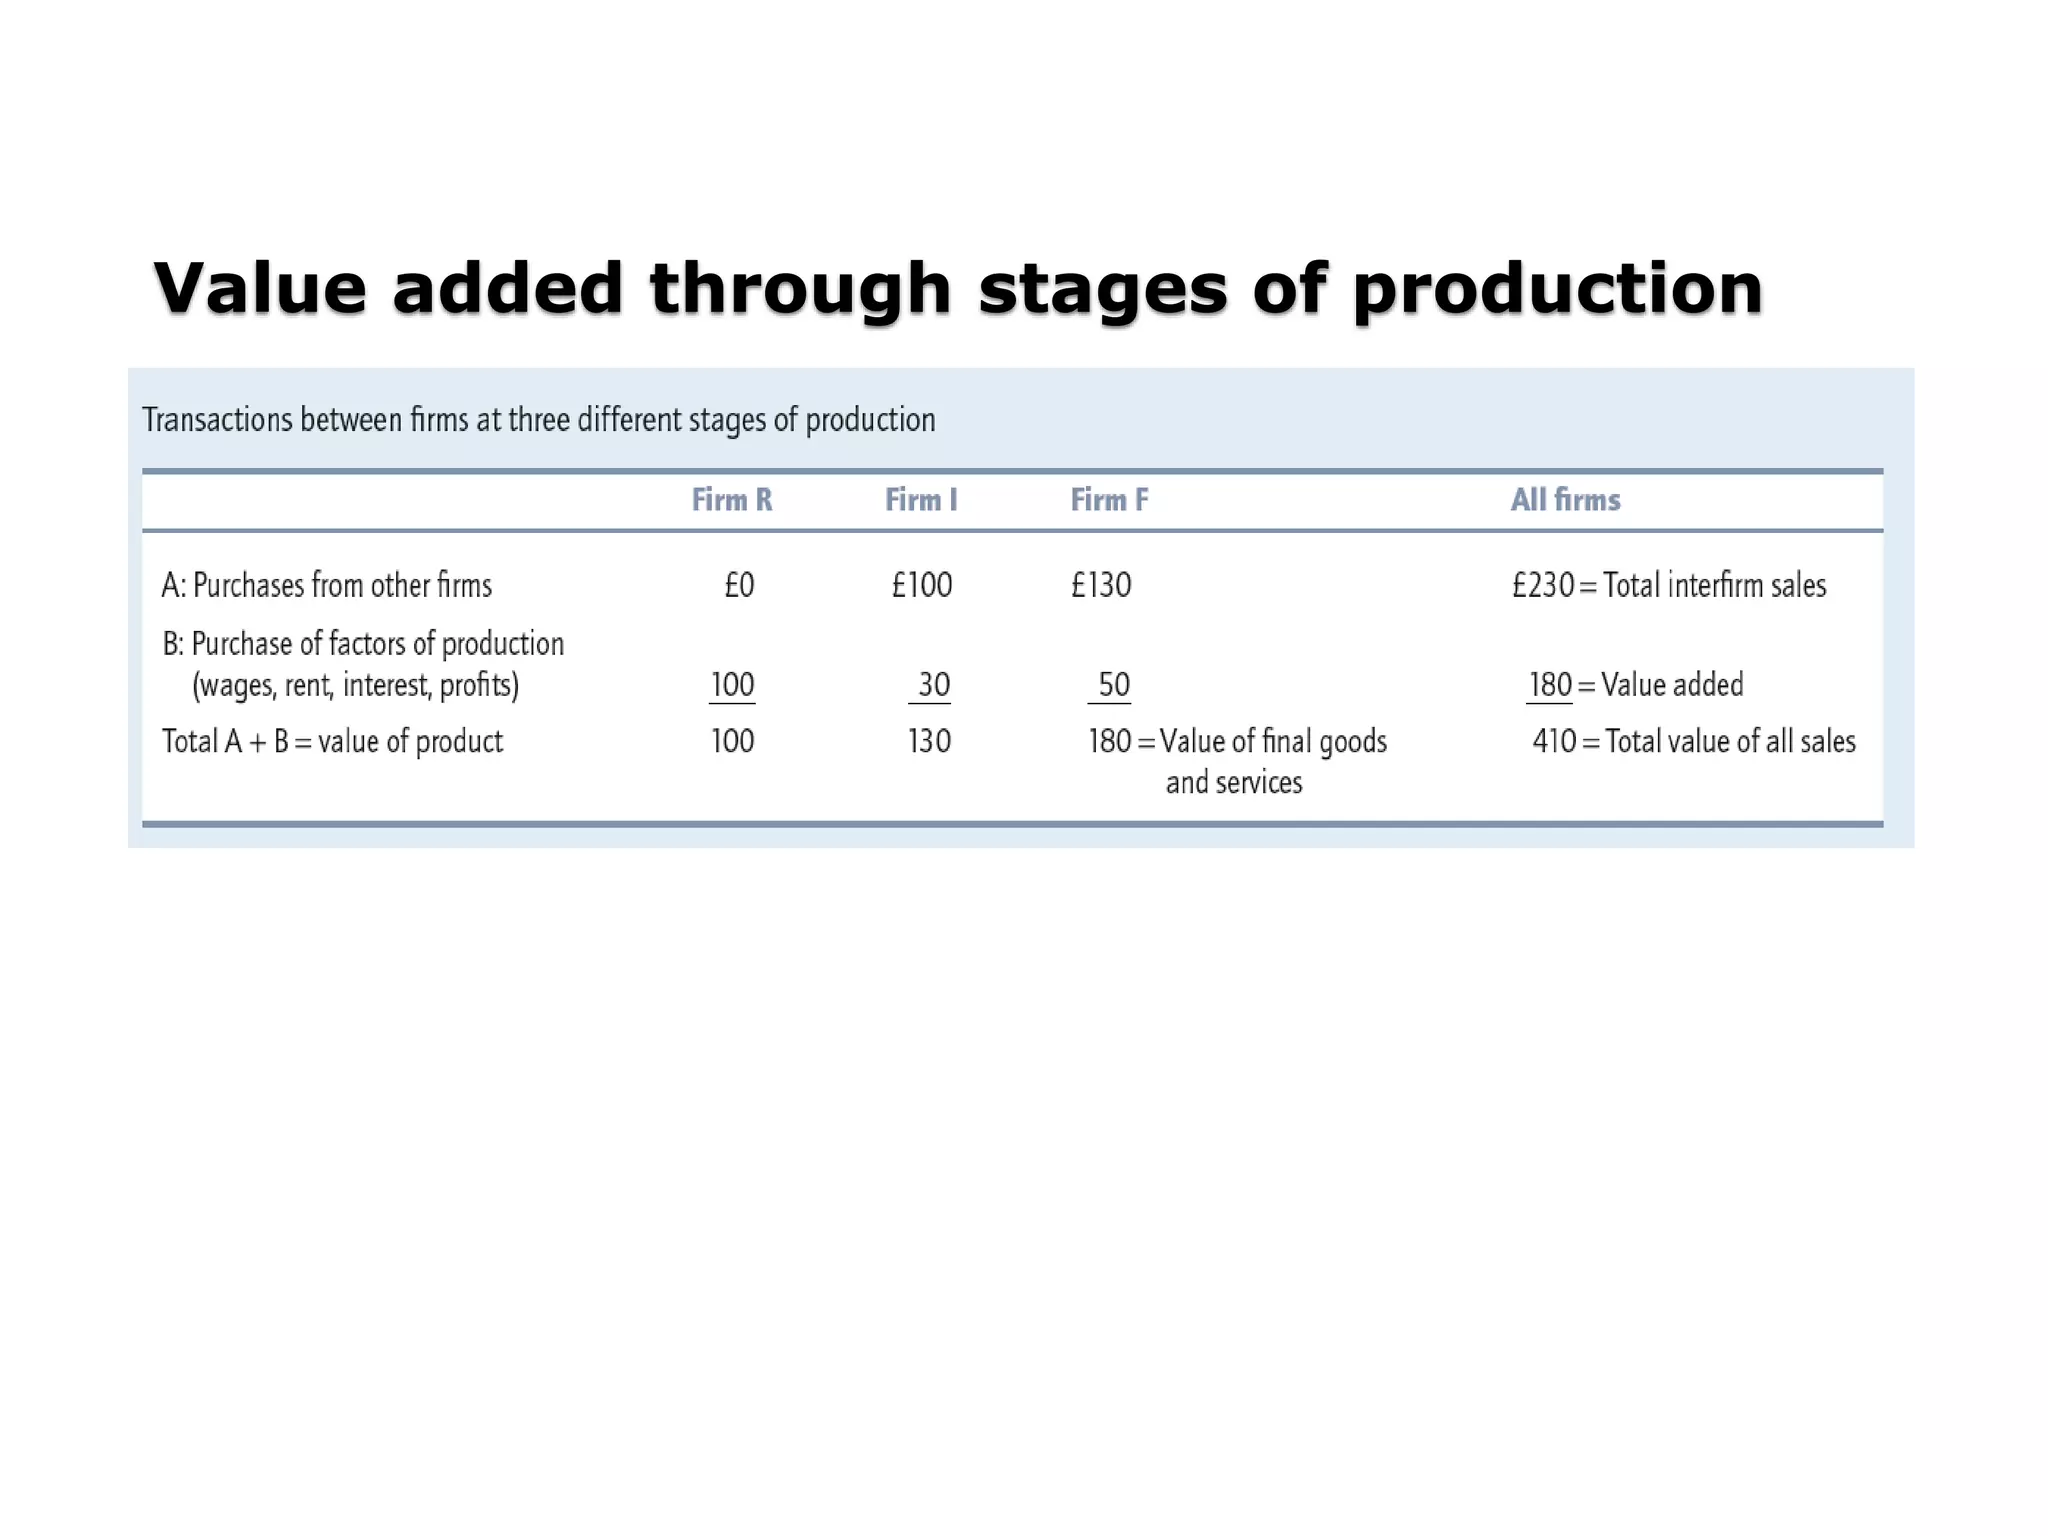
Goods that count as part of the economy’s output
are called final goods; all others are called
intermediate goods.
The sum of all the values added produced in an
economy is called gross value added at basic
prices. Basic prices are the prices received by
producers net of taxes on products [plus
subsidies].
INTRODUCTION - MACROECONOMIC ISSUES AND
MEASUREMENT](https://image.slidesharecdn.com/1macroeconomicissuesandmeasurement-210328121753/75/Macroeconomic-issues-and-measurement-9-2048.jpg)
![GDP, GNI, and GNP
Gross domestic product, [GDP] can be calculated
in three different ways:
◦ [1] as the sum of all values added by all producers of both
intermediate and final goods
◦ [2] as the income claims generated by the total production
of goods and services; and
◦ [3] as the expenditure needed to purchase all final goods
and services produced during the period.
INTRODUCTION - MACROECONOMIC ISSUES AND
MEASUREMENT](https://image.slidesharecdn.com/1macroeconomicissuesandmeasurement-210328121753/75/Macroeconomic-issues-and-measurement-16-2048.jpg)
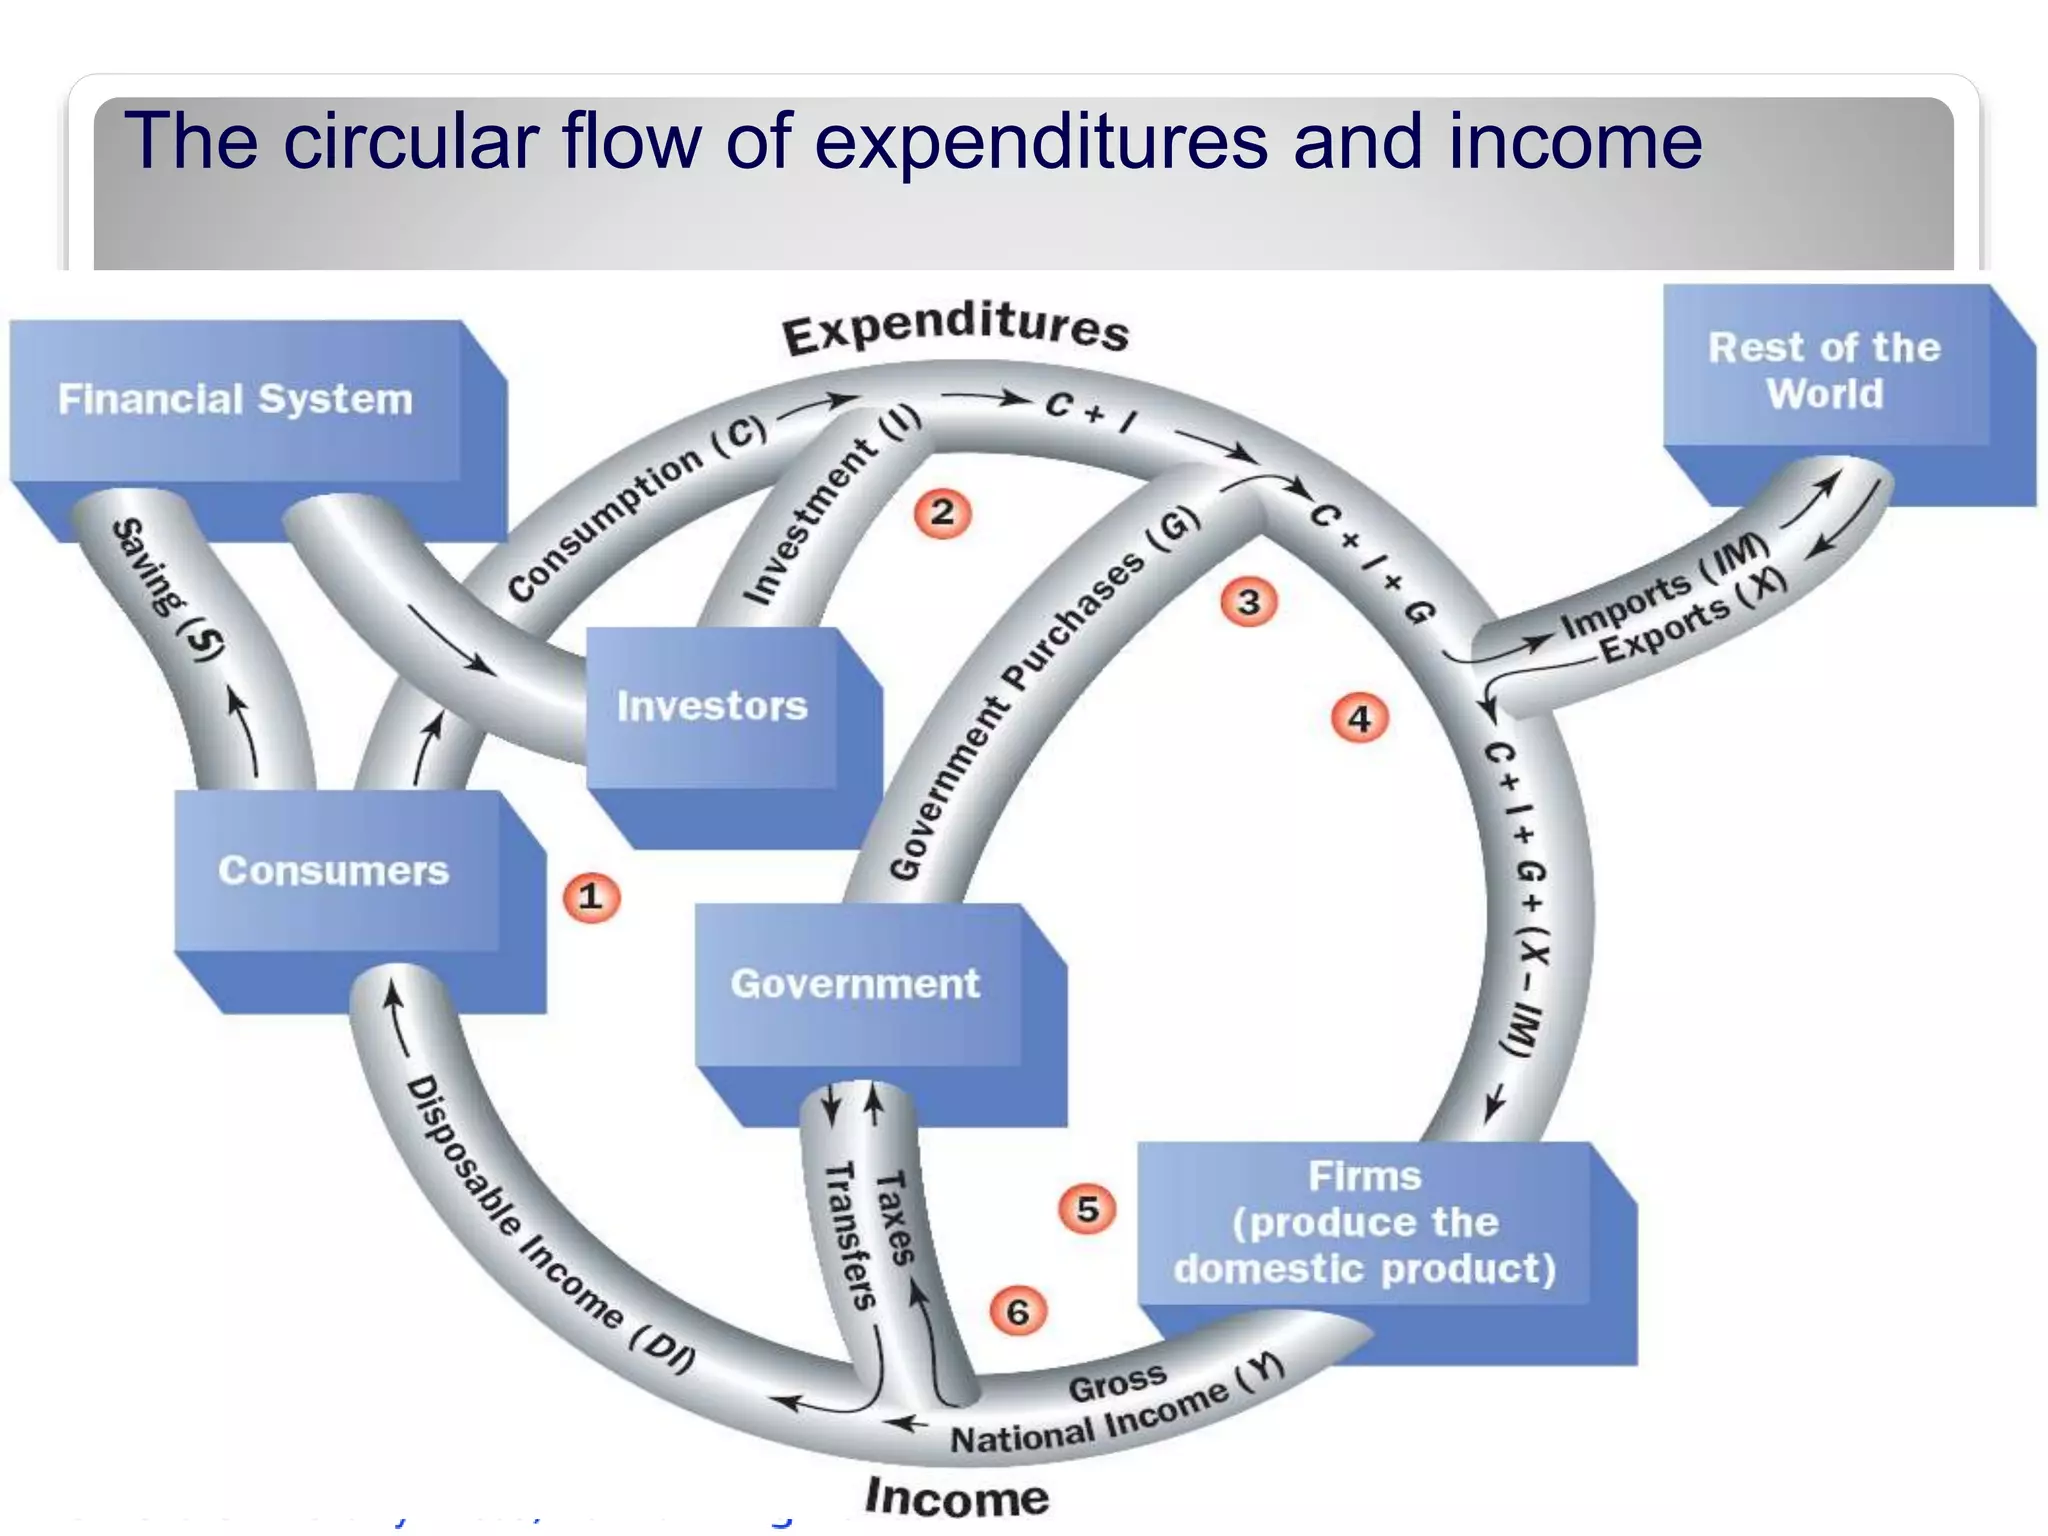
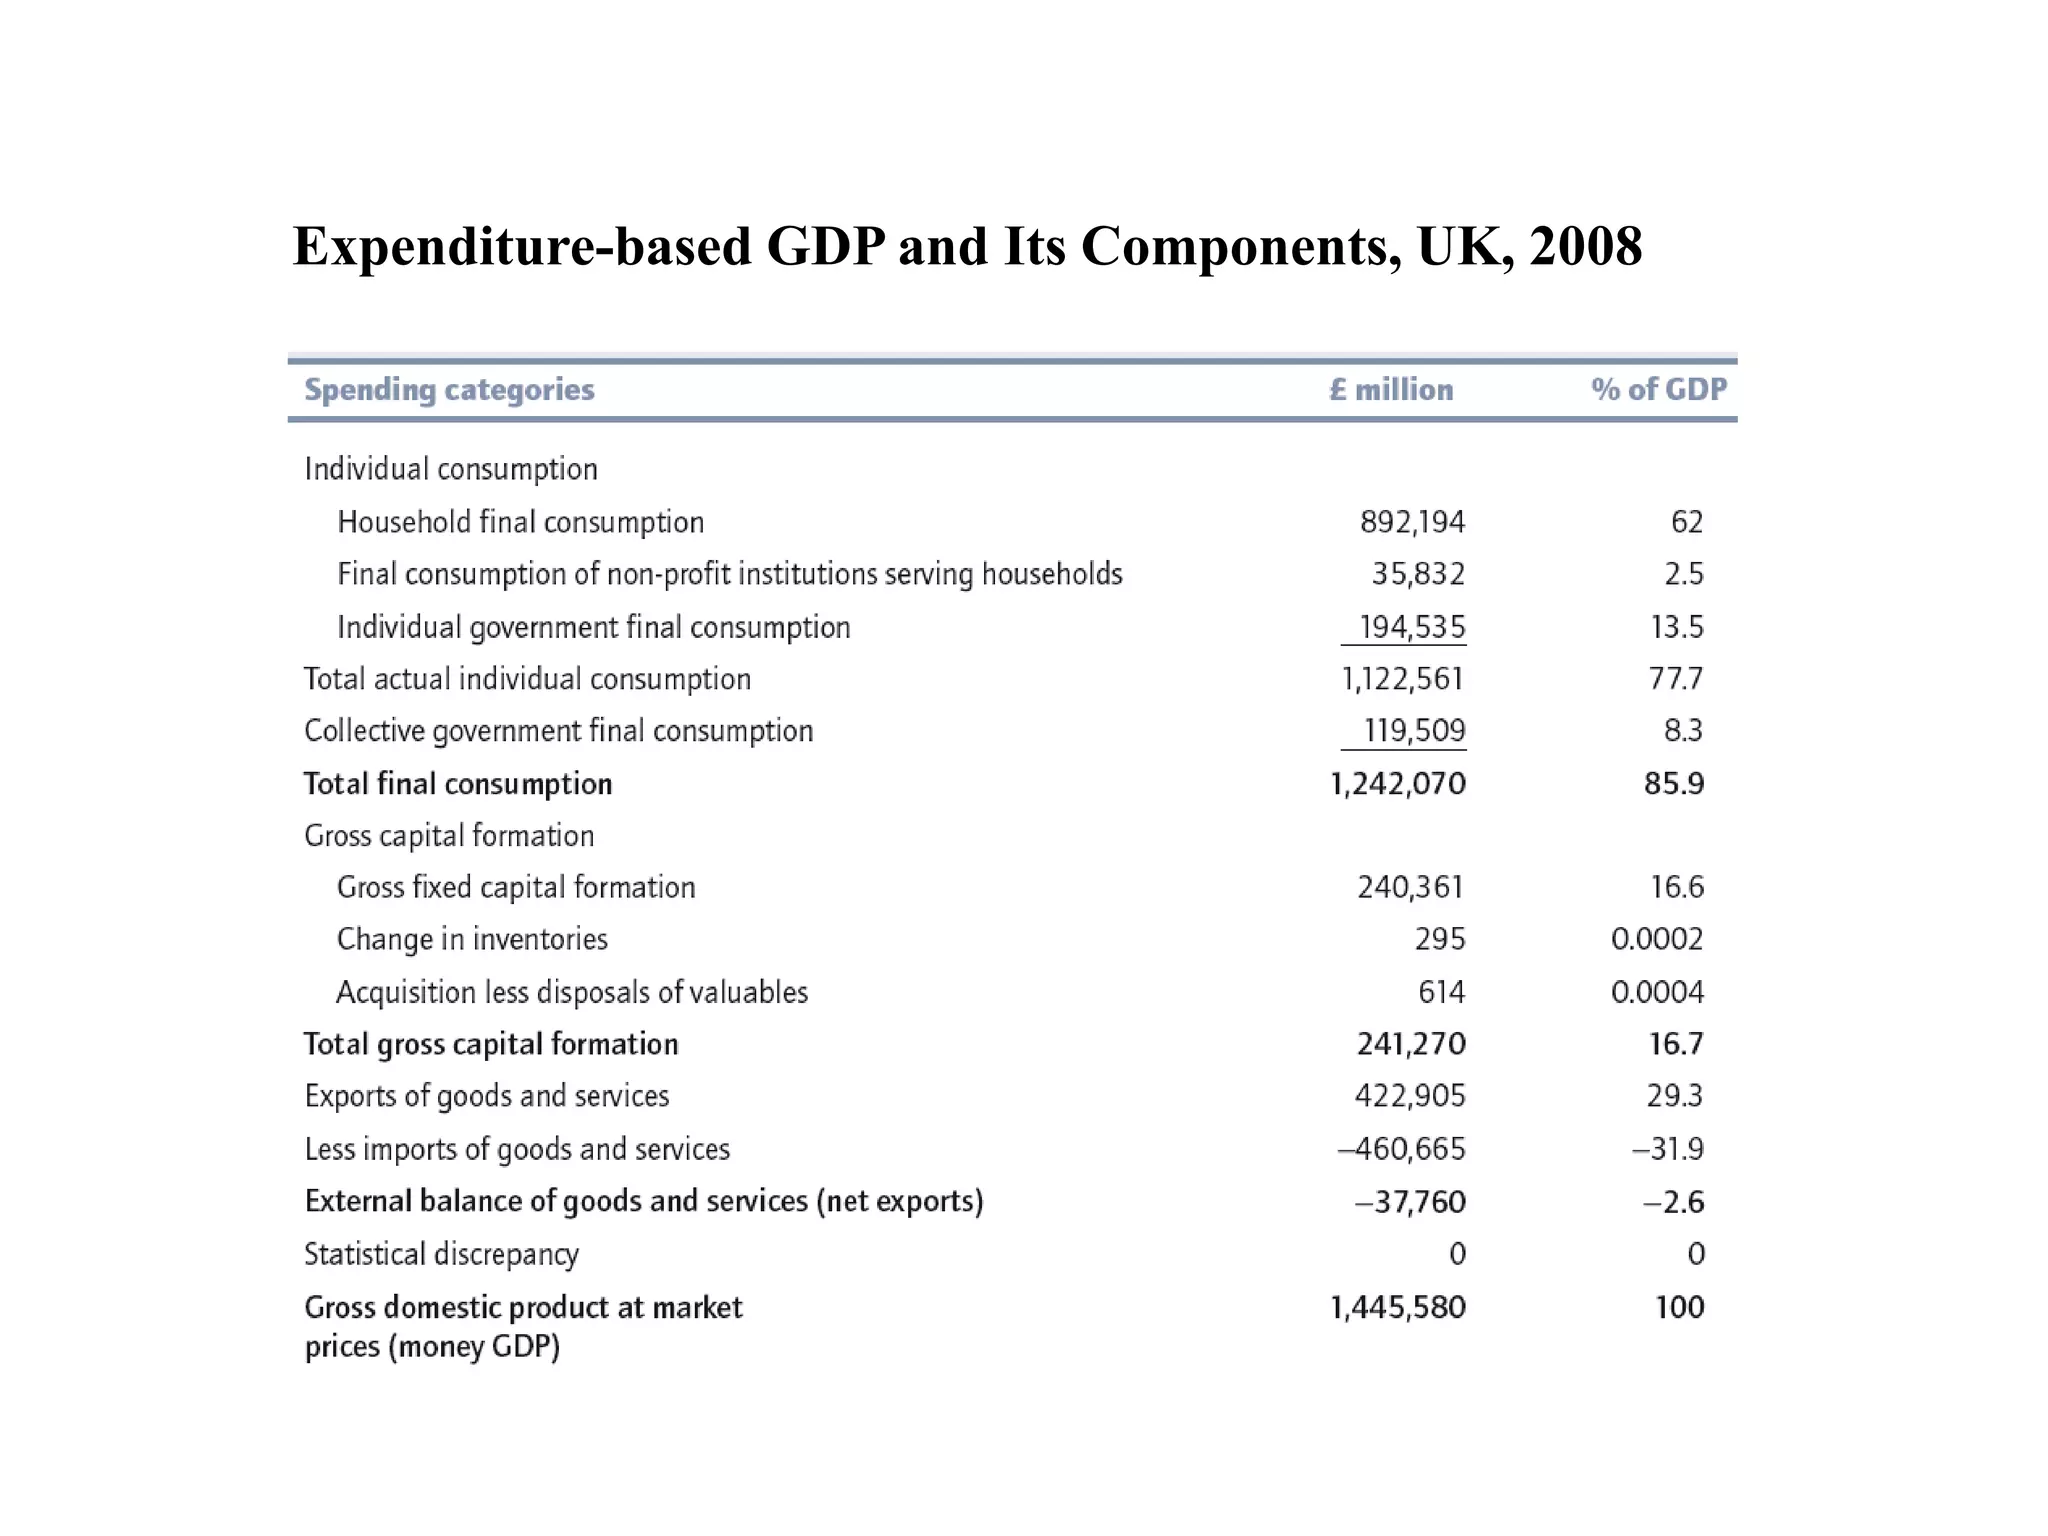
![ From the expenditure side of the national
accounts GDP = Ca + Ia + Ga + [Xa - Ima].
Ca comprises private consumption expenditures.
Ia is investment in fixed capital [including
residential construction], inventories, and
valuables (jewellery, art etc).
Gross investment can be split into replacement
investment [necessary to keep the stock of capital
intact] and net investment [net additions to the
stock of capital].
Ga is government consumption. [Xa -IMa]
represents net exports, or exports minus imports;
it will be negative if imports exceed exports.
INTRODUCTION - MACROECONOMIC ISSUES AND
MEASUREMENT](https://image.slidesharecdn.com/1macroeconomicissuesandmeasurement-210328121753/75/Macroeconomic-issues-and-measurement-17-2048.jpg)
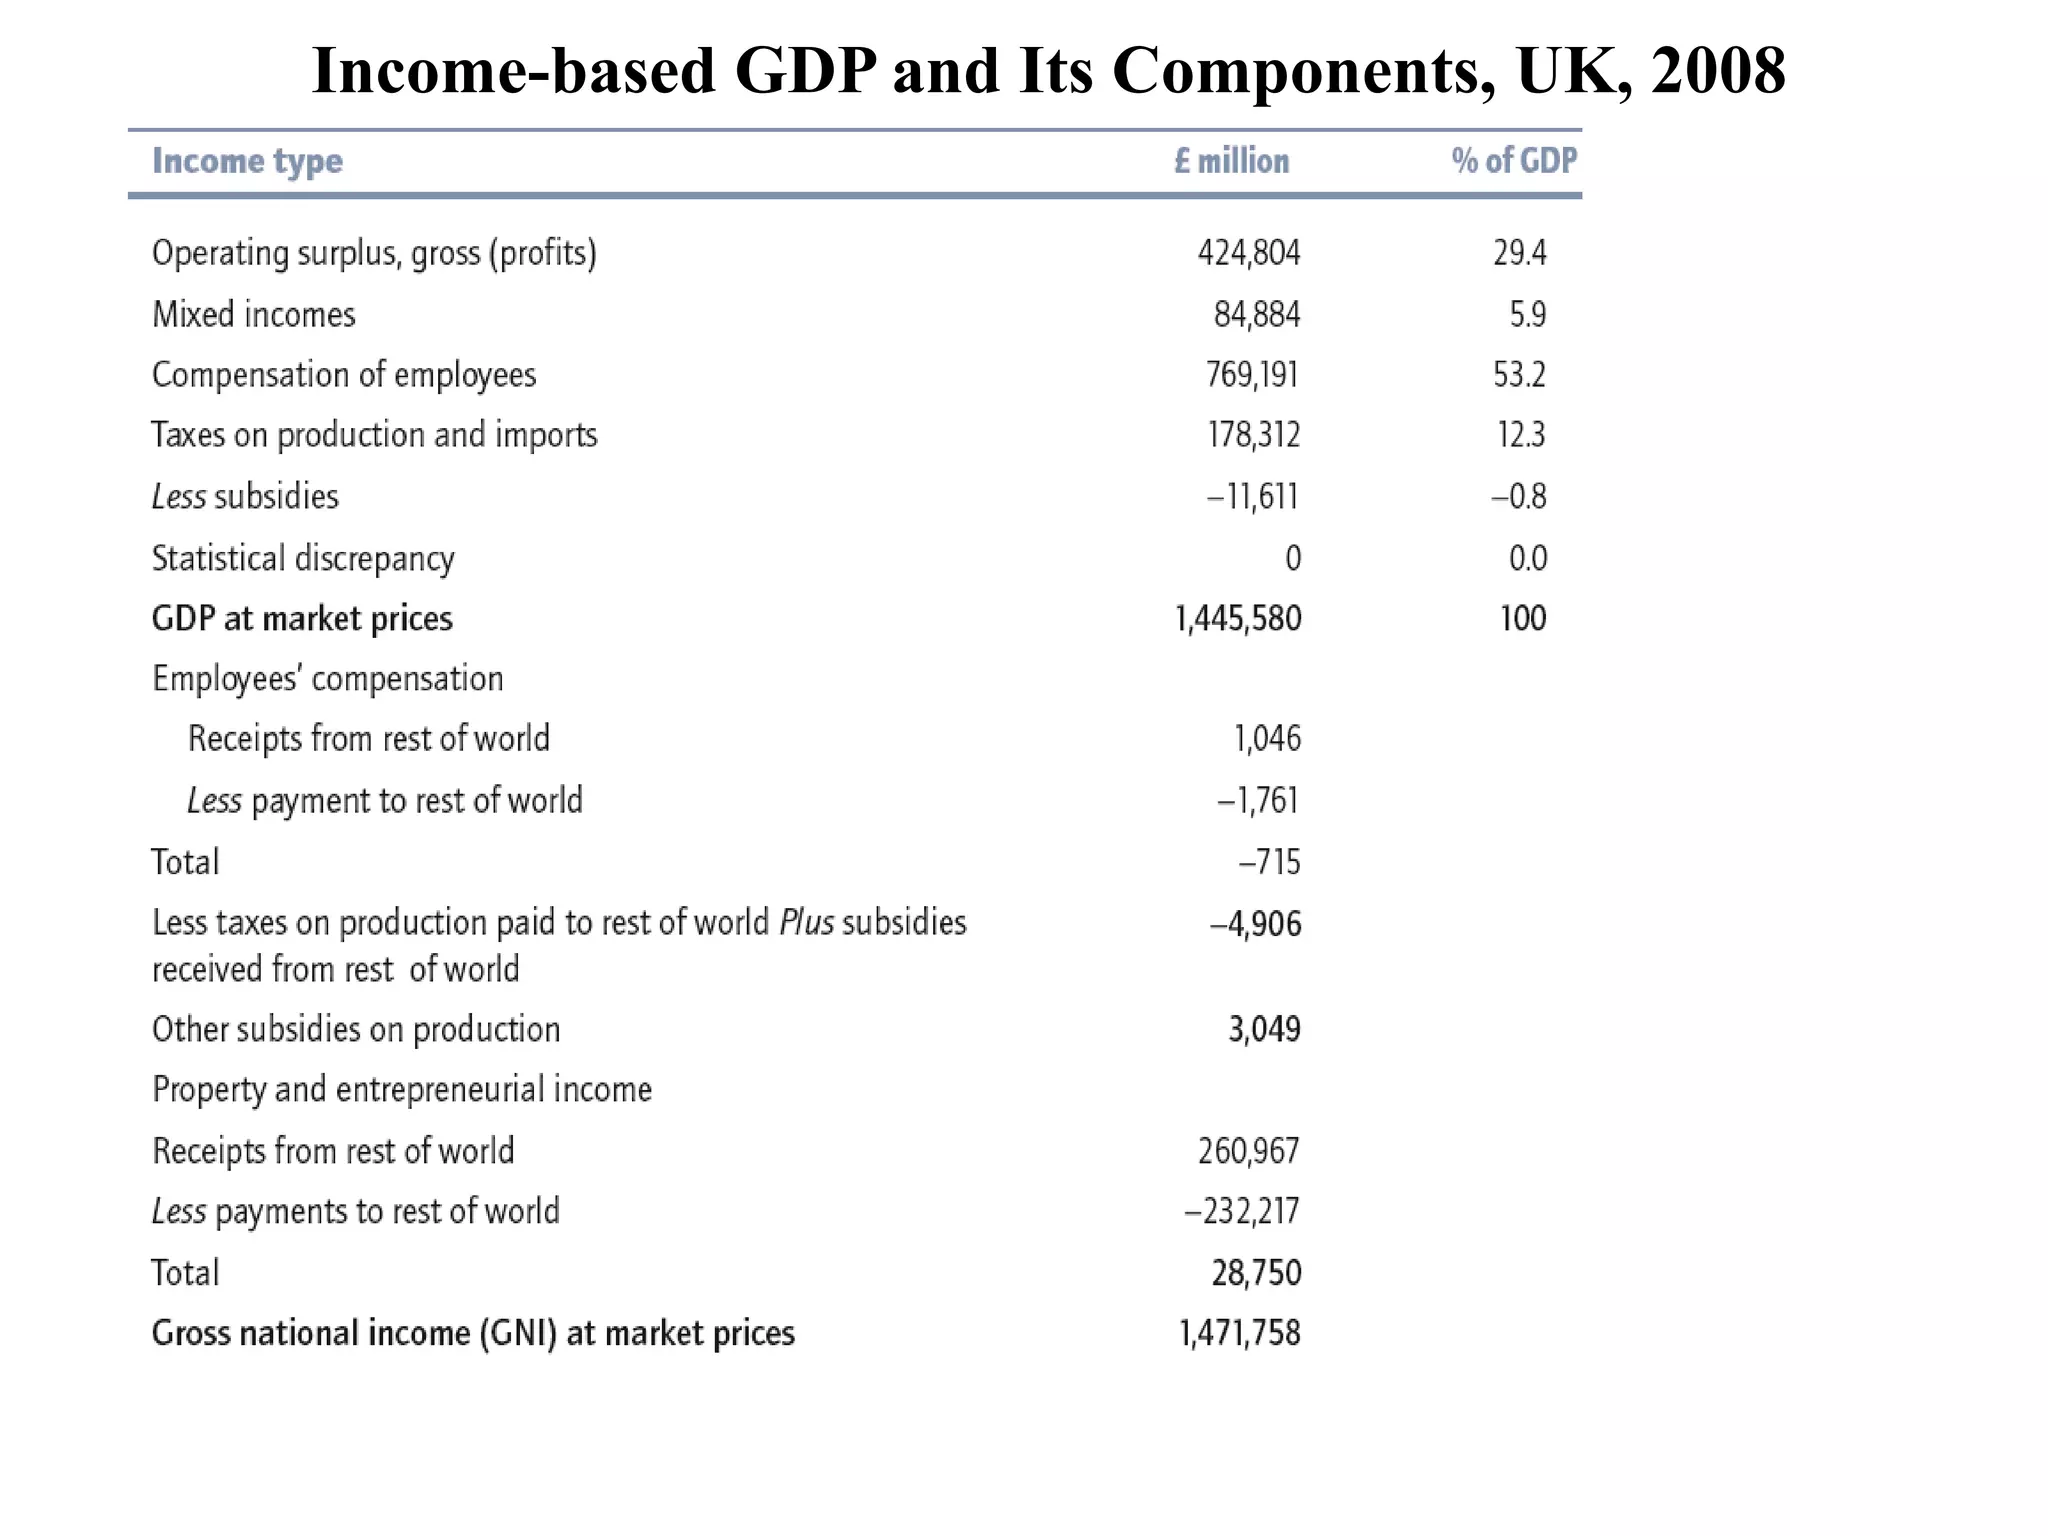
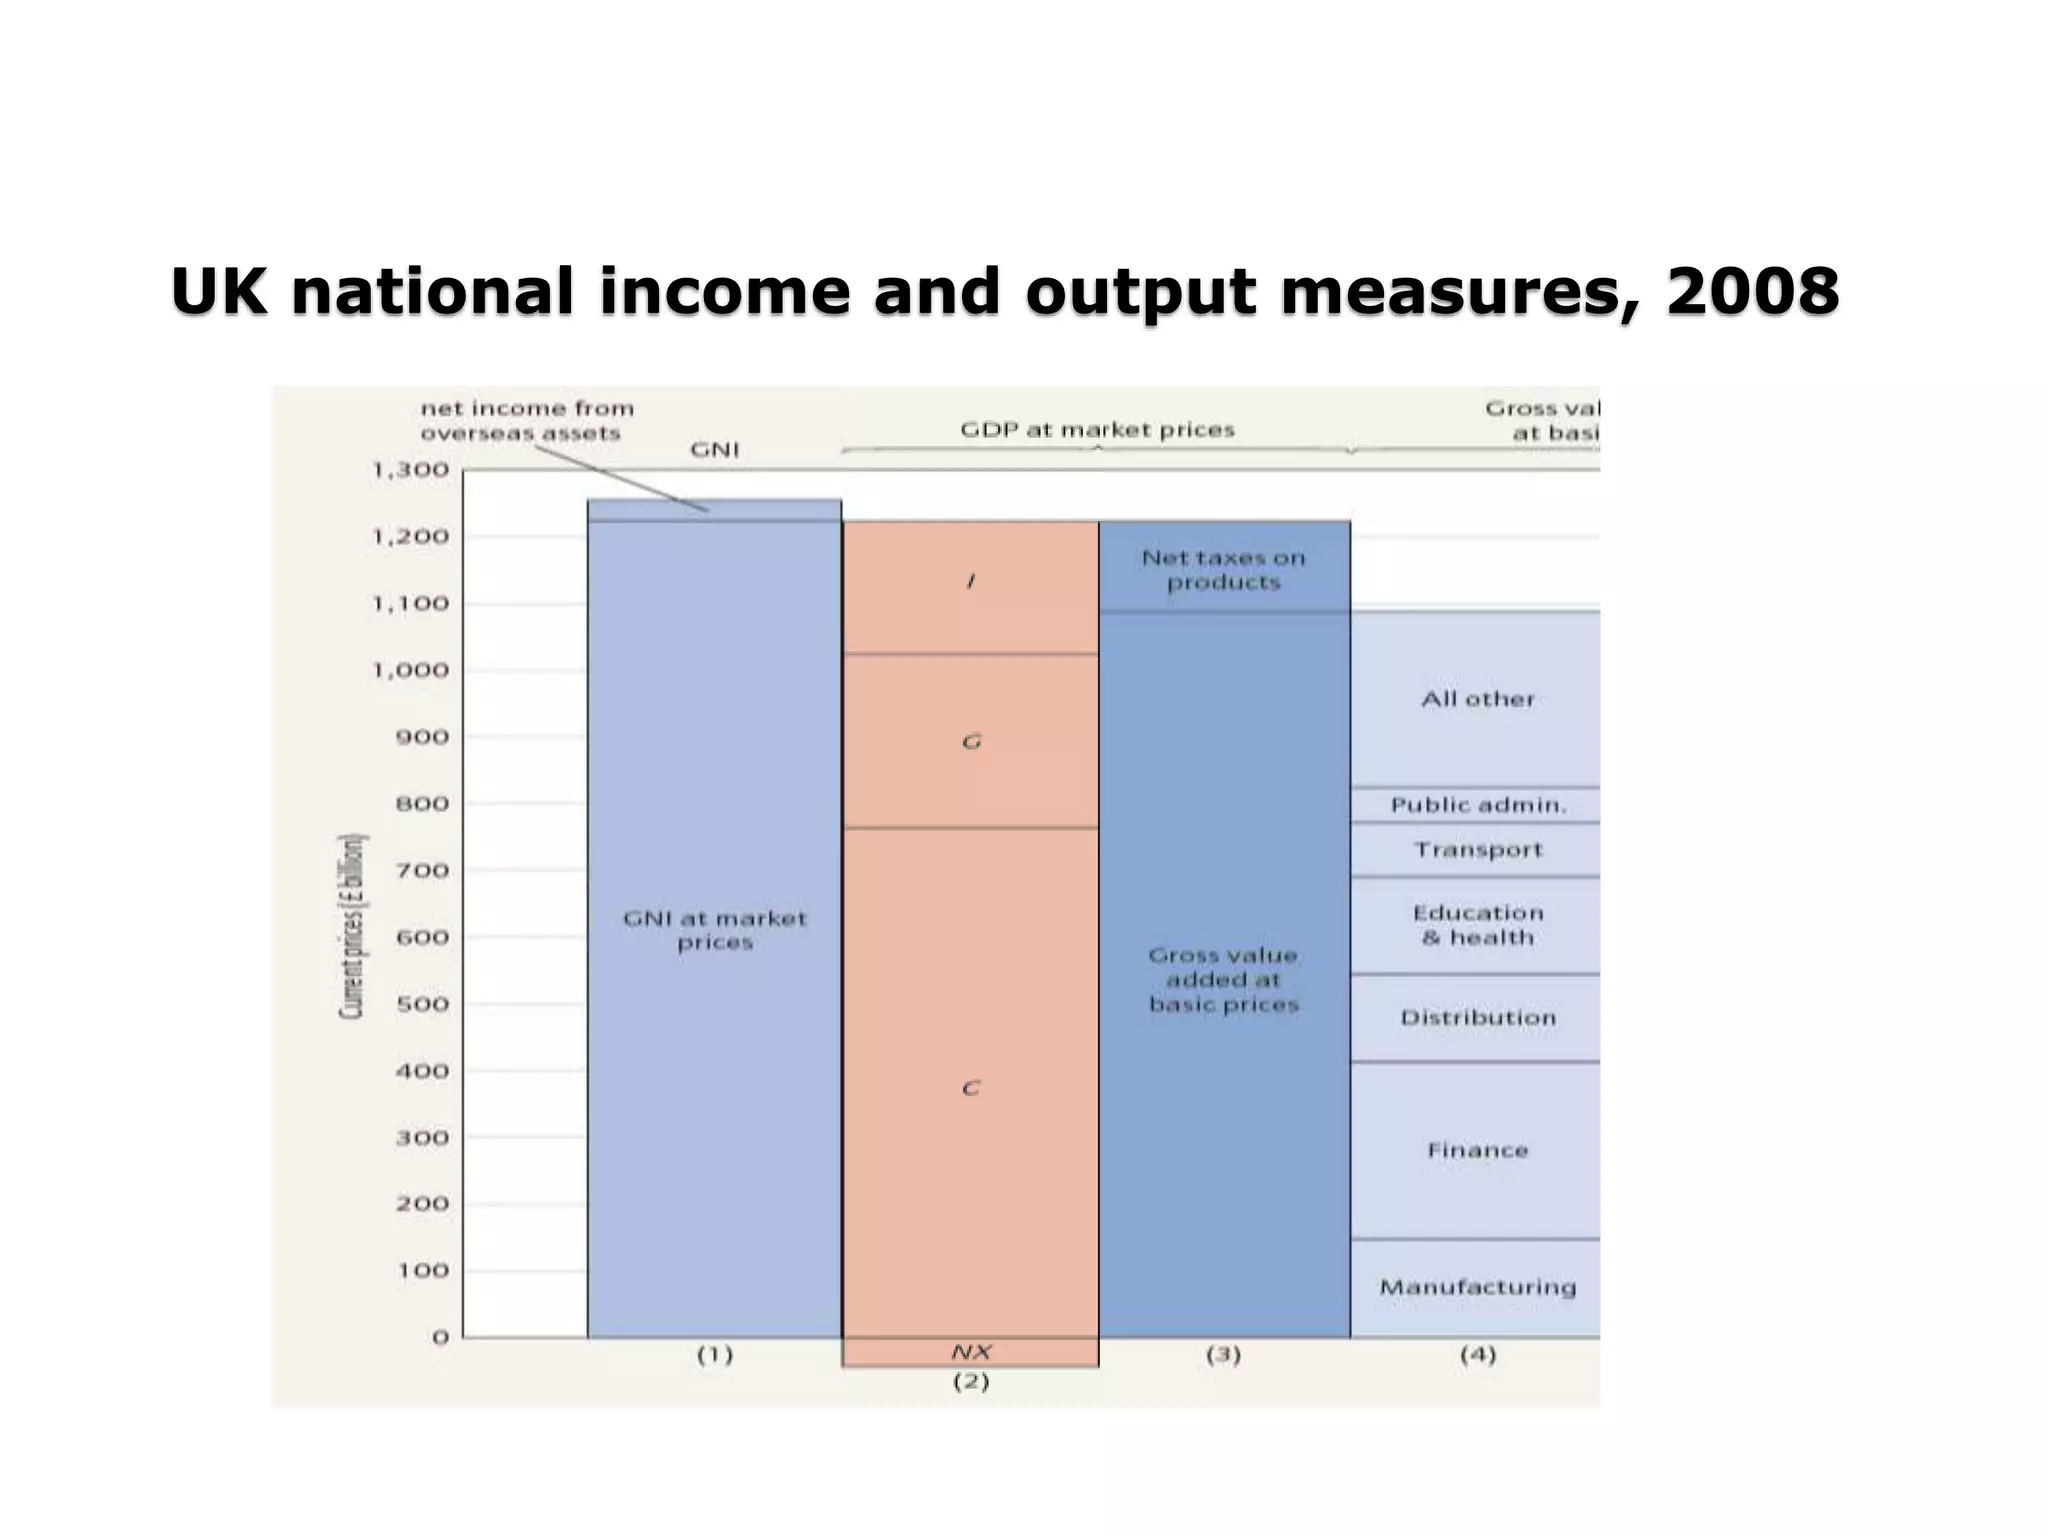
![ Compensation of employees is the payment for
the services of labor inclusive of net salary, taxes
withheld and other deductions made for pension
etc ie wages are measured gross.
UK GDP measures production that is located in
the United kingdom, and UK gross national
income [GNI] measures income accruing to UK
residents.
The difference is due to net income from abroad.
GNI is the same thing as what used to be called
gross national product [GNP].
INTRODUCTION - MACROECONOMIC ISSUES AND
MEASUREMENT](https://image.slidesharecdn.com/1macroeconomicissuesandmeasurement-210328121753/75/Macroeconomic-issues-and-measurement-19-2048.jpg)

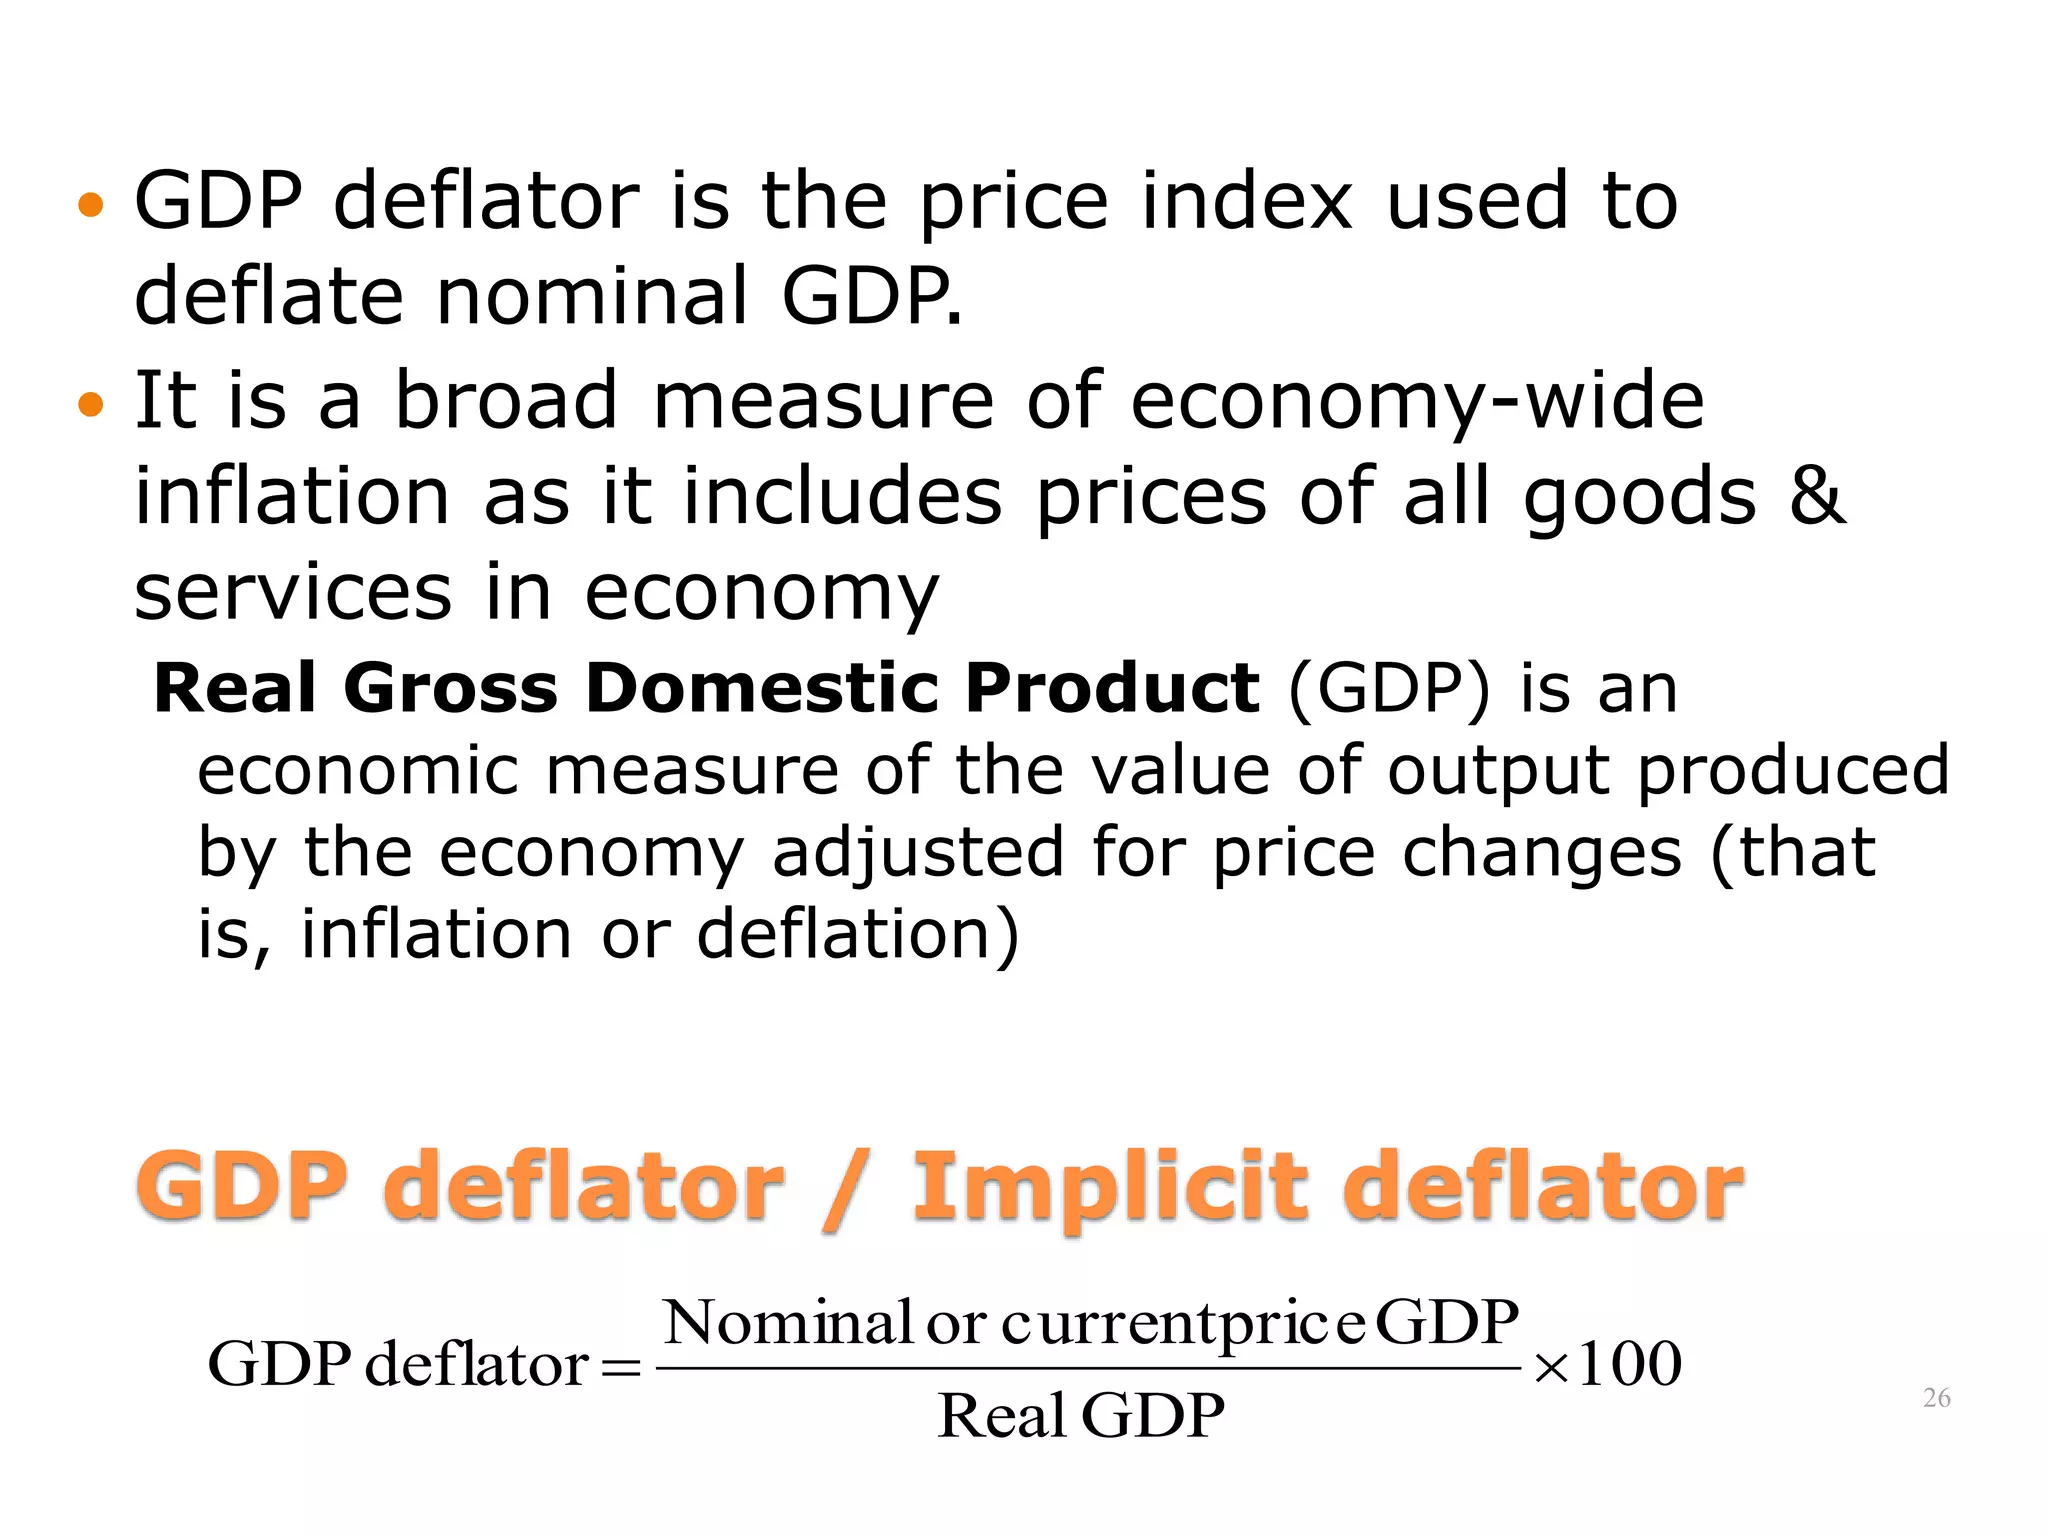
![ Real GDP is calculated to reflect changes in real
volumes of output and real income.
Nominal GDP reflects changes in both prices and
quantities.
Any change in nominal GDP [or GNI] can be split
into a change in real GDP and a change due to
prices.
INTRODUCTION - MACROECONOMIC ISSUES AND
MEASUREMENT](https://image.slidesharecdn.com/1macroeconomicissuesandmeasurement-210328121753/75/Macroeconomic-issues-and-measurement-25-2048.jpg)

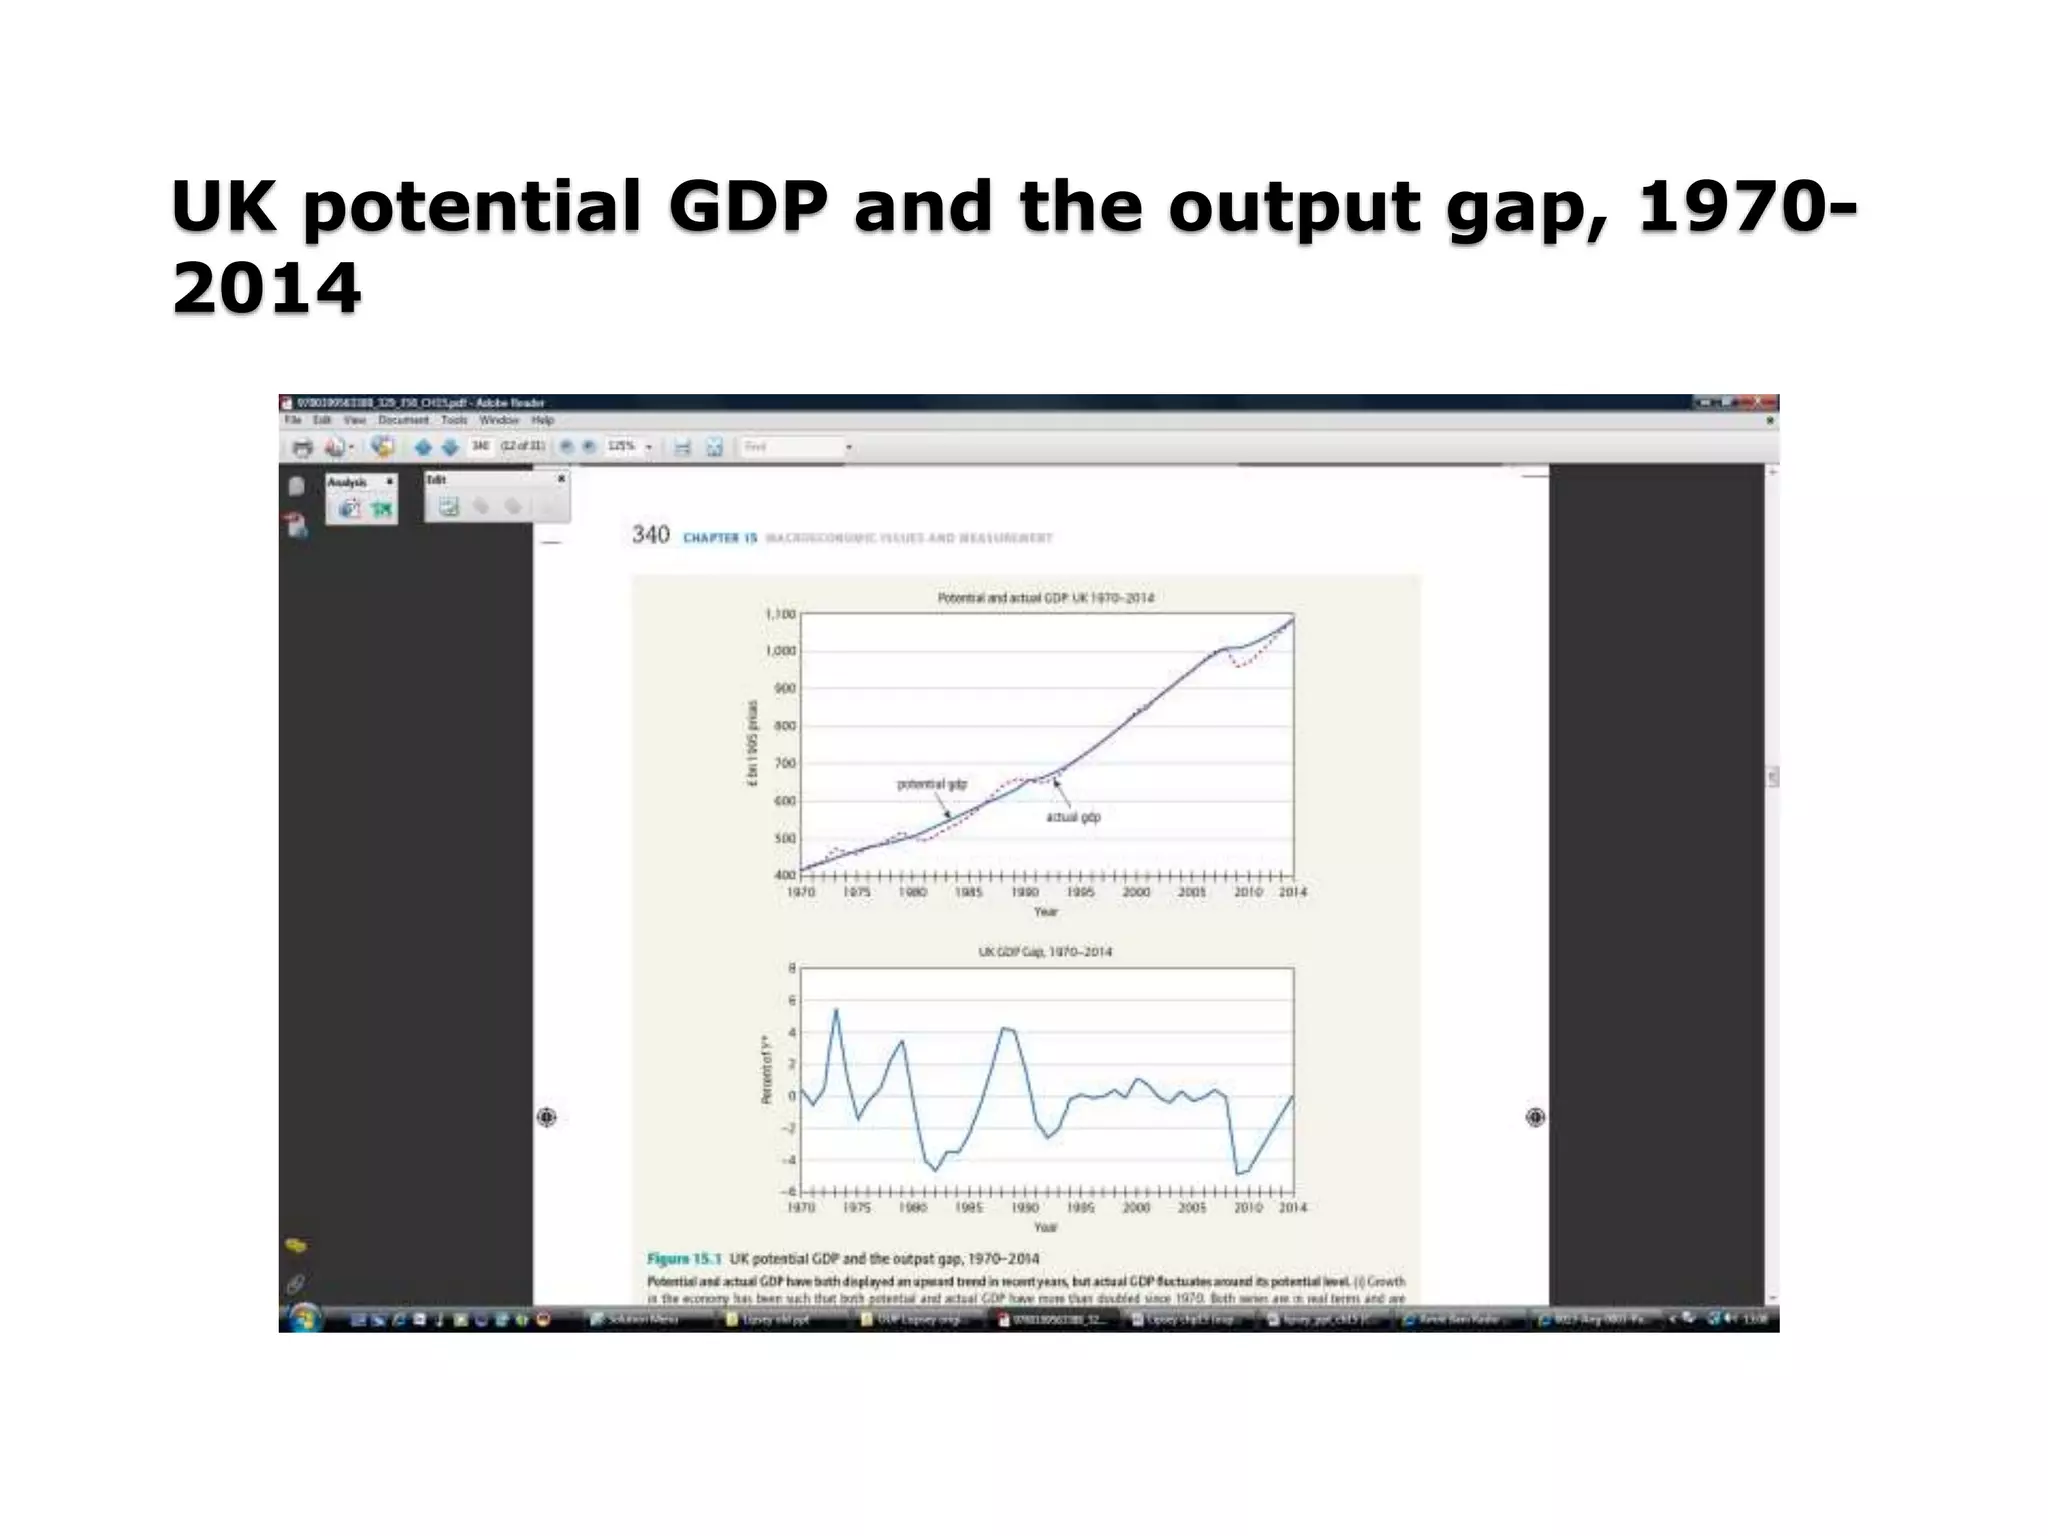


This document discusses key macroeconomic concepts and measurement including: - GDP can be measured as the sum of value added by all producers, as the sum of income claims generated in production, or as the spending on final goods and services. - GDP measures domestic production while GNI measures income earned by a country's residents, including income from overseas. - Potential GDP is the level of output if the economy was at full employment, and the GDP gap is the difference between actual and potential GDP.