The document outlines key concepts in macroeconomics, such as objectives, basic economic problems, national income accounting, and GDP measurement methods. It emphasizes the importance of trade, the significance of understanding business cycles, unemployment, and inflation, and critiques GDP as a measure of economic well-being. Additionally, it explores different methods for calculating GDP, including nominal vs. real GDP, and presents the limitations of GDP as a reflection of quality of life.

![The Basic Problems in Macro-
economics:
Business cycle
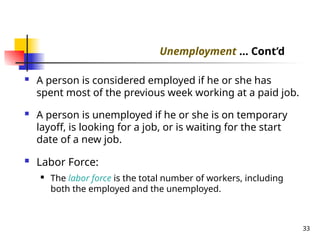
Unemployment
Inflation
Budget deficit
Balance of Payment (BoP) deficit [Trade &
Current account balances, Foreign investment, Borrowings &
repayment]
Income distribution 4](https://image.slidesharecdn.com/partiii-macroecoomics-241021190244-7017a8f3/85/Part-III-Macroecoomics-pptxPart-III-Macroecoomics-pptx-4-320.jpg)