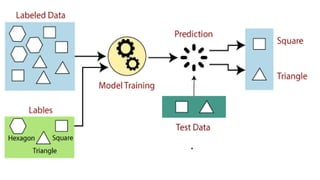
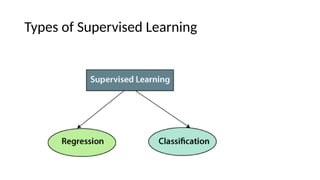
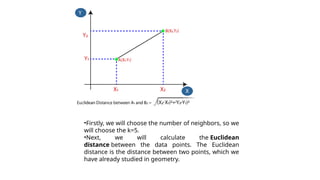
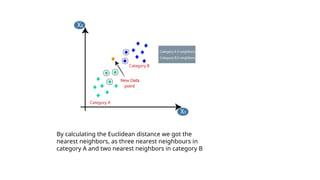
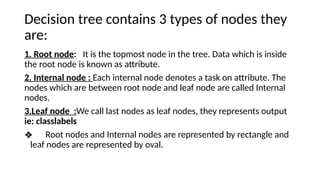
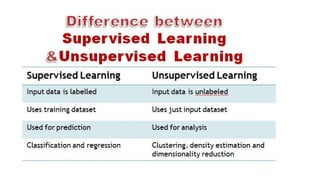
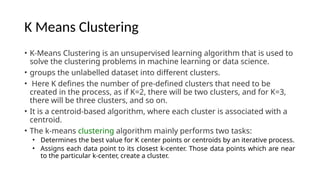
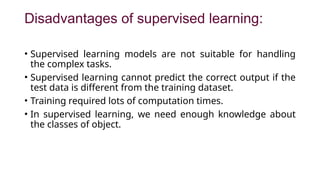
Module 3
Machine Learning & AI
Data
• Data is a crucial component in the field of Machine Learning.
• It refers to the set of observations or measurements that can be used to train a machine-learning
model.
• Data is the most important part of all Data Analytics, Machine Learning, and Artificial
Intelligence.
• Without data, we can’t train any model and all modern research and automation will go
in vain.
• Big Enterprises are spending lots of money just to gather as much certain data as
possible.
• The quality and quantity of data available for training and testing play a significant role in determining
the performance of a machine-learning model.
• Machine learning algorithms use data to learn patterns and relationships between input variables and
target outputs
• Then it can be used for prediction or classification tasks.
• Data is typically divided into two types:
• Labeled data
• Un labeled data
• Labeled data includes a label or target variable that the
model is trying to predict.(Used in supervised learning)
• Unlabeled data does not include a label or target
variable(Used in unsupervised Learning)
MACHINE Learning(ml)
• Machine Learning (ML) is an automated learning with little or no
human intervention.
• It involves programming computers so that they learn from the
available inputs.
• The main purpose of machine learning is to explore and construct
algorithms that can learn from the previous data and make
predictions on new input data.
• Learn from experience.
Machine Learning Classification
1. Supervised Learning
2. Un Supervised Learning
Labelled Datasets & Supervised Learning
• Supervised learning uses labelled datasets in algorithms to
classify data and predict outcomes.
• Supervised learning is used in most software applications
these days; these include text processes and image
recognition.
• It also helps companies solve real-world problems, such as
classifying tope leads, customers about to cancel your
service and separating spam in your email inbox.
Types of Supervised Learning
Type 1.Regression algorithms
• Regression algorithms are used if there is a relationship
between the input variable and the output variable.
• It is used for the prediction of continuous variables, such as
Weather forecasting, Market Trends, etc.
• Stock market analysis
• Demand forecasting
• Rainfall quantity prediction
Examples of Regression algorithms
• Linear Regression
• Regression Trees
• Non-Linear Regression
Linear Regression
• Linear regression analysis is used to predict the value of a
variable based on the value of another variable.
• The variable you want to predict is called the dependent
variable.
• The variable you are using to predict the other variable's value
is called the independent variable.
• Equation: y=mx+b
Linear Regression in real life-Prediction of
landprice
Linear Regression in real life-Prediction of
landprice
Linear Regression in real life-Prediction of
landprice
Type 2: Classification
• Classification algorithms are used when the output variable
is categorical, which means there are two classes such as
Yes-No, Male-Female, True-false, etc.
• Spam Filtering,
• Random Forest
• Decision Trees
• Logistic Regression
• Support vector Machines
Classification Problems
Classification Algorithms
1. Logistic Regression
• Logistic Regression is a classification technique used in
machine learning.
• It uses a logistic function to model the dependent variable.
• The dependent variable is dichotomous in nature, i.e. there
could only be two possible classes (eg.: either the cancer is
malignant or not).
• Works on sigmoid function
2. K Nearest Neighbour(KNN)
• K-Nearest Neighbour is one of the simplest Machine Learning
algorithms based on Supervised Learning technique.
• K-NN algorithm assumes the similarity between the new case/data
and available cases and put the new case into the category that is
most similar to the available categories.
• K-NN algorithm stores all the available data and classifies a new
data point based on the similarity. This means when new data
appears then it can be easily classified into a well suite category by
using K- NN algorithm.
• K-NN algorithm can be used for Regression as well as for
Classification but mostly it is used for the Classification problems.
KNN
KNN-Working
• The K-NN working can be explained on the basis of the below
algorithm:
• Step-1: Select the number K of the neighbors
• Step-2: Calculate the Euclidean distance of K number of neighbors
• Step-3: Take the K nearest neighbors as per the calculated Euclidean
distance.
• Step-4: Among these k neighbors, count the number of the data points
in each category.
• Step-5: Assign the new data points to that category for which the
number of the neighbor is maximum.
• Step-6: Our model is ready.
•Firstly, we will choose the number of neighbors, so we
will choose the k=5.
•Next, we will calculate the Euclidean
distance between the data points. The Euclidean
distance is the distance between two points, which we
have already studied in geometry.
By calculating the Euclidean distance we got the
nearest neighbors, as three nearest neighbours in
category A and two nearest neighbors in category B
3.Decision Tree
• Decision Tree algorithm falls under the category of supervised
learning.
• They can be used to solve both regression and classification problem.
• It is a tree that helps us in decision making purposes.
Decision tree contains 3 types of nodes they
are:
1. Root node: It is the topmost node in the tree. Data which is inside
the root node is known as attribute.
2. Internal node : Each internal node denotes a task on attribute. The
nodes which are between root node and leaf node are called Internal
nodes.
3.Leaf node :We call last nodes as leaf nodes, they represents output
ie: classlabels
❖ Root nodes and Internal nodes are represented by rectangle and
leaf nodes are represented by oval.
Advantages:
• It does not require any domain knowledge.
• Classification steps and decision tree are simple and fast
• Missing values in data does not affect output.
• A decision tree model is automatic and does not require any
standardization (checking data is in correct format or not) of data.
Key feature:
⮚Building a decision tree is all about discovering attributes that return
the highest data gain.
Entropy:
⮚Entropy refers to a common way to measure Impurity. In the decision
tree it measures the impurity in the dataset.
Information Gain:
⮚Information gain refers to the decline in entropy after the dataset is
split. It is also called as Entropy Reduction.
Name Gender Salary
A M 50K
B F 60K
C M 40K
D F 55K
Construct Decision tree for salary
Impure attribute
Name Salary
A 50K
B 60K
C 40K
D 55K
Information Gain
Gender
M
F
M
F
Day Weather Temperature Humidity Wind Play?
1 Sunny Hot High Weak No
2 Cloudy Hot High Weak Yes
3 Cloudy mild High Strong Yes
4 Rainy Mild High Strong No
5 Sunny Mild Normal Strong Yes
6 Rainy Cold Normal Strong No
7 Rainy Mild High Weak Yes
8 Sunny Hot High Strong No
9 Cloudy Hot Normal Weak Yes
10 Rainy mild High strong no
• Rules:
1. If weather= cloudy ,then play =yes.
2. If weather= sunny ,humidity=high then play =no.
3. If weather= sunny ,humidity=normal then play =yes.
4. If weather= rainy ,wind=strong then play =no.
5. If weather= rainy ,wind=weak then play =yes.
Weather
Humidity Wind
High
Cloudy
Sunny Rainy
Normal
no
yes
yes
strong weak
no yes
• Question??
Day=11,weather=rainy, temperature=hot
Humidity=high, wind=weak
Play??
4.RANDOM FOREST ALGORITHM
• Random Forest is a supervised Machine learning technique that
construct multiple decision trees.
• The final decision is made based on the outcome of the majority of
the decision trees.-
Why Random forest is Required at all?
• Decision trees suffer from high variance
• Random forest induces flexibility and converts
high variance low variance
🡪
Step1: Construct bootstrapped dataset
Chest
pain
Good
blood
circulation
Blocked
Arteries
Weigh
t(KG)
Heart
Disas
e
NO No No 125 NO
YES YES YES 180 YES
YES YES NO 210 NO
YES NO YES 167 YES
Chest
pain
Good blood
circultion
Blocked
Arteries
Weigh
t(KG)
Heart
Dises
se
NO No No 125 NO
YES YES YES 180 YES
YES YES YES 180 YES
YES NO YES 167 YES
Original data set
Bootstrapped data set
❖ Observe the randomness involved in constructing the bootstrapped data set
❖ Random sampling with replacement
Step 2- Construct decision tree using the
bootstrapped data set
• While constructing the decision tree, the candidates for root node
and for the rest of the nodes can be randomly selected.
Step 3- Repeat step 1 and step 2 to get more
number (required number )of decision trees
Training is done
Questions
CP GBC BA W Heart
disease
no yes yes 178 ??
• Run this on each of the Decision tree
• Take the decision given by the majority of the trees(eg: if total decision trees 7 and if
5”yes and 2 “no” , then the patient has heart disease”)
• The randomness involved in the training data set makes the random
forest classify more accurately the unseen test data set”.
• Thereby yielding in “Low Variance “ compared to “Decision trees”
5.Support Vector Machine(SVM)
• Support Vector Machine or SVM is one of the most popular Supervised
learning algorithm, which is used for classification as well as regression
problems.
• However primarily it is used for classification problem.
• The goal of SVM algorithm is to create the best line or decision
boundary that can separate n-dimensional space into classes so that
we can easily put new data point in the correct category in the future.
• We call this best line or decision boundary as hyper line.
• SVM chooses extreme points that help in creating Hyperplane. These
extreme points are called Support Vector
SVM can be of 2 types
• Linear SVM
Linear SVM is used for linearly separable data, which means if a dataset
can be classified into 2 classes by using a single straight line, then such
a data is termed as linearly separable data, and classifier is called linear
classifier
• Non_Linear SVM
Non_Linear SVM is used for non_linearly separated data, which means
if a dataset cannot be classified by using a straight line, then such data
is termed as non_lnear data and classifier used is called as Non-Linear
SVM
6.Naïve Bayes Classifier Algorithm
• It is a supervised Learning algorithm, which is based on Bayes
Theorem and is used for classification problem
• It is mainly used in text classification that includes a high dimensional
dataset.
• Naïve Bayes classifier is one of the simple and most effective
classification algorithm which helps in building the fast machine
learning models that can make quick predictions.
• It is a probabilistic classifier, which means it predict on the basis of the
probability of an object.
Advantages
• It is one of the fast and easy machine learning algorithm to predict a
class and dataset
• It is the most popular choice for text classification problems.
• The formula for Bayes theorem is given as
P(A/B)= P(B/A).P(A)
P(B)
Probability of
A when B is
true
Probability of B when A is
true
Advantages of Supervised learning:
• With the help of supervised learning, the model can predict
the output on the basis of prior experiences.
• In supervised learning, we can have an exact idea about the
classes of objects.
• Supervised learning model helps us to solve various real-
world problems such as fraud detection, spam filtering,
etc.
Unlabelled Datasets & Unsupervised
Learning
• Unlabelled datasets are samples of natural or human-made
items.
• Unlabelled data might include photo images, audio and
video recordings, articles, Tweets, medical scans, or news.
• These items have no labels or explanations; they are merely
data.
• Unsupervised machine learning is the branch that deals with
unlabelled datasets.
Un supervised Learning
ALGORITHM
K Means Clustering
• K-Means Clustering is an unsupervised learning algorithm that is used to
solve the clustering problems in machine learning or data science.
• groups the unlabelled dataset into different clusters.
• Here K defines the number of pre-defined clusters that need to be
created in the process, as if K=2, there will be two clusters, and for K=3,
there will be three clusters, and so on.
• It is a centroid-based algorithm, where each cluster is associated with a
centroid.
• The k-means clustering algorithm mainly performs two tasks:
• Determines the best value for K center points or centroids by an iterative process.
• Assigns each data point to its closest k-center. Those data points which are near
to the particular k-center, create a cluster.
How k mean?
1. Choosing the number of clusters
• The first step is to define the K number of clusters in which we will group the data. Let’s select K=3.
2. Initializing centroids
• Centroid is the center of a cluster but initially, the exact center of data points will be unknown so, we select
random data points and define them as centroids for each cluster. We will initialize 3 centroids in the
dataset.
3. Assign data points to the nearest cluster
• Now that centroids are initialized, the next step is to assign data points Xn to their closest cluster centroid Ck
In this step, we will first calculate
the distance between data point X and
centroid C using Euclidean Distance metric
And then choose the cluster for data points where
the distance between the data point and the centroid is minimum..
4. Re-initialize centroids
• Next, we will re-initialize the centroids by calculating the average of all data points of that cluster.
5. Repeat steps 3 and 4
• We will keep repeating steps 3 and 4 until we have optimal centroids and the assignments of data points to
correct clusters are not changing anymore.
Data Preprocessing
• Data preprocessing is a process of preparing the raw data and
making it suitable for a machine learning model.
• It is the first and crucial step while creating a machine learning
model.
• A real-world data generally contains noises, missing values, and
maybe in an unusable format which cannot be directly used for
machine learning models.
• Data preprocessing is required tasks for cleaning the data and
making it suitable for a machine learning model which also
increases the accuracy and efficiency of a machine learning
model.
Technique for data preprocessing
• Binarization
• Mean Removal
• Scaling
• Normalization
Binarization
• As the name suggests, this is the technique with the help of which we
can make our data binary.
• We can use a binary threshold for making our data binary. The values
above that threshold value will be converted to 1 and below that
threshold will be converted to 0
• Eg: if we choose threshold value =0.5, then the dataset value above it
will become 1 and below this will become 0.
Mean Removal
• Standardization or mean removal is a technique that simply centers
data by removing the average value of each characteristic
• It is usually beneficial to remove the mean from each feaure so that it
is centered on zero.
Normalization
• Normalization is a scaling technique in Machine Learning applied
during data preparation to change the values of numeric columns in
the dataset to use a common scale.
• It is not necessary for all datasets in a model.
• It is required only when features of machine learning models have
different ranges.
• Mathematically, we can calculate normalization with the below formula:
Xn = (X - Xminimum) / ( Xmaximum - Xminimum)
• Xn = Value of Normalization
• Xmaximum = Maximum value of a feature
• Xminimum = Minimum value of a feature
Example: Let's assume we have a model dataset having maximum and
minimum values of feature as mentioned above. To normalize the machine
learning model, values are shifted and rescaled so their range can vary
between 0 and 1. This technique is also known as Min-Max scaling. In this
scaling technique, we will change the feature values as follows:
• Case1- If the value of X is minimum, the value of Numerator will be 0;
hence Normalization will also be 0.
Xn = (X - Xminimum) / ( Xmaximum - Xminimum)
• Put X =Xminimum in above formula, we get;
• Xn = Xminimum- Xminimum/ ( Xmaximum - Xminimum)
• Xn = 0
Case2- If the value of X is maximum, then the value of the numerator is
equal to the denominator; hence Normalization will be 1.
• Put X =Xmaximum in above formula, we get;
• Xn = Xmaximum - Xminimum/ ( Xmaximum - Xminimum)
• Xn = 1
Case3- On the other hand, if the value of X is neither maximum nor
minimum, then values of normalization will also be between 0 and 1.
• Hence, Normalization can be defined as a scaling method where
values are shifted and rescaled to maintain their ranges between 0
and 1, or in other words; it can be referred to as Min-Max scaling
technique.
Scaling
• Feature Scaling is a technique to standardize the independent
features present in the data in a fixed range.
• It is performed during the data pre-processing to handle highly
varying magnitudes or values or units.
• If feature scaling is not done, then a machine learning algorithm tends
to weigh greater values, higher and consider smaller values as the
lower values, regardless of the unit of the values.
• Why use Feature Scaling?
• Scaling guarantees that all features are on a comparable scale and
have comparable ranges. This process is known as feature
normalization.
• Algorithm performance improvement:
• Preventing numerical instability
• Scaling features makes ensuring that each characteristic is given the
same consideration during the learning process.
Disadvantages of supervised learning:
• Supervised learning models are not suitable for handling
the complex tasks.
• Supervised learning cannot predict the correct output if the
test data is different from the training dataset.
• Training required lots of computation times.
• In supervised learning, we need enough knowledge about
the classes of object.
Macine learning algorithms - K means, KNN

Macine learning algorithms - K means, KNN

  • 1.
  • 2.
    Data • Data isa crucial component in the field of Machine Learning. • It refers to the set of observations or measurements that can be used to train a machine-learning model. • Data is the most important part of all Data Analytics, Machine Learning, and Artificial Intelligence. • Without data, we can’t train any model and all modern research and automation will go in vain. • Big Enterprises are spending lots of money just to gather as much certain data as possible. • The quality and quantity of data available for training and testing play a significant role in determining the performance of a machine-learning model. • Machine learning algorithms use data to learn patterns and relationships between input variables and target outputs • Then it can be used for prediction or classification tasks.
  • 3.
    • Data istypically divided into two types: • Labeled data • Un labeled data • Labeled data includes a label or target variable that the model is trying to predict.(Used in supervised learning) • Unlabeled data does not include a label or target variable(Used in unsupervised Learning)
  • 6.
    MACHINE Learning(ml) • MachineLearning (ML) is an automated learning with little or no human intervention. • It involves programming computers so that they learn from the available inputs. • The main purpose of machine learning is to explore and construct algorithms that can learn from the previous data and make predictions on new input data. • Learn from experience.
  • 7.
    Machine Learning Classification 1.Supervised Learning 2. Un Supervised Learning
  • 8.
    Labelled Datasets &Supervised Learning • Supervised learning uses labelled datasets in algorithms to classify data and predict outcomes. • Supervised learning is used in most software applications these days; these include text processes and image recognition. • It also helps companies solve real-world problems, such as classifying tope leads, customers about to cancel your service and separating spam in your email inbox.
  • 10.
  • 11.
    Type 1.Regression algorithms •Regression algorithms are used if there is a relationship between the input variable and the output variable. • It is used for the prediction of continuous variables, such as Weather forecasting, Market Trends, etc. • Stock market analysis • Demand forecasting • Rainfall quantity prediction
  • 12.
    Examples of Regressionalgorithms • Linear Regression • Regression Trees • Non-Linear Regression
  • 13.
    Linear Regression • Linearregression analysis is used to predict the value of a variable based on the value of another variable. • The variable you want to predict is called the dependent variable. • The variable you are using to predict the other variable's value is called the independent variable. • Equation: y=mx+b
  • 14.
    Linear Regression inreal life-Prediction of landprice
  • 15.
    Linear Regression inreal life-Prediction of landprice
  • 16.
    Linear Regression inreal life-Prediction of landprice
  • 17.
    Type 2: Classification •Classification algorithms are used when the output variable is categorical, which means there are two classes such as Yes-No, Male-Female, True-false, etc. • Spam Filtering, • Random Forest • Decision Trees • Logistic Regression • Support vector Machines
  • 19.
  • 20.
  • 21.
    1. Logistic Regression •Logistic Regression is a classification technique used in machine learning. • It uses a logistic function to model the dependent variable. • The dependent variable is dichotomous in nature, i.e. there could only be two possible classes (eg.: either the cancer is malignant or not). • Works on sigmoid function
  • 22.
    2. K NearestNeighbour(KNN) • K-Nearest Neighbour is one of the simplest Machine Learning algorithms based on Supervised Learning technique. • K-NN algorithm assumes the similarity between the new case/data and available cases and put the new case into the category that is most similar to the available categories. • K-NN algorithm stores all the available data and classifies a new data point based on the similarity. This means when new data appears then it can be easily classified into a well suite category by using K- NN algorithm. • K-NN algorithm can be used for Regression as well as for Classification but mostly it is used for the Classification problems.
  • 23.
  • 24.
    KNN-Working • The K-NNworking can be explained on the basis of the below algorithm: • Step-1: Select the number K of the neighbors • Step-2: Calculate the Euclidean distance of K number of neighbors • Step-3: Take the K nearest neighbors as per the calculated Euclidean distance. • Step-4: Among these k neighbors, count the number of the data points in each category. • Step-5: Assign the new data points to that category for which the number of the neighbor is maximum. • Step-6: Our model is ready.
  • 25.
    •Firstly, we willchoose the number of neighbors, so we will choose the k=5. •Next, we will calculate the Euclidean distance between the data points. The Euclidean distance is the distance between two points, which we have already studied in geometry.
  • 26.
    By calculating theEuclidean distance we got the nearest neighbors, as three nearest neighbours in category A and two nearest neighbors in category B
  • 27.
    3.Decision Tree • DecisionTree algorithm falls under the category of supervised learning. • They can be used to solve both regression and classification problem. • It is a tree that helps us in decision making purposes.
  • 28.
    Decision tree contains3 types of nodes they are: 1. Root node: It is the topmost node in the tree. Data which is inside the root node is known as attribute. 2. Internal node : Each internal node denotes a task on attribute. The nodes which are between root node and leaf node are called Internal nodes. 3.Leaf node :We call last nodes as leaf nodes, they represents output ie: classlabels ❖ Root nodes and Internal nodes are represented by rectangle and leaf nodes are represented by oval.
  • 29.
    Advantages: • It doesnot require any domain knowledge. • Classification steps and decision tree are simple and fast • Missing values in data does not affect output. • A decision tree model is automatic and does not require any standardization (checking data is in correct format or not) of data.
  • 30.
    Key feature: ⮚Building adecision tree is all about discovering attributes that return the highest data gain. Entropy: ⮚Entropy refers to a common way to measure Impurity. In the decision tree it measures the impurity in the dataset. Information Gain: ⮚Information gain refers to the decline in entropy after the dataset is split. It is also called as Entropy Reduction.
  • 31.
    Name Gender Salary AM 50K B F 60K C M 40K D F 55K Construct Decision tree for salary Impure attribute Name Salary A 50K B 60K C 40K D 55K Information Gain Gender M F M F
  • 32.
    Day Weather TemperatureHumidity Wind Play? 1 Sunny Hot High Weak No 2 Cloudy Hot High Weak Yes 3 Cloudy mild High Strong Yes 4 Rainy Mild High Strong No 5 Sunny Mild Normal Strong Yes 6 Rainy Cold Normal Strong No 7 Rainy Mild High Weak Yes 8 Sunny Hot High Strong No 9 Cloudy Hot Normal Weak Yes 10 Rainy mild High strong no
  • 33.
    • Rules: 1. Ifweather= cloudy ,then play =yes. 2. If weather= sunny ,humidity=high then play =no. 3. If weather= sunny ,humidity=normal then play =yes. 4. If weather= rainy ,wind=strong then play =no. 5. If weather= rainy ,wind=weak then play =yes.
  • 34.
  • 35.
  • 36.
    4.RANDOM FOREST ALGORITHM •Random Forest is a supervised Machine learning technique that construct multiple decision trees. • The final decision is made based on the outcome of the majority of the decision trees.-
  • 37.
    Why Random forestis Required at all? • Decision trees suffer from high variance • Random forest induces flexibility and converts high variance low variance 🡪
  • 38.
    Step1: Construct bootstrappeddataset Chest pain Good blood circulation Blocked Arteries Weigh t(KG) Heart Disas e NO No No 125 NO YES YES YES 180 YES YES YES NO 210 NO YES NO YES 167 YES Chest pain Good blood circultion Blocked Arteries Weigh t(KG) Heart Dises se NO No No 125 NO YES YES YES 180 YES YES YES YES 180 YES YES NO YES 167 YES Original data set Bootstrapped data set ❖ Observe the randomness involved in constructing the bootstrapped data set ❖ Random sampling with replacement
  • 39.
    Step 2- Constructdecision tree using the bootstrapped data set • While constructing the decision tree, the candidates for root node and for the rest of the nodes can be randomly selected.
  • 40.
    Step 3- Repeatstep 1 and step 2 to get more number (required number )of decision trees Training is done
  • 41.
    Questions CP GBC BAW Heart disease no yes yes 178 ?? • Run this on each of the Decision tree • Take the decision given by the majority of the trees(eg: if total decision trees 7 and if 5”yes and 2 “no” , then the patient has heart disease”)
  • 42.
    • The randomnessinvolved in the training data set makes the random forest classify more accurately the unseen test data set”. • Thereby yielding in “Low Variance “ compared to “Decision trees”
  • 43.
    5.Support Vector Machine(SVM) •Support Vector Machine or SVM is one of the most popular Supervised learning algorithm, which is used for classification as well as regression problems. • However primarily it is used for classification problem. • The goal of SVM algorithm is to create the best line or decision boundary that can separate n-dimensional space into classes so that we can easily put new data point in the correct category in the future. • We call this best line or decision boundary as hyper line. • SVM chooses extreme points that help in creating Hyperplane. These extreme points are called Support Vector
  • 45.
    SVM can beof 2 types • Linear SVM Linear SVM is used for linearly separable data, which means if a dataset can be classified into 2 classes by using a single straight line, then such a data is termed as linearly separable data, and classifier is called linear classifier • Non_Linear SVM Non_Linear SVM is used for non_linearly separated data, which means if a dataset cannot be classified by using a straight line, then such data is termed as non_lnear data and classifier used is called as Non-Linear SVM
  • 46.
    6.Naïve Bayes ClassifierAlgorithm • It is a supervised Learning algorithm, which is based on Bayes Theorem and is used for classification problem • It is mainly used in text classification that includes a high dimensional dataset. • Naïve Bayes classifier is one of the simple and most effective classification algorithm which helps in building the fast machine learning models that can make quick predictions. • It is a probabilistic classifier, which means it predict on the basis of the probability of an object.
  • 47.
    Advantages • It isone of the fast and easy machine learning algorithm to predict a class and dataset • It is the most popular choice for text classification problems.
  • 48.
    • The formulafor Bayes theorem is given as P(A/B)= P(B/A).P(A) P(B) Probability of A when B is true Probability of B when A is true
  • 49.
    Advantages of Supervisedlearning: • With the help of supervised learning, the model can predict the output on the basis of prior experiences. • In supervised learning, we can have an exact idea about the classes of objects. • Supervised learning model helps us to solve various real- world problems such as fraud detection, spam filtering, etc.
  • 50.
    Advantages of Supervisedlearning: • With the help of supervised learning, the model can predict the output on the basis of prior experiences. • In supervised learning, we can have an exact idea about the classes of objects. • Supervised learning model helps us to solve various real- world problems such as fraud detection, spam filtering, etc.
  • 51.
    Unlabelled Datasets &Unsupervised Learning • Unlabelled datasets are samples of natural or human-made items. • Unlabelled data might include photo images, audio and video recordings, articles, Tweets, medical scans, or news. • These items have no labels or explanations; they are merely data. • Unsupervised machine learning is the branch that deals with unlabelled datasets.
  • 54.
  • 55.
    K Means Clustering •K-Means Clustering is an unsupervised learning algorithm that is used to solve the clustering problems in machine learning or data science. • groups the unlabelled dataset into different clusters. • Here K defines the number of pre-defined clusters that need to be created in the process, as if K=2, there will be two clusters, and for K=3, there will be three clusters, and so on. • It is a centroid-based algorithm, where each cluster is associated with a centroid. • The k-means clustering algorithm mainly performs two tasks: • Determines the best value for K center points or centroids by an iterative process. • Assigns each data point to its closest k-center. Those data points which are near to the particular k-center, create a cluster.
  • 58.
    How k mean? 1.Choosing the number of clusters • The first step is to define the K number of clusters in which we will group the data. Let’s select K=3. 2. Initializing centroids • Centroid is the center of a cluster but initially, the exact center of data points will be unknown so, we select random data points and define them as centroids for each cluster. We will initialize 3 centroids in the dataset.
  • 59.
    3. Assign datapoints to the nearest cluster • Now that centroids are initialized, the next step is to assign data points Xn to their closest cluster centroid Ck In this step, we will first calculate the distance between data point X and centroid C using Euclidean Distance metric And then choose the cluster for data points where the distance between the data point and the centroid is minimum..
  • 60.
    4. Re-initialize centroids •Next, we will re-initialize the centroids by calculating the average of all data points of that cluster.
  • 61.
    5. Repeat steps3 and 4 • We will keep repeating steps 3 and 4 until we have optimal centroids and the assignments of data points to correct clusters are not changing anymore.
  • 62.
    Data Preprocessing • Datapreprocessing is a process of preparing the raw data and making it suitable for a machine learning model. • It is the first and crucial step while creating a machine learning model. • A real-world data generally contains noises, missing values, and maybe in an unusable format which cannot be directly used for machine learning models. • Data preprocessing is required tasks for cleaning the data and making it suitable for a machine learning model which also increases the accuracy and efficiency of a machine learning model.
  • 63.
    Technique for datapreprocessing • Binarization • Mean Removal • Scaling • Normalization
  • 64.
    Binarization • As thename suggests, this is the technique with the help of which we can make our data binary. • We can use a binary threshold for making our data binary. The values above that threshold value will be converted to 1 and below that threshold will be converted to 0 • Eg: if we choose threshold value =0.5, then the dataset value above it will become 1 and below this will become 0.
  • 65.
    Mean Removal • Standardizationor mean removal is a technique that simply centers data by removing the average value of each characteristic • It is usually beneficial to remove the mean from each feaure so that it is centered on zero.
  • 66.
    Normalization • Normalization isa scaling technique in Machine Learning applied during data preparation to change the values of numeric columns in the dataset to use a common scale. • It is not necessary for all datasets in a model. • It is required only when features of machine learning models have different ranges.
  • 67.
    • Mathematically, wecan calculate normalization with the below formula: Xn = (X - Xminimum) / ( Xmaximum - Xminimum) • Xn = Value of Normalization • Xmaximum = Maximum value of a feature • Xminimum = Minimum value of a feature Example: Let's assume we have a model dataset having maximum and minimum values of feature as mentioned above. To normalize the machine learning model, values are shifted and rescaled so their range can vary between 0 and 1. This technique is also known as Min-Max scaling. In this scaling technique, we will change the feature values as follows:
  • 68.
    • Case1- Ifthe value of X is minimum, the value of Numerator will be 0; hence Normalization will also be 0. Xn = (X - Xminimum) / ( Xmaximum - Xminimum) • Put X =Xminimum in above formula, we get; • Xn = Xminimum- Xminimum/ ( Xmaximum - Xminimum) • Xn = 0 Case2- If the value of X is maximum, then the value of the numerator is equal to the denominator; hence Normalization will be 1.
  • 69.
    • Put X=Xmaximum in above formula, we get; • Xn = Xmaximum - Xminimum/ ( Xmaximum - Xminimum) • Xn = 1 Case3- On the other hand, if the value of X is neither maximum nor minimum, then values of normalization will also be between 0 and 1. • Hence, Normalization can be defined as a scaling method where values are shifted and rescaled to maintain their ranges between 0 and 1, or in other words; it can be referred to as Min-Max scaling technique.
  • 70.
    Scaling • Feature Scalingis a technique to standardize the independent features present in the data in a fixed range. • It is performed during the data pre-processing to handle highly varying magnitudes or values or units. • If feature scaling is not done, then a machine learning algorithm tends to weigh greater values, higher and consider smaller values as the lower values, regardless of the unit of the values.
  • 71.
    • Why useFeature Scaling? • Scaling guarantees that all features are on a comparable scale and have comparable ranges. This process is known as feature normalization. • Algorithm performance improvement: • Preventing numerical instability • Scaling features makes ensuring that each characteristic is given the same consideration during the learning process.
  • 72.
    Disadvantages of supervisedlearning: • Supervised learning models are not suitable for handling the complex tasks. • Supervised learning cannot predict the correct output if the test data is different from the training dataset. • Training required lots of computation times. • In supervised learning, we need enough knowledge about the classes of object.