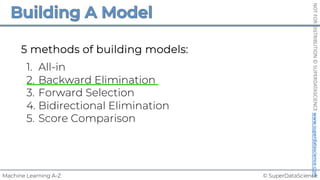
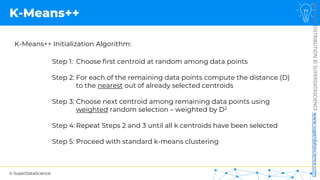
Download as PDF, PPTX

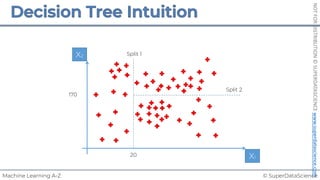
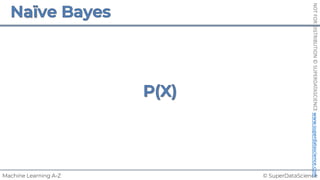
![© SuperDataScience
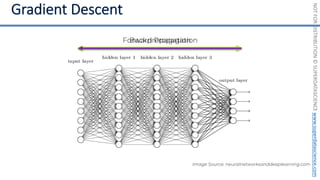
NOT
FOR
DISTRIBUTION
©
SUPERDATASCIENCE
www.superdatascience.com
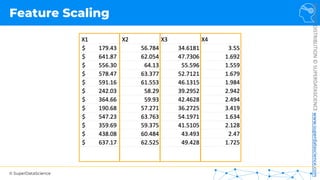
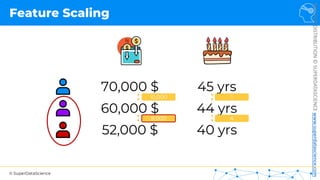
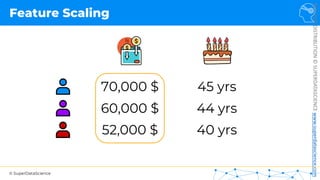
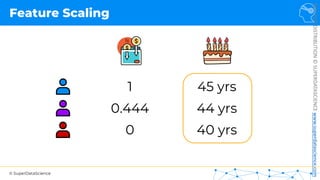
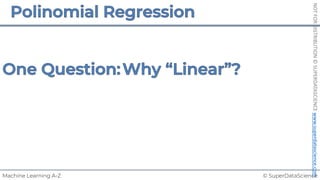
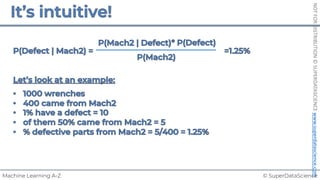
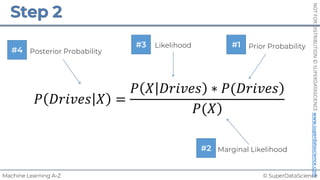
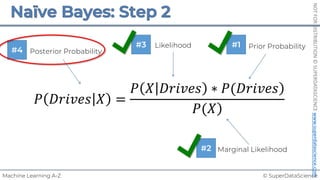
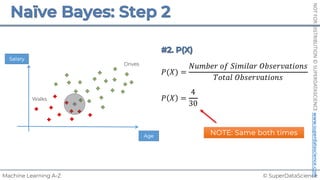
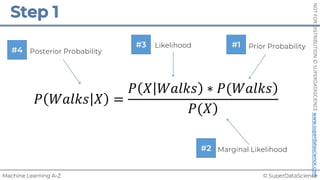
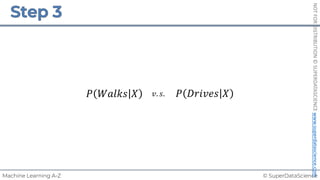
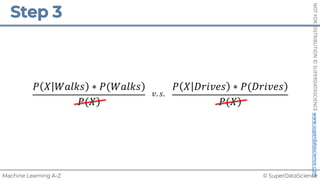
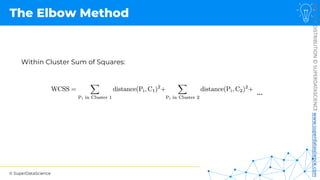
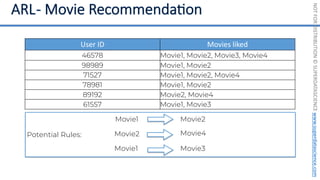
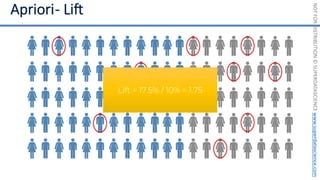
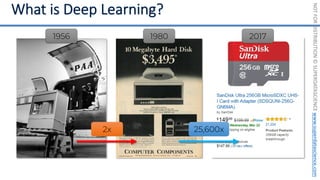
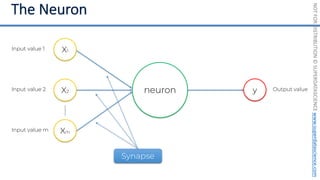
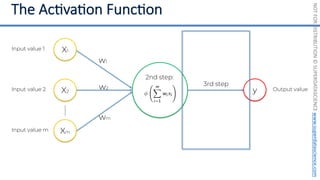
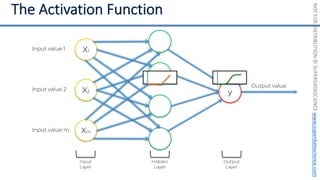
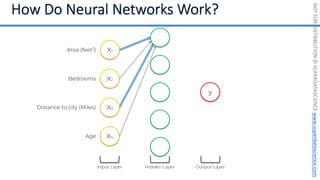
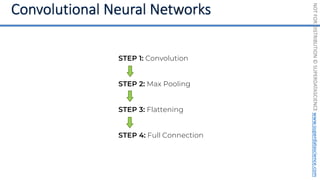
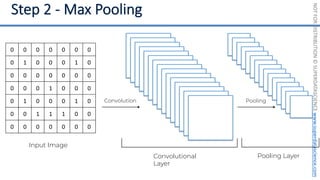
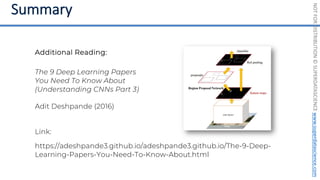
Feature Scaling
Normalization Standardization
𝑋! =
𝑋 − 𝜇
𝜎
𝑋!
=
𝑋 − 𝑋"#$
𝑋"%& − 𝑋"#$
[0 ; 1] [-3 ; +3]](https://image.slidesharecdn.com/machine-learning-a-z-course-downloadable-slides-v1-230302104430-56d42584/85/Machine-Learning-A-Z-Course-Downloadable-Slides-V1-5-pdf-11-320.jpg)
![© SuperDataScience
NOT
FOR
DISTRIBUTION
©
SUPERDATASCIENCE
www.superdatascience.com
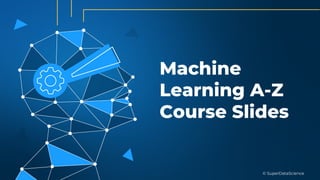
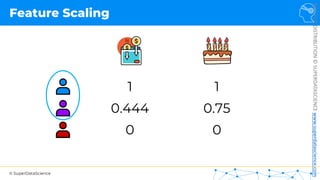
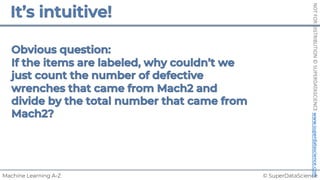
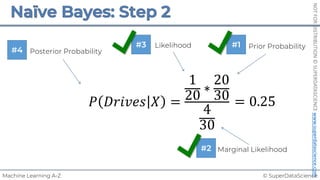
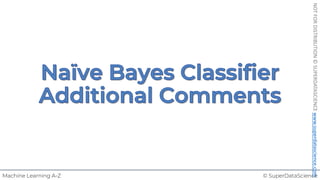
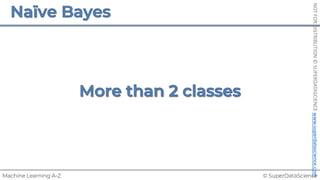
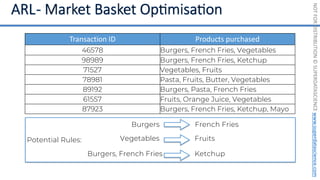
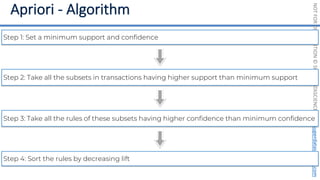
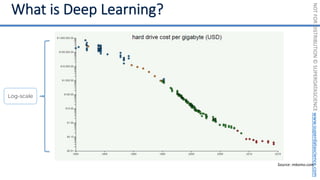
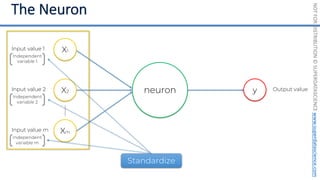
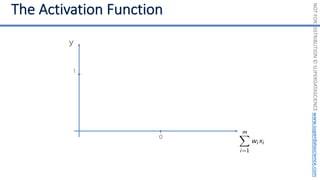
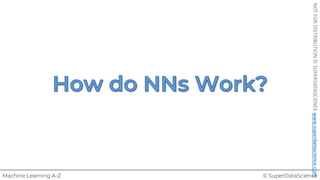
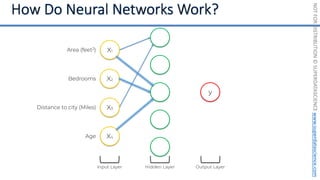
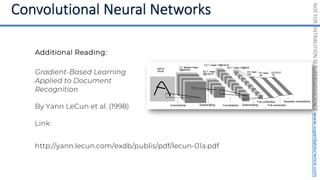
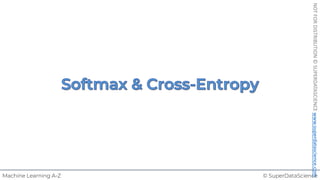
Feature Scaling
Normalization
𝑋!
=
𝑋 − 𝑋"#$
𝑋"%& − 𝑋"#$
[0 ; 1]](https://image.slidesharecdn.com/machine-learning-a-z-course-downloadable-slides-v1-230302104430-56d42584/85/Machine-Learning-A-Z-Course-Downloadable-Slides-V1-5-pdf-13-320.jpg)

![© SuperDataScience
NOT
FOR
DISTRIBUTION
©
SUPERDATASCIENCE
www.superdatascience.com
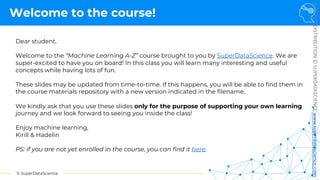
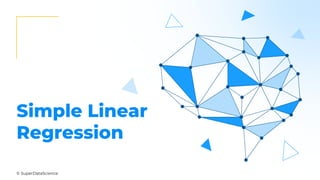
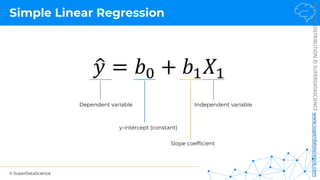
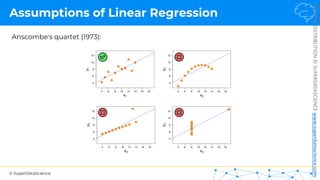
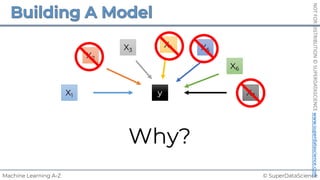
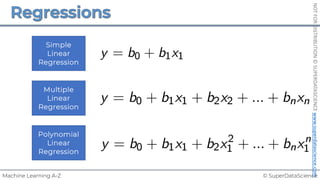
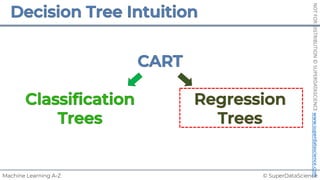
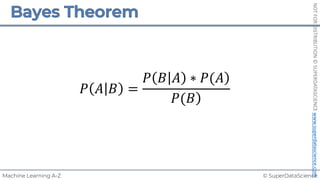
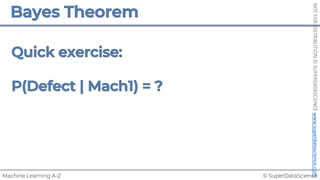
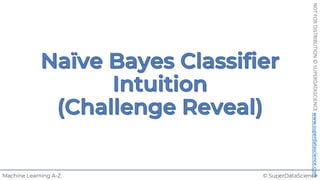
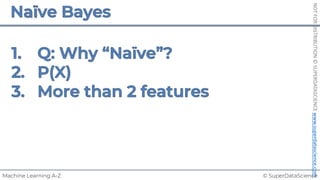
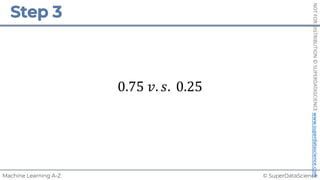
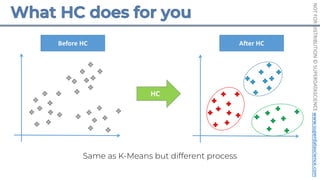
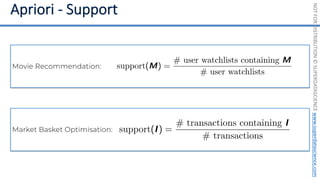
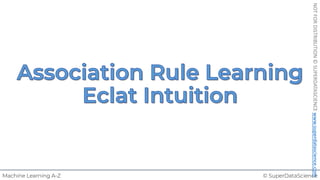
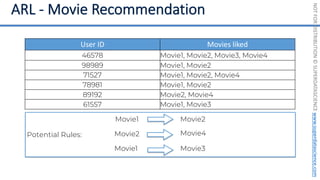
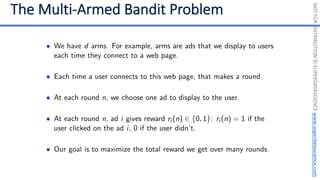
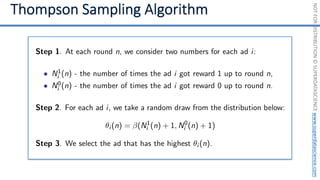
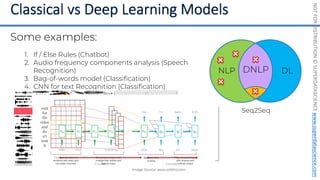
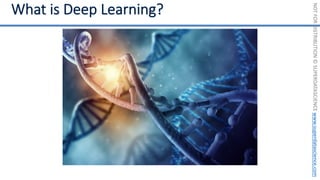
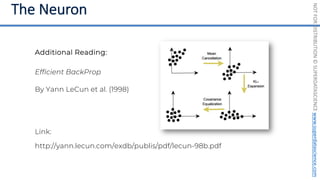
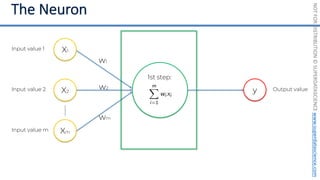
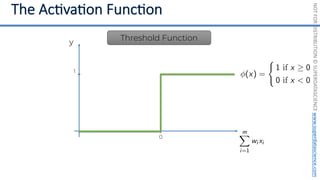
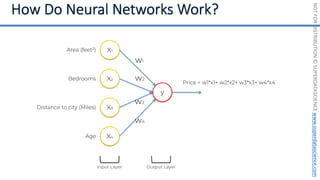
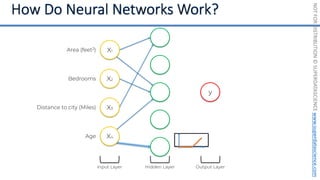
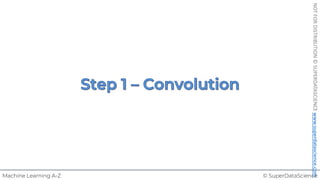
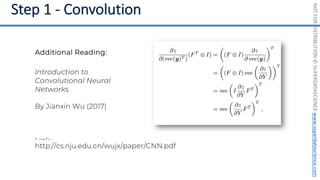
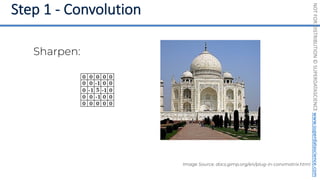
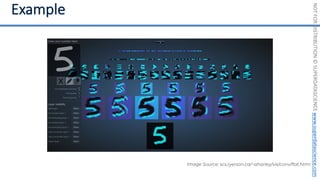
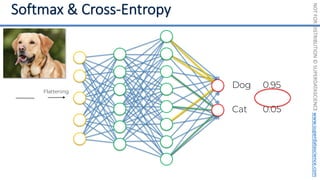
Simple Linear Regression
𝑦 [tonnes]
(Potato yield)
𝑋! [kg]
(Nitrogen Fertilizer)
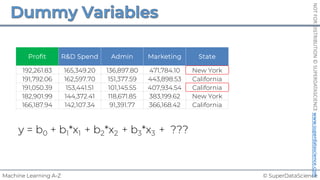
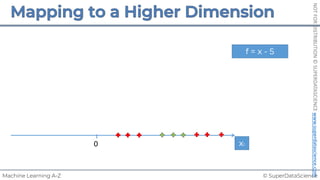
𝑃𝑜𝑡𝑎𝑡𝑜𝑒𝑠 𝑡 = 𝑏! + 𝑏"×𝐹𝑒𝑟𝑡𝑖𝑙𝑖𝑧𝑒𝑟 𝑘𝑔
8𝑡
+1𝑘𝑔
+3𝑡
!
𝑦 = 𝑏! + 𝑏"𝑋"
𝑏! = 8[𝑡]
𝑏" = 3[
𝑡
𝑘𝑔
]
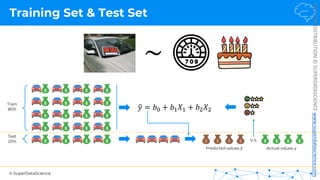
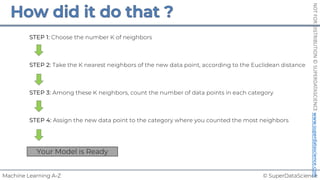
~
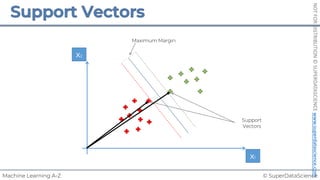
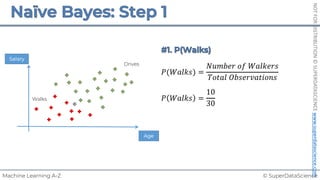
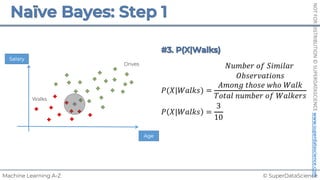
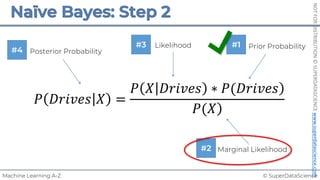
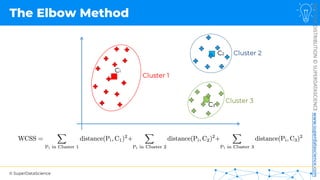
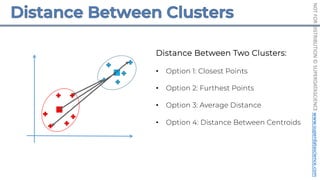
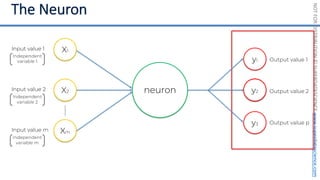
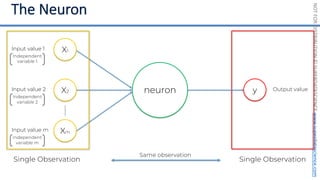
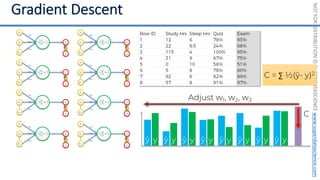
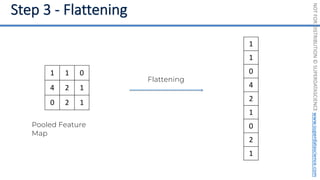
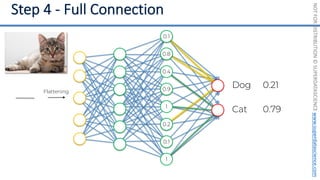
Each point represents
a separate harvest](https://image.slidesharecdn.com/machine-learning-a-z-course-downloadable-slides-v1-230302104430-56d42584/85/Machine-Learning-A-Z-Course-Downloadable-Slides-V1-5-pdf-20-320.jpg)
![© SuperDataScience
NOT
FOR
DISTRIBUTION
©
SUPERDATASCIENCE
www.superdatascience.com
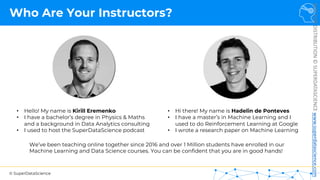
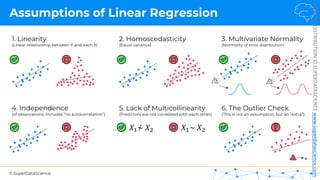
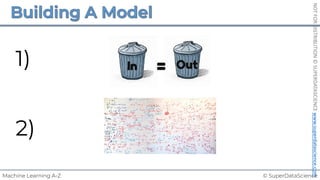
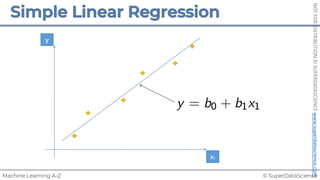
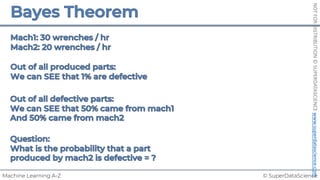
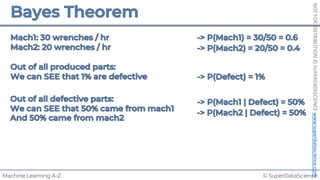
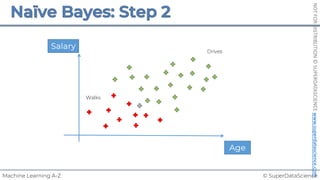
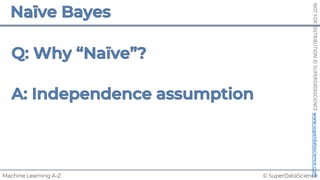
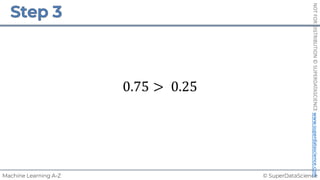
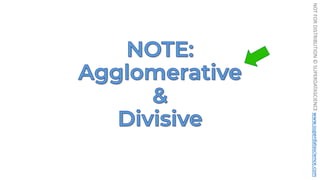
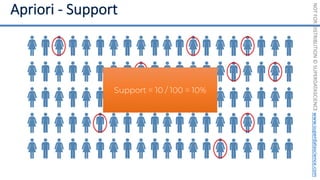
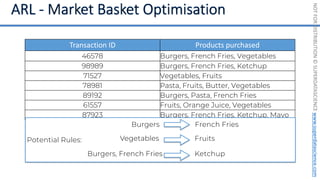
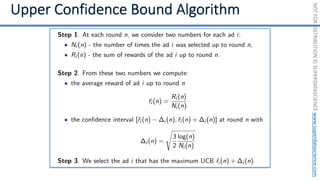
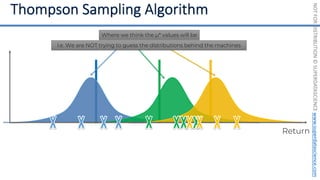
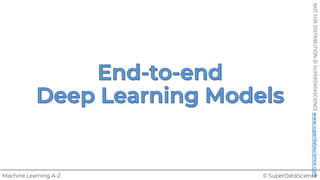
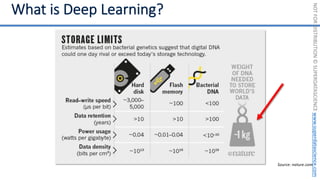
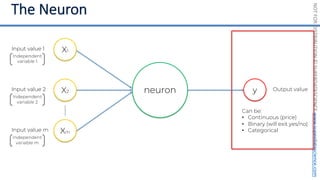
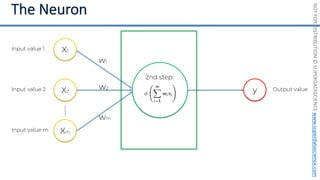
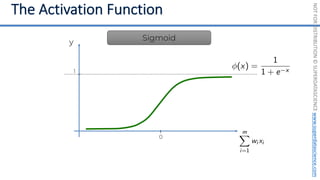
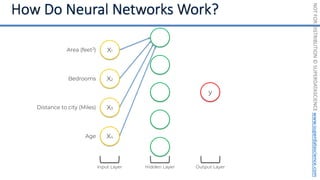
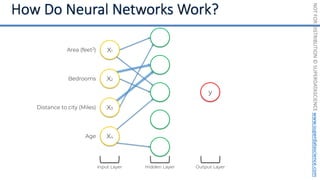
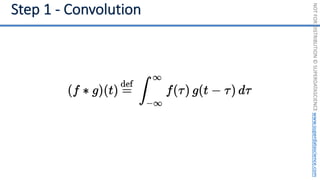
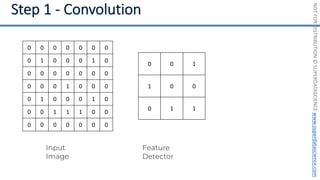
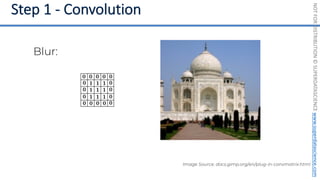
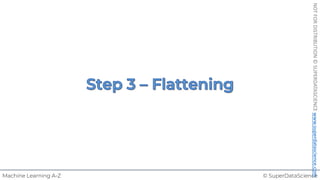
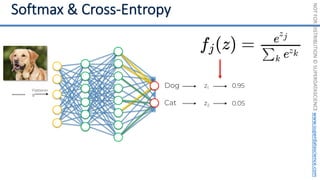
Simple Linear Regression
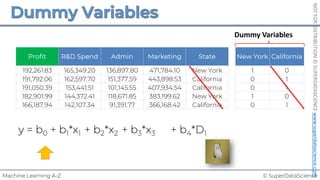
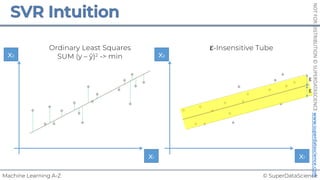
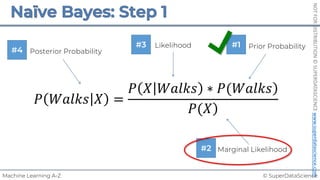
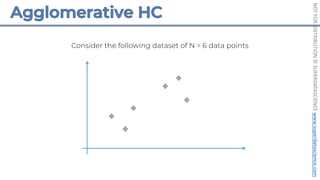
𝑆𝑈𝑀(𝑦$ − !
𝑦$)# is minimized
%
𝑦!
𝑦!
𝑟𝑒𝑠𝑖𝑑𝑢𝑎𝑙: 𝜀! = 𝑦! − %
𝑦!
!
𝑦 = 𝑏! + 𝑏"𝑋"
𝑏!, 𝑏" such that:
𝑦!
%
𝑦!
Ordinary Least Squares:
𝑦 [tonnes]
(Potato yield)
𝑋! [kg]
(Nitrogen Fertilizer)](https://image.slidesharecdn.com/machine-learning-a-z-course-downloadable-slides-v1-230302104430-56d42584/85/Machine-Learning-A-Z-Course-Downloadable-Slides-V1-5-pdf-22-320.jpg)

![© SuperDataScience
NOT
FOR
DISTRIBUTION
©
SUPERDATASCIENCE
www.superdatascience.com
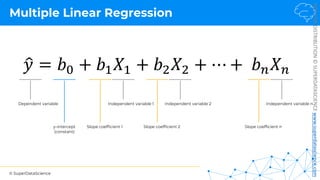
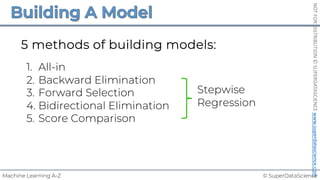
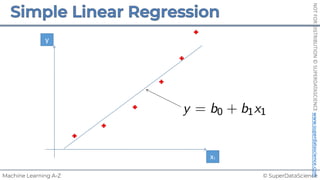
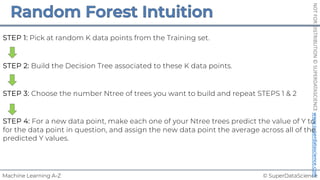
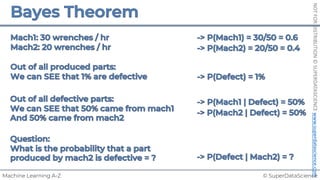
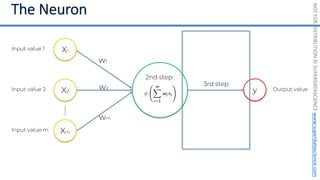
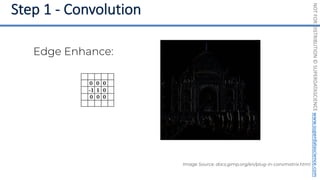
Multiple Linear Regression
~
𝑃𝑜𝑡𝑎𝑡𝑜𝑒𝑠 𝑡 = 8𝑡 + 3
3
45
×𝐹𝑒𝑟𝑡𝑖𝑙𝑖𝑧𝑒𝑟 𝑘𝑔 − 0.54
3
°7
×𝐴𝑣𝑔𝑇𝑒𝑚𝑝 °𝐶 + 0.04
3
88
×𝑅𝑎𝑖𝑛[𝑚𝑚]](https://image.slidesharecdn.com/machine-learning-a-z-course-downloadable-slides-v1-230302104430-56d42584/85/Machine-Learning-A-Z-Course-Downloadable-Slides-V1-5-pdf-25-320.jpg)

![© SuperDataScience
NOT
FOR
DISTRIBUTION
©
SUPERDATASCIENCE
www.superdatascience.com
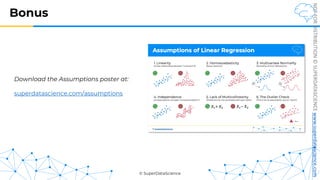
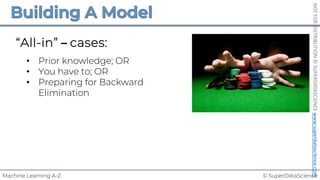
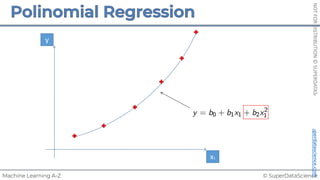
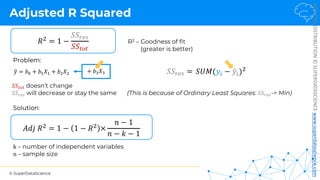
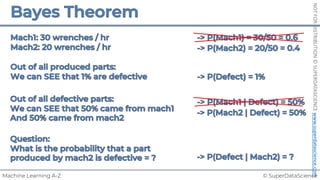
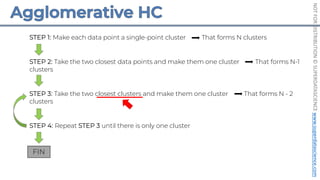
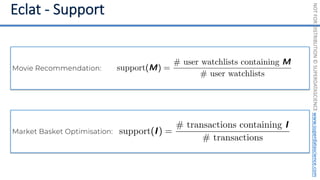
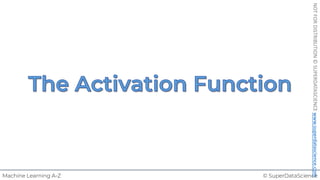
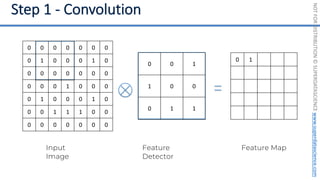
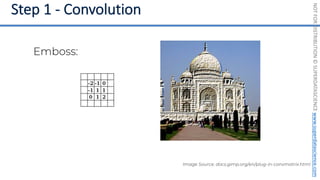
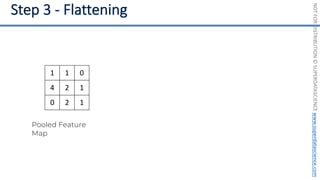
R Squared
𝑦 [tonnes]
(Potato yield)
𝑋! [kg]
(Nitrogen Fertilizer)
𝑦"
!
𝑦"
𝑦 [tonnes]
(Potato yield)
𝑋! [kg]
(Nitrogen Fertilizer)
𝑦"
𝑦#$%
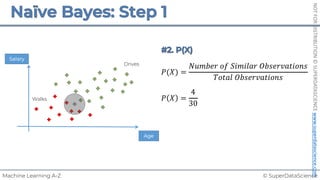
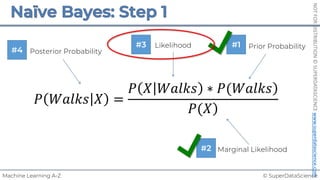
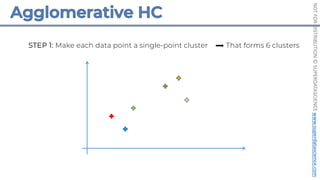
𝑆𝑆393 = 𝑆𝑈𝑀(𝑦$ − 𝑦:;5)#
𝑅# = 1 −
𝑆𝑆<=>
𝑆𝑆393
𝑆𝑈𝑀(𝑦$ − !
𝑦$)#
𝑆𝑆<=> =
Regression: Average:
Rule of thumb (for our tutorials)*:
1.0 = Perfect fit (suspicious)
~0.9 = Very good
<0.7 = Not great
<0.4 = Terrible
<0 = Model makes no sense for this data
*This is highly dependent on the context](https://image.slidesharecdn.com/machine-learning-a-z-course-downloadable-slides-v1-230302104430-56d42584/85/Machine-Learning-A-Z-Course-Downloadable-Slides-V1-5-pdf-28-320.jpg)


![© SuperDataScience
NOT
FOR
DISTRIBUTION
©
SUPERDATASCIENCE
www.superdatascience.com
R Squared
𝑦 [tonnes]
(Potato yield)
𝑋! [kg]
(Nitrogen Fertilizer)
𝑦"
!
𝑦"
𝑦 [tonnes]
(Potato yield)
𝑋! [kg]
(Nitrogen Fertilizer)
𝑦"
𝑦#$%
𝑆𝑆393 = 𝑆𝑈𝑀(𝑦$ − 𝑦:;5)#
𝑅# = 1 −
𝑆𝑆<=>
𝑆𝑆393
𝑆𝑈𝑀(𝑦$ − !
𝑦$)#
𝑆𝑆<=> =
Regression: Average:
Rule of thumb (for our tutorials)*:
1.0 = Perfect fit (suspicious)
~0.9 = Very good
<0.7 = Not great
<0.4 = Terrible
<0 = Model makes no sense for this data
*This is highly dependent on the context](https://image.slidesharecdn.com/machine-learning-a-z-course-downloadable-slides-v1-230302104430-56d42584/85/Machine-Learning-A-Z-Course-Downloadable-Slides-V1-5-pdf-93-320.jpg)


![© SuperDataScience
NOT
FOR
DISTRIBUTION
©
SUPERDATASCIENCE
www.superdatascience.com
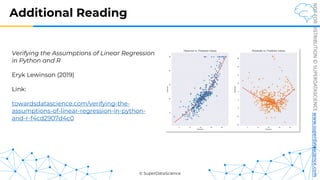
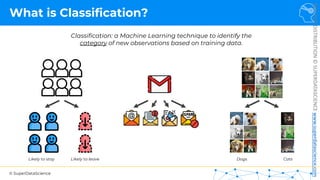
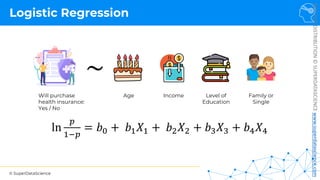
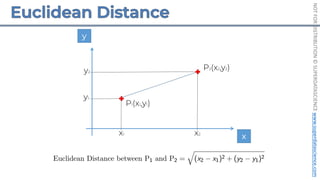
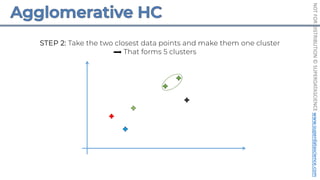
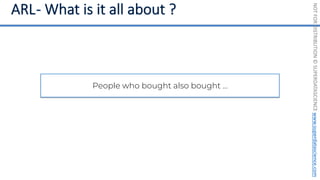
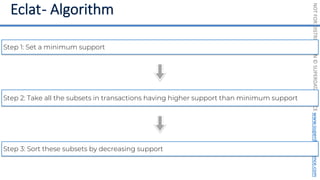
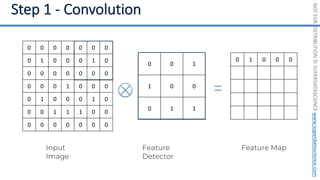
Logistic Regression
ln
𝑝
1 − 𝑝
= 𝑏! + 𝑏"𝑋"
~
Will purchase
health insurance:
Yes / No
Age
𝑦 [yes/no]
(Took up offer?)
𝑋! [yrs]
(Age)
YES
NO
18 60
≥ 50%
< 50%
81%
42%
NO
YES
35 45
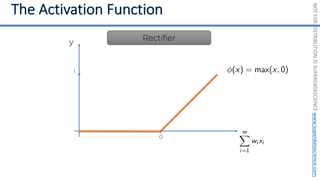
Logistic regression: predict a categorical
dependent variable from a number of
independent variables.](https://image.slidesharecdn.com/machine-learning-a-z-course-downloadable-slides-v1-230302104430-56d42584/85/Machine-Learning-A-Z-Course-Downloadable-Slides-V1-5-pdf-99-320.jpg)
![© SuperDataScience
NOT
FOR
DISTRIBUTION
©
SUPERDATASCIENCE
www.superdatascience.com
𝑦 [yes/no]
(Took up offer?)
𝑋! [yrs]
(Age)
YES
NO
18 60
Maximum Likelihood
𝑦 [yes/no]
(Took up offer?)
𝑋! [yrs]
(Age)
YES
NO
18 60
0.03 0.01
0.54
0.92
0.95 0.98
0.04
0.58
0.96
0.10
Likelihood = 0.00019939
Likelihood = 0.03 x 0.54 x 0.92 x 0.95 x 0.98 x (1 – 0.01) x (1 – 0.04) x (1 – 0.10) x (1 – 0.58) x (1 – 0.96)
1- 1-
1-
1-
1-](https://image.slidesharecdn.com/machine-learning-a-z-course-downloadable-slides-v1-230302104430-56d42584/85/Machine-Learning-A-Z-Course-Downloadable-Slides-V1-5-pdf-102-320.jpg)
![© SuperDataScience
NOT
FOR
DISTRIBUTION
©
SUPERDATASCIENCE
www.superdatascience.com
Maximum Likelihood
Likelihood = 0.00007418
Likelihood = 0.00012845
Likelihood = 0.00016553
𝑦 [yes/no]
(Took up offer?)
𝑋! [yrs]
(Age)
YES
NO
18 60
Likelihood = 0.00019939
Maximum Likelihood
Best Curve <=](https://image.slidesharecdn.com/machine-learning-a-z-course-downloadable-slides-v1-230302104430-56d42584/85/Machine-Learning-A-Z-Course-Downloadable-Slides-V1-5-pdf-103-320.jpg)


![NOT
FOR
DISTRIBUTION
©
SUPERDATASCIENCE
www.superdatascience.com
[0, 0, 0, 0, 0, 0, 0, 0, 0, 0, 0, 0, 0, 0, 0, 0, 0, 0, 0, 0, 0, 0, 0, 0, 0, ... , 0]
20,000 elements long
if badminton table](https://image.slidesharecdn.com/machine-learning-a-z-course-downloadable-slides-v1-230302104430-56d42584/85/Machine-Learning-A-Z-Course-Downloadable-Slides-V1-5-pdf-441-320.jpg)
![NOT
FOR
DISTRIBUTION
©
SUPERDATASCIENCE
www.superdatascience.com
[0, 0, 0, 0, 0, 0, 0, 0, 0, 0, 0, 0, 0, 0, 0, 0, 0, 0, 0, 0, 0, 0, 0, 0, 0, ... , 0]
20,000 elements long
SOS
EOS
Special
Words](https://image.slidesharecdn.com/machine-learning-a-z-course-downloadable-slides-v1-230302104430-56d42584/85/Machine-Learning-A-Z-Course-Downloadable-Slides-V1-5-pdf-442-320.jpg)
![NOT
FOR
DISTRIBUTION
©
SUPERDATASCIENCE
www.superdatascience.com
[0, 0, 0, 0, 0, 0, 0, 0, 0, 0, 0, 0, 0, 0, 0, 0, 0, 0, 0, 0, 0, 0, 0, 0, 0, ... , 0]
20,000 elements long
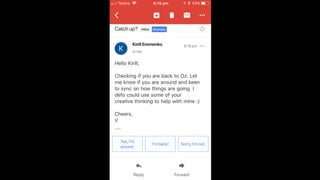
Hello Kirill, Checking if you are back to Oz. Let me know if you are around … Cheers, V](https://image.slidesharecdn.com/machine-learning-a-z-course-downloadable-slides-v1-230302104430-56d42584/85/Machine-Learning-A-Z-Course-Downloadable-Slides-V1-5-pdf-443-320.jpg)
![NOT
FOR
DISTRIBUTION
©
SUPERDATASCIENCE
www.superdatascience.com
[1, 1, 0, 0, 1, 0, 2, 0, 1, 0, 0, 0, 0, 0, 1, 2, 0, 0, 0, 1, 0, 0, 1, 0, 0, ... , 3]
20,000 elements long
Hello Kirill, Checking if you are back to Oz. Let me know if you are around … Cheers, V](https://image.slidesharecdn.com/machine-learning-a-z-course-downloadable-slides-v1-230302104430-56d42584/85/Machine-Learning-A-Z-Course-Downloadable-Slides-V1-5-pdf-444-320.jpg)
![NOT
FOR
DISTRIBUTION
©
SUPERDATASCIENCE
www.superdatascience.com
[1, 1, 0, 0, 1, 0, 2, 0, 1, 0, 0, 0, 0, 0, 1, 2, 0, 0, 0, 1, 0, 0, 1, 0, 0, ... , 3]
20,000 elements long
Hello Kirill, Checking if you are back to Oz. Let me know if you are around … Cheers, V](https://image.slidesharecdn.com/machine-learning-a-z-course-downloadable-slides-v1-230302104430-56d42584/85/Machine-Learning-A-Z-Course-Downloadable-Slides-V1-5-pdf-445-320.jpg)
![NOT
FOR
DISTRIBUTION
©
SUPERDATASCIENCE
www.superdatascience.com
[1, 1, 0, 0, 1, 0, 2, 0, 1, 0, 0, 0, 0, 0, 1, 2, 0, 0, 0, 1, 0, 0, 1, 0, 0, ... , 3]
20,000 elements long
Hello Kirill, Checking if you are back to Oz. Let me know if you are around … Cheers, V
Hey mate, have you read about Hinton’s capsule networks?
Training Data:
Did you like that recipe I sent you last week?
Hi Kirill, are you coming to dinner tonight?
Dear Kirill, would you like to service your car with us again?
Are you coming to Australia in December?
…](https://image.slidesharecdn.com/machine-learning-a-z-course-downloadable-slides-v1-230302104430-56d42584/85/Machine-Learning-A-Z-Course-Downloadable-Slides-V1-5-pdf-446-320.jpg)
![NOT
FOR
DISTRIBUTION
©
SUPERDATASCIENCE
www.superdatascience.com
[1, 1, 0, 0, 1, 0, 2, 0, 1, 0, 0, 0, 0, 0, 1, 2, 0, 0, 0, 1, 0, 0, 1, 0, 0, ... , 3]
20,000 elements long
Hello Kirill, Checking if you are back to Oz. Let me know if you are around … Cheers, V
Training Data:
…
[1, 1, 0, 0, 0, 1, 0, 0, 1, 1, 0, 0, 0, 0, 0, 1, 0, 1, 0, 1, 0, 0, 1, 0, 0, ... , 2]
[1, 1, 0, 0, 0, 0, 0, 1, 0, 0, 0, 0, 0, 0, 0, 2, 0, 0, 0, 1, 0, 0, 1, 0, 0, ... , 0]
[1, 1, 0, 0, 0, 0, 0, 1, 0, 0, 1, 0, 0, 0, 0, 1, 0, 0, 0, 1, 0, 0, 0, 0, 1, ... , 1]
[1, 1, 0, 0, 0, 0, 0, 1, 0, 0, 1, 0, 0, 0, 0, 1, 1, 0, 1, 0, 0, 0, 0, 0, 0, ... , 1]
[1, 1, 0, 0, 0, 0, 0, 0, 1, 0, 0, 0, 0, 0, 0, 1, 0, 0, 1, 1, 0, 0, 0, 1, 0, ... , 1]](https://image.slidesharecdn.com/machine-learning-a-z-course-downloadable-slides-v1-230302104430-56d42584/85/Machine-Learning-A-Z-Course-Downloadable-Slides-V1-5-pdf-447-320.jpg)
![NOT
FOR
DISTRIBUTION
©
SUPERDATASCIENCE
www.superdatascience.com
20,000 elements long
Hello Kirill, Checking if you are back to Oz. Let me know if you are around … Cheers, V
Training Data:
…
[1, 1, 0, 0, 0, 1, 0, 0, 1, 1, 0, 0, 0, 0, 0, 1, 0, 1, 0, 1, 0, 0, 1, 0, 0, ... , 2]
[1, 1, 0, 0, 0, 0, 0, 1, 0, 0, 0, 0, 0, 0, 0, 2, 0, 0, 0, 1, 0, 0, 1, 0, 0, ... , 0]
[1, 1, 0, 0, 0, 0, 0, 1, 0, 0, 1, 0, 0, 0, 0, 1, 0, 0, 0, 1, 0, 0, 0, 0, 1, ... , 1]
[1, 1, 0, 0, 0, 0, 0, 1, 0, 0, 1, 0, 0, 0, 0, 1, 1, 0, 1, 0, 0, 0, 0, 0, 0, ... , 1]
[1, 1, 0, 0, 0, 0, 0, 0, 1, 0, 0, 0, 0, 0, 0, 1, 0, 0, 1, 1, 0, 0, 0, 1, 0, ... , 1]
Image Source: www.helloacm.com
[1, 1, 0, 0, 1, 0, 2, 0, 1, 0, 0, 0, 0, 0, 1, 2, 0, 0, 0, 1, 0, 0, 1, 0, 0, ... , 3]
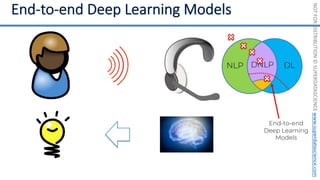
DL
NLP](https://image.slidesharecdn.com/machine-learning-a-z-course-downloadable-slides-v1-230302104430-56d42584/85/Machine-Learning-A-Z-Course-Downloadable-Slides-V1-5-pdf-448-320.jpg)


This document introduces the 'Machine Learning A-Z' course by SuperDataScience, outlining the course structure and emphasizing the learning journey with updated materials. It highlights the qualifications of instructors Kirill Eremenko and Hadelin de Ponteves, who have extensive experience in data science and machine learning. The document also covers important concepts in machine learning such as data preprocessing, regression analysis, and model-building techniques.