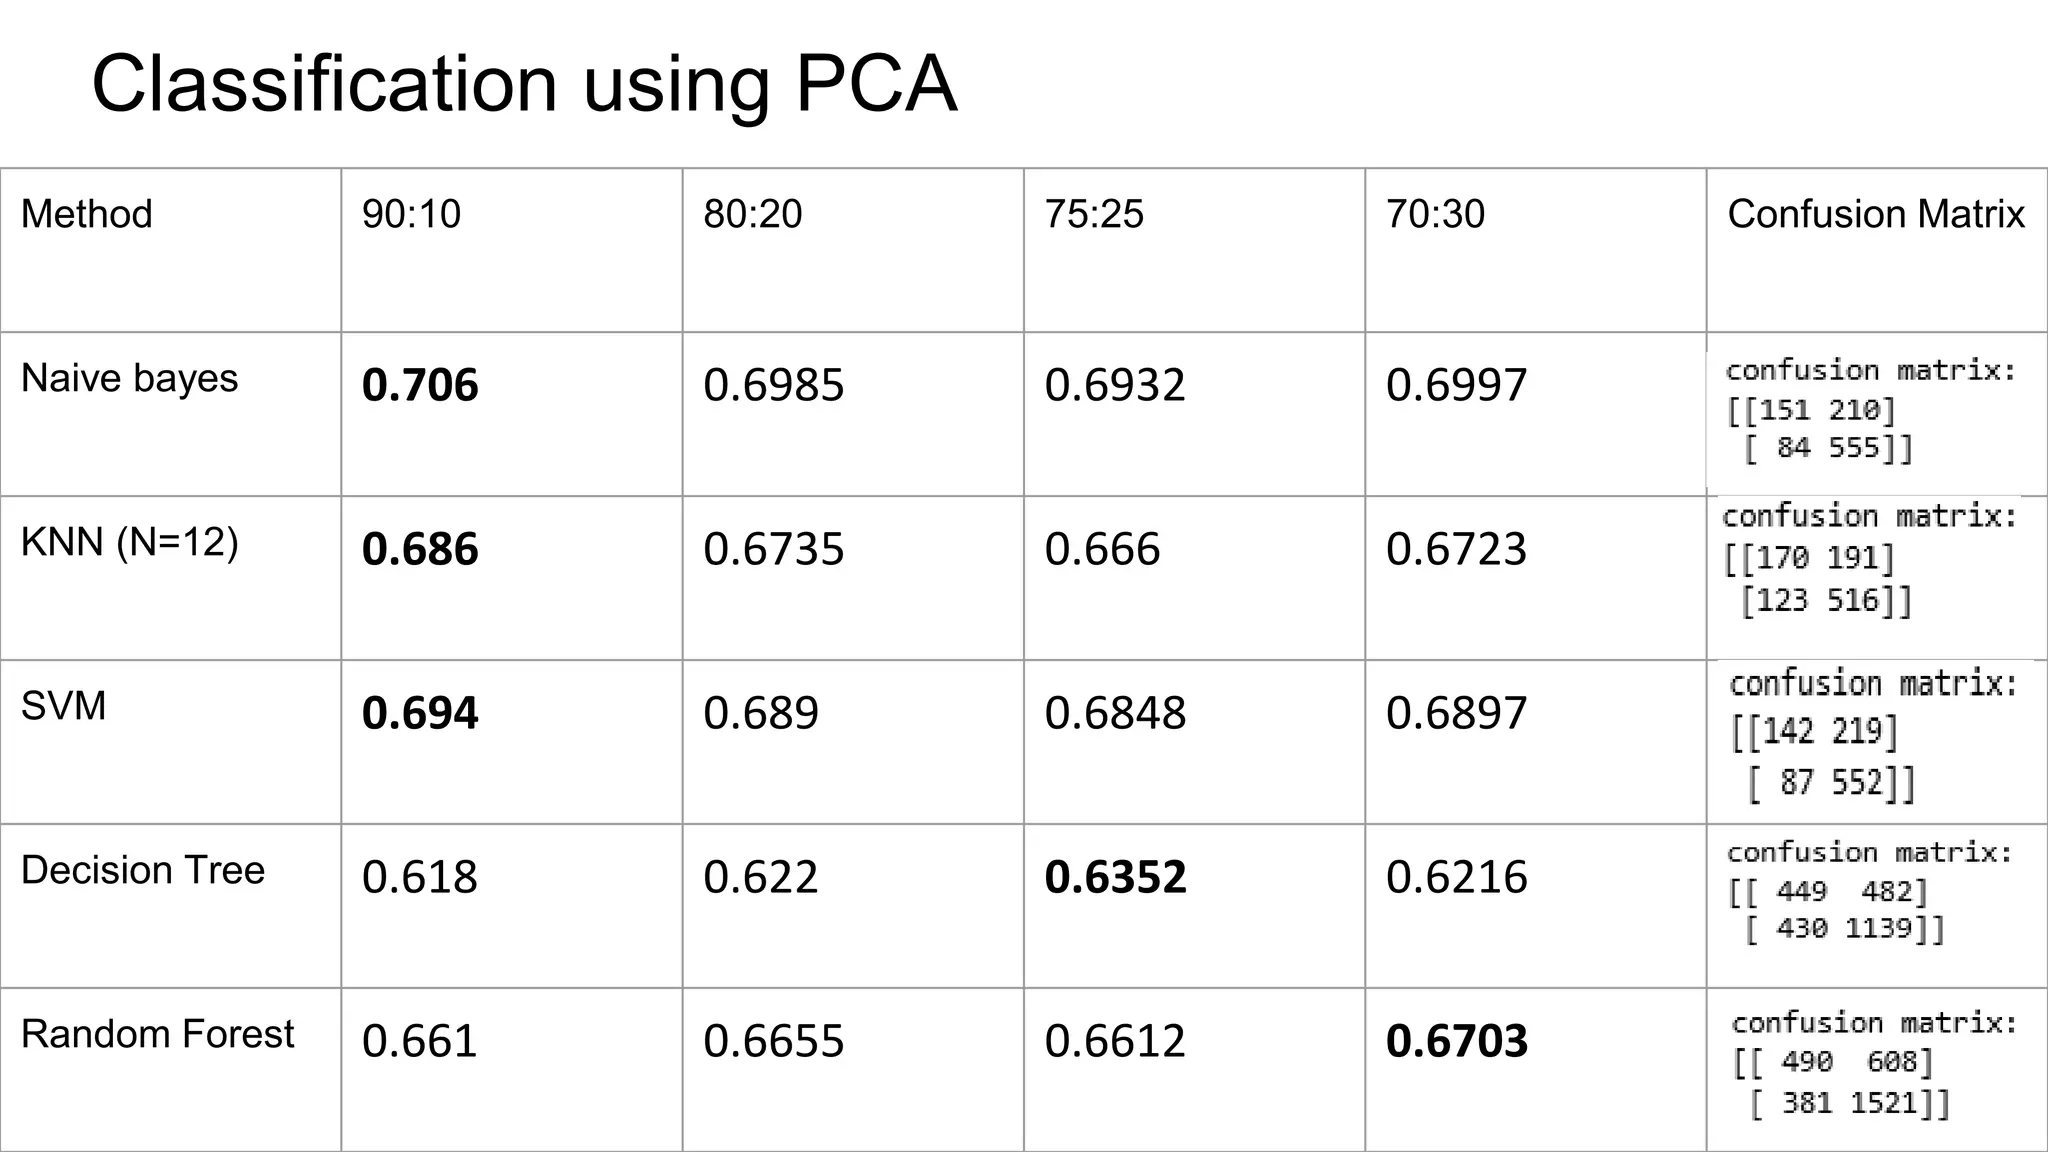
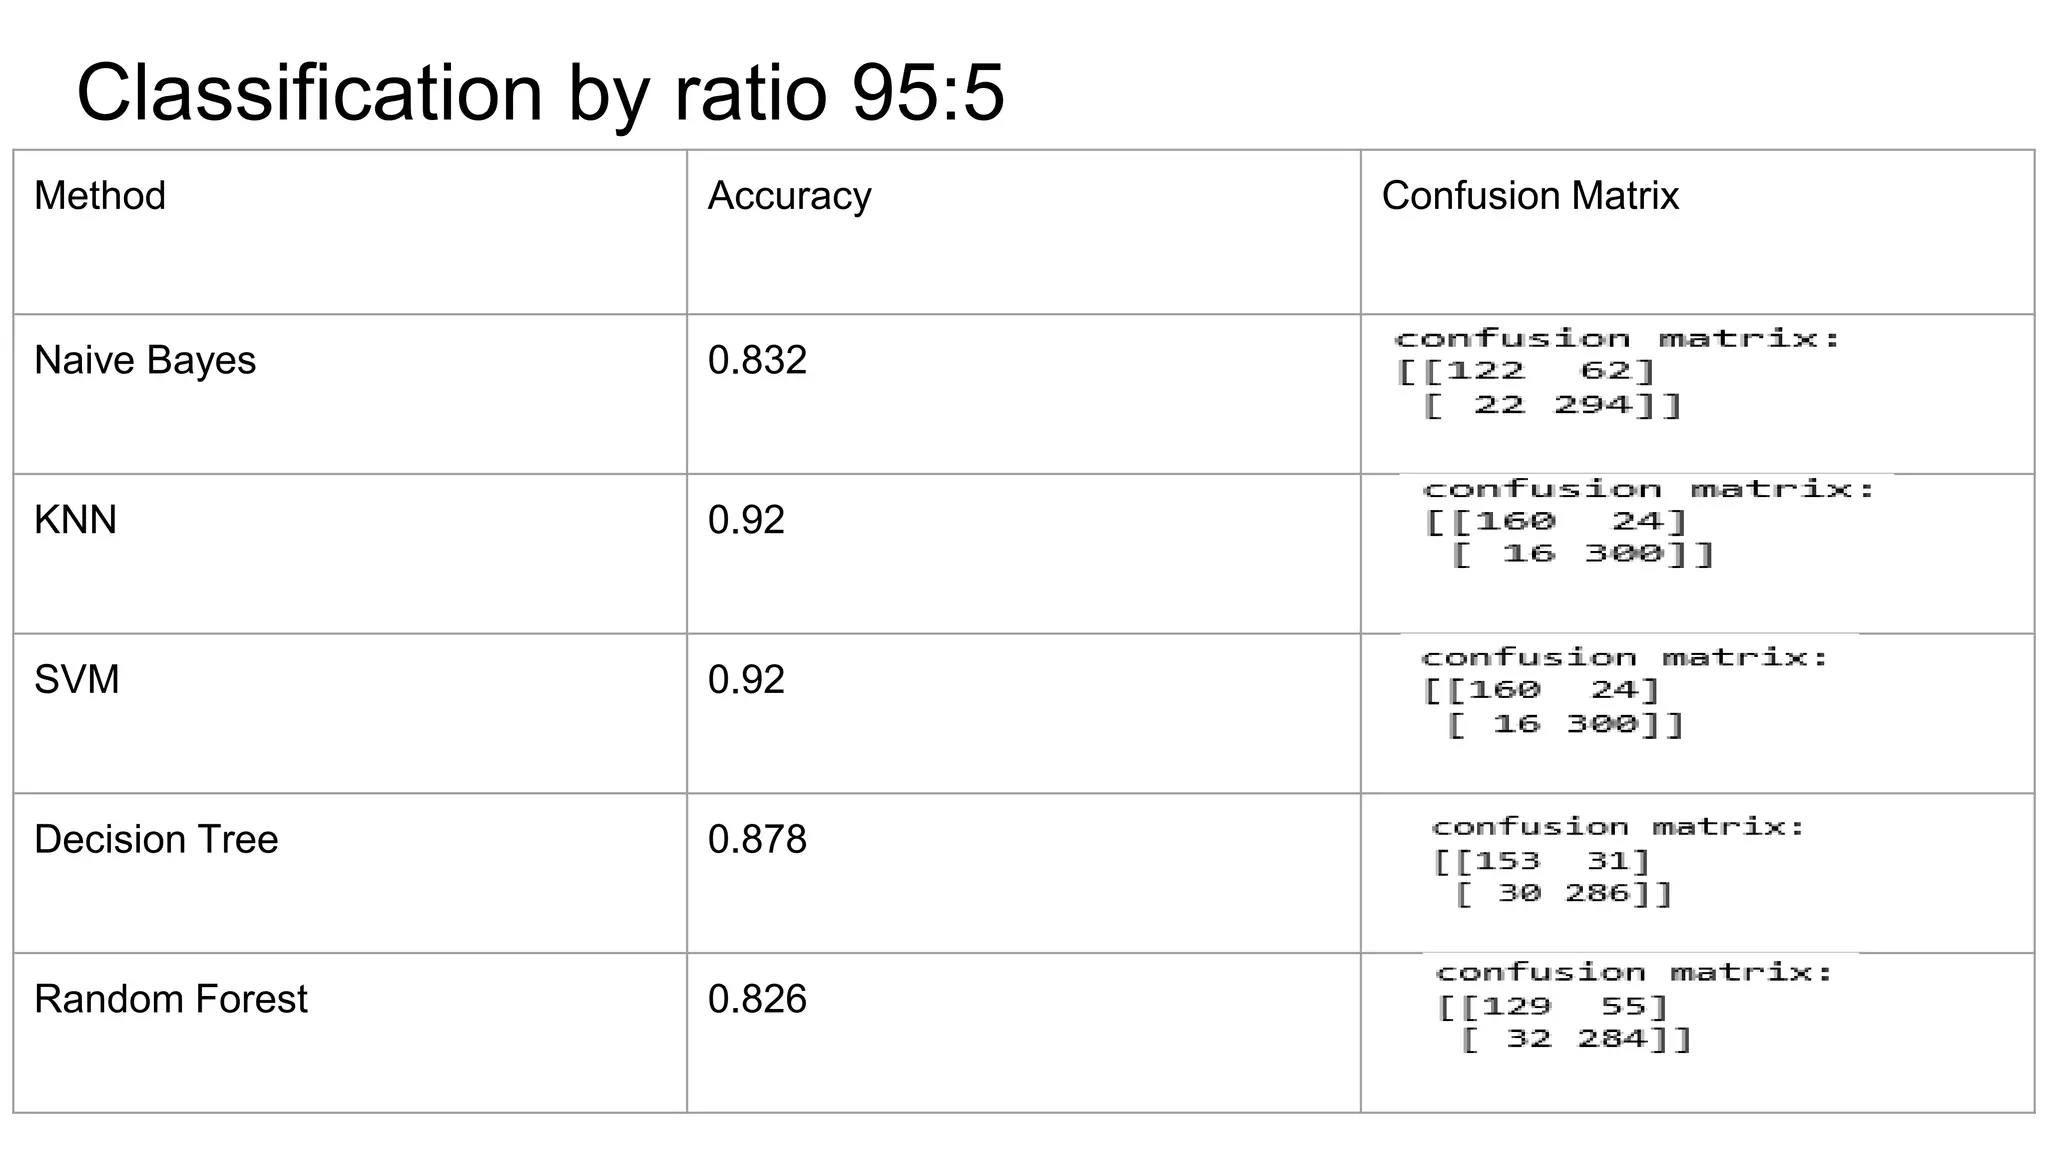
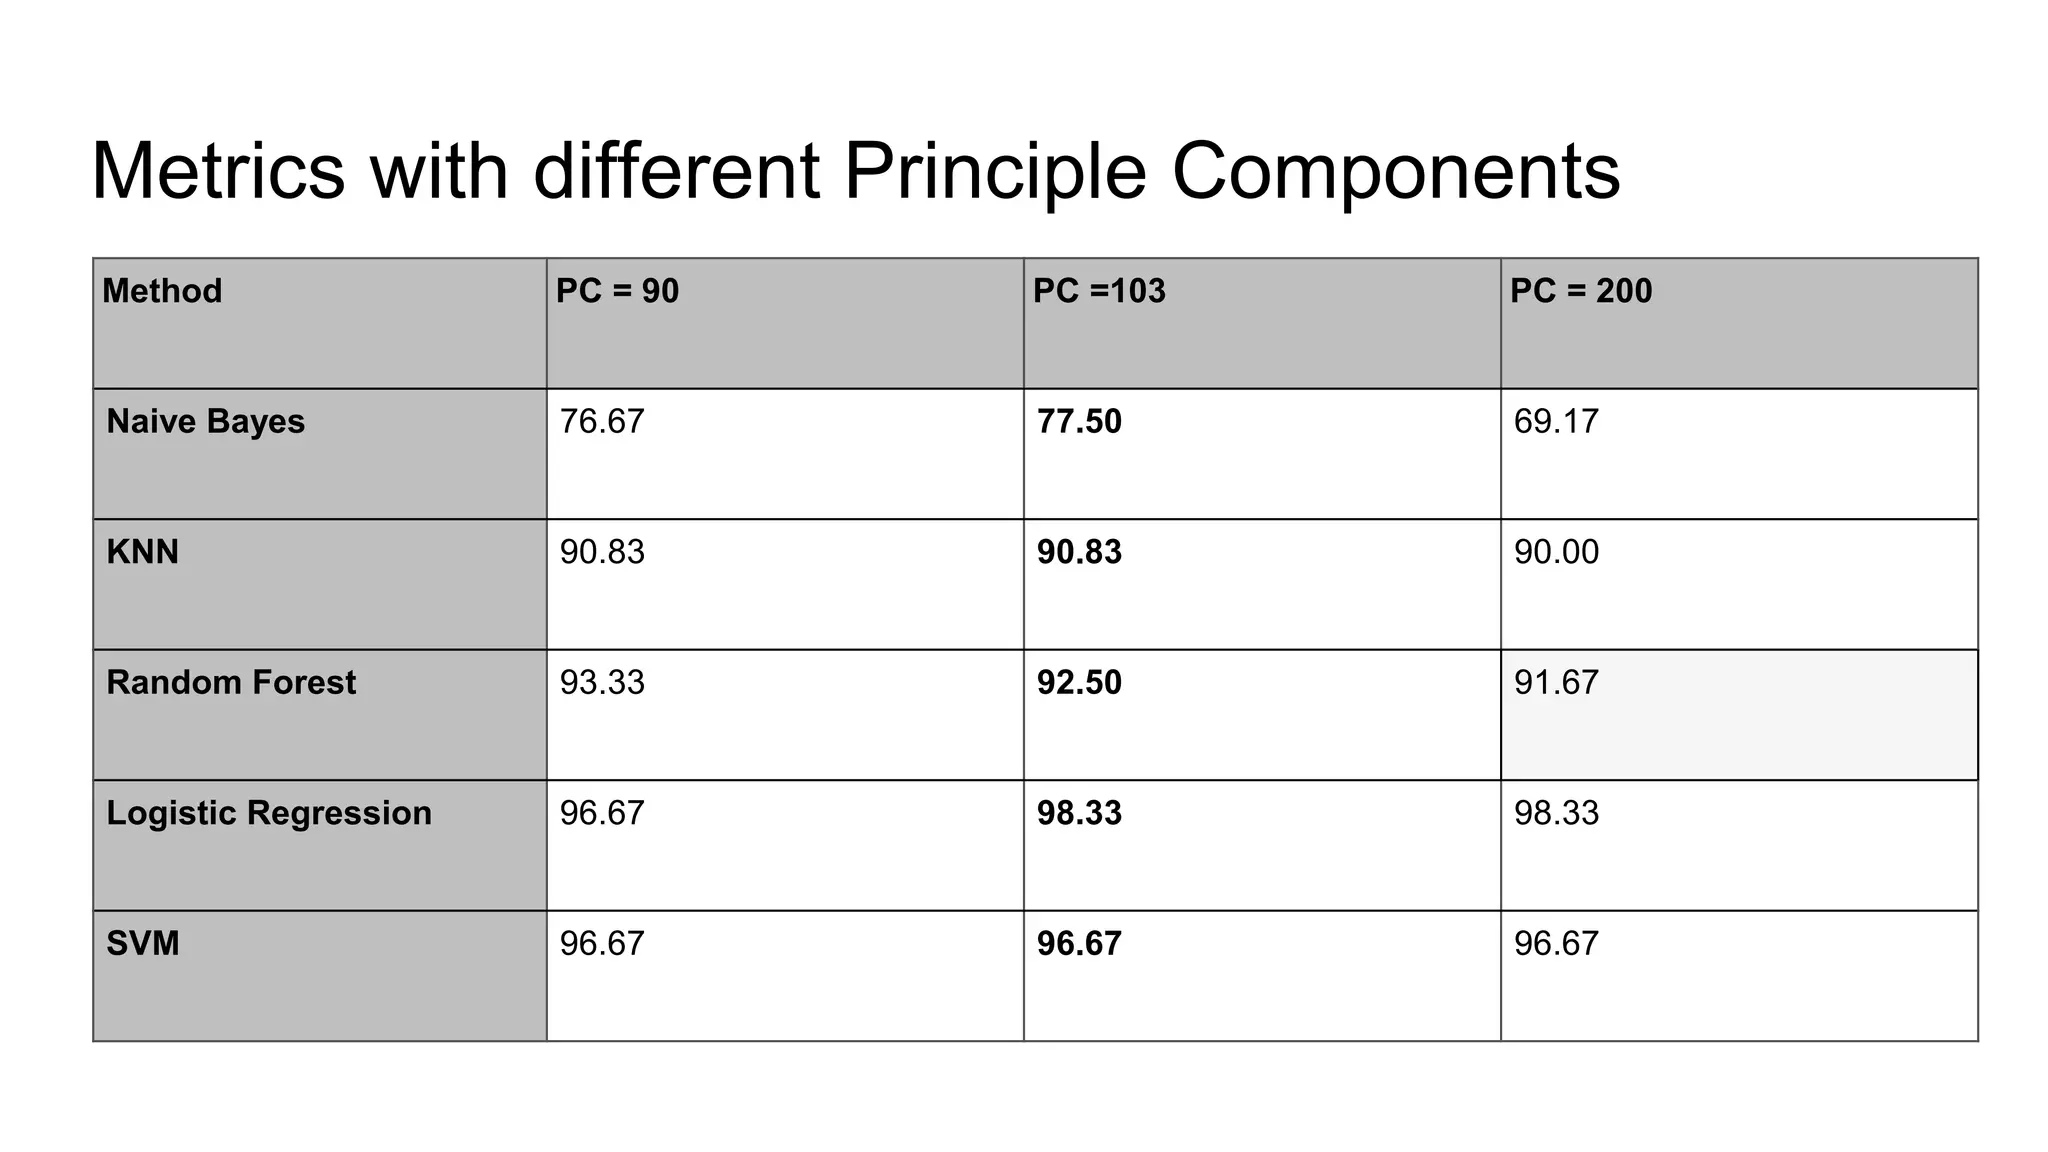
The document discusses the implementation of machine learning algorithms on two datasets: an electrical grid stability dataset and the Olivetti face recognition dataset. It details the classification of electrical grid stability and examines the performance of various algorithms, including Naive Bayes, KNN, SVM, Decision Tree, and Random Forest, with and without PCA transformation. The findings highlight that while some models achieved high accuracy, further feature selection and preprocessing are necessary to improve model performance, particularly on the electrical dataset.

![About Electricity Data Set
•Electrical Grid data set in which we have different attributes for examine the stability of
the system.
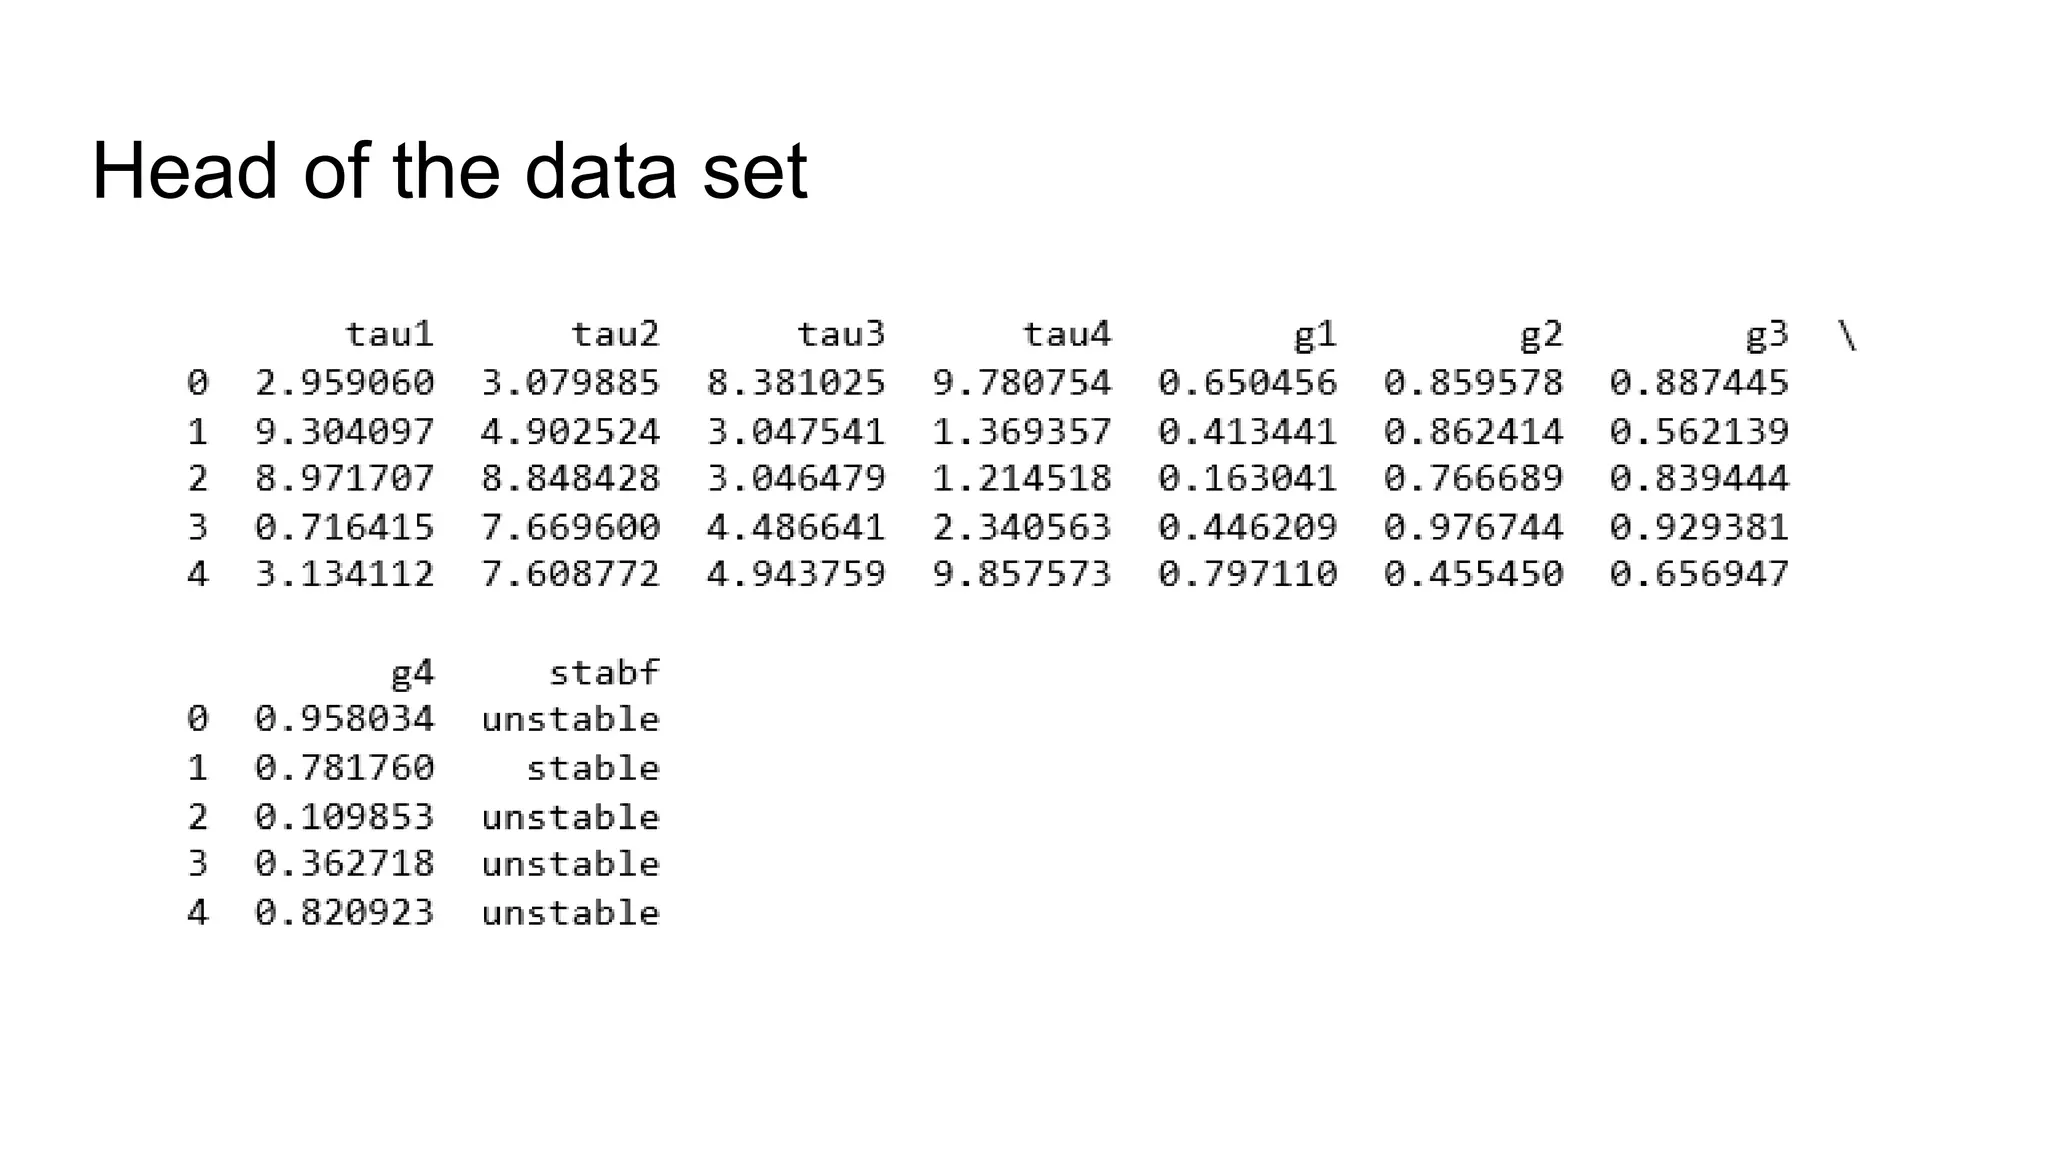
• We will examine the response of the system stability depends on 10,000 observations
and 13 attributes, 1 classes attribute (stabf). Attributes are given in dataset as;
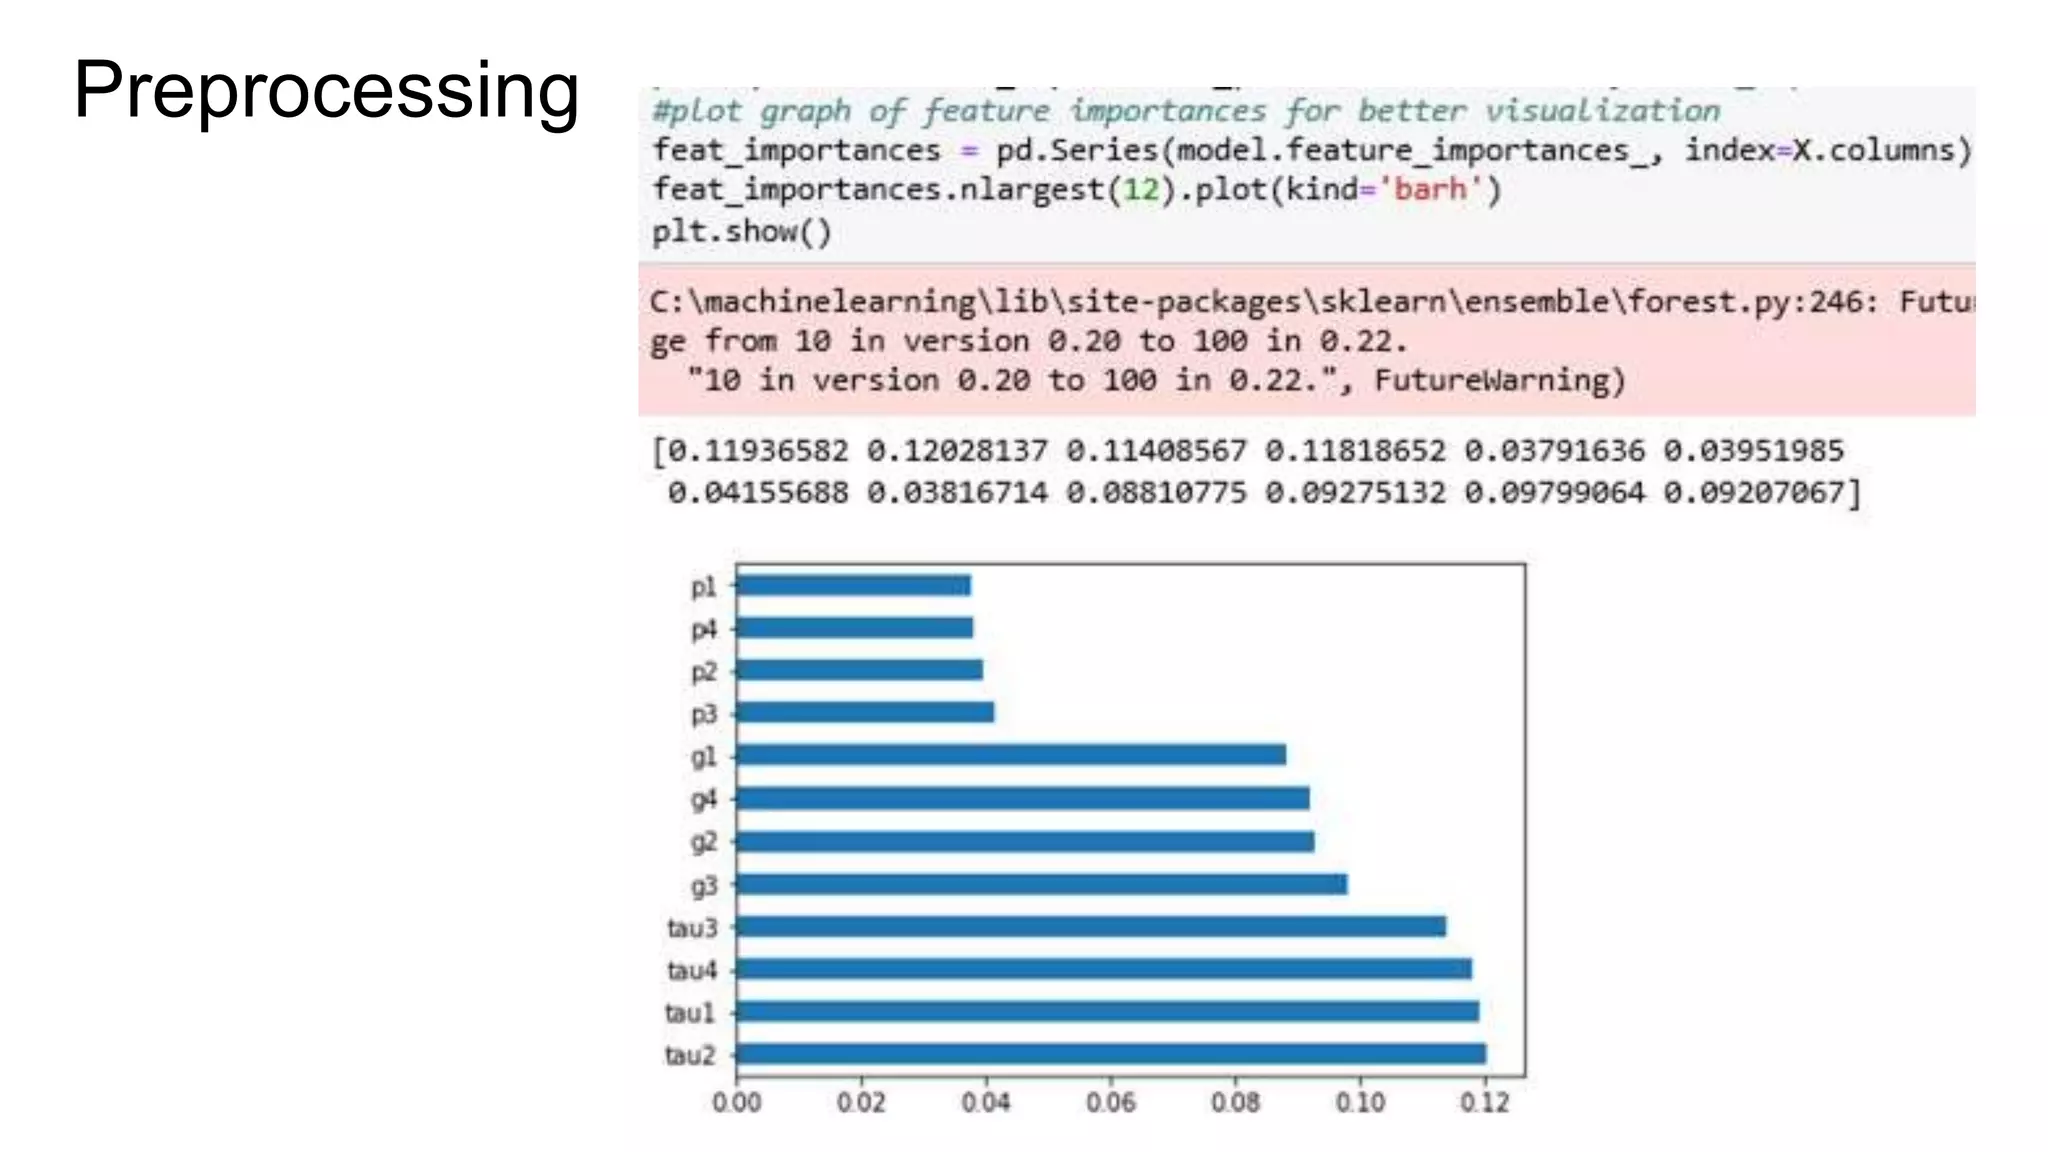
● tau[x] : Reaction time of participant (real from the range [0.5,10]s).
● p[x] : Nominal power consumed(negative)/produced(positive)(real).
● g[x] : Coefficient (gamma) proportional to price elasticity (real from the range
[0.05,1]s^-1).
● stab: The maximal real part of the characteristic equation root (if positive - the
system is linearly unstable)(real)
● stabf: The stability label of the system (stable/unstable)](https://image.slidesharecdn.com/mlprojectpresentation3-190804204130/75/Machine-Learning-project-presentation-3-2048.jpg)