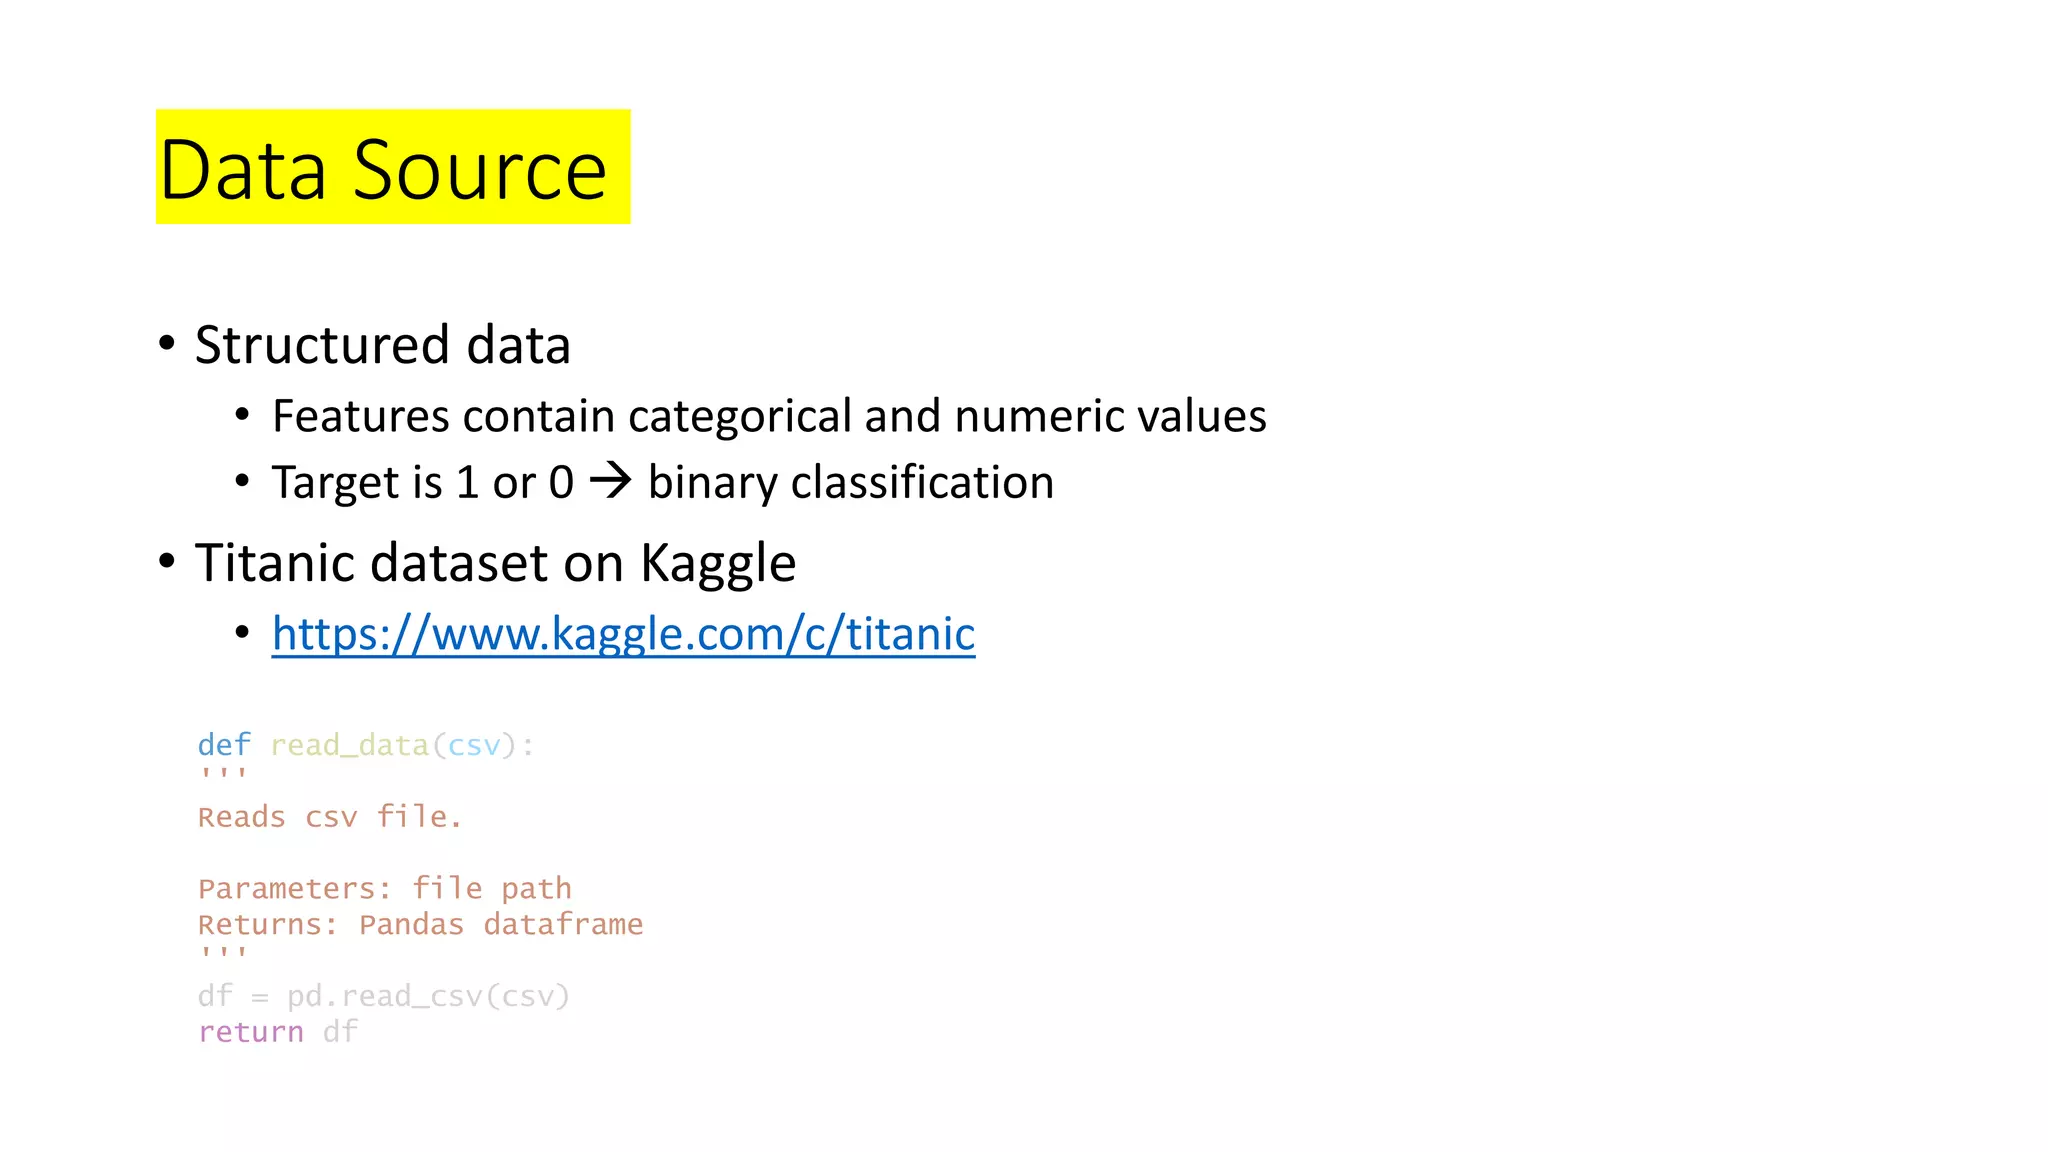
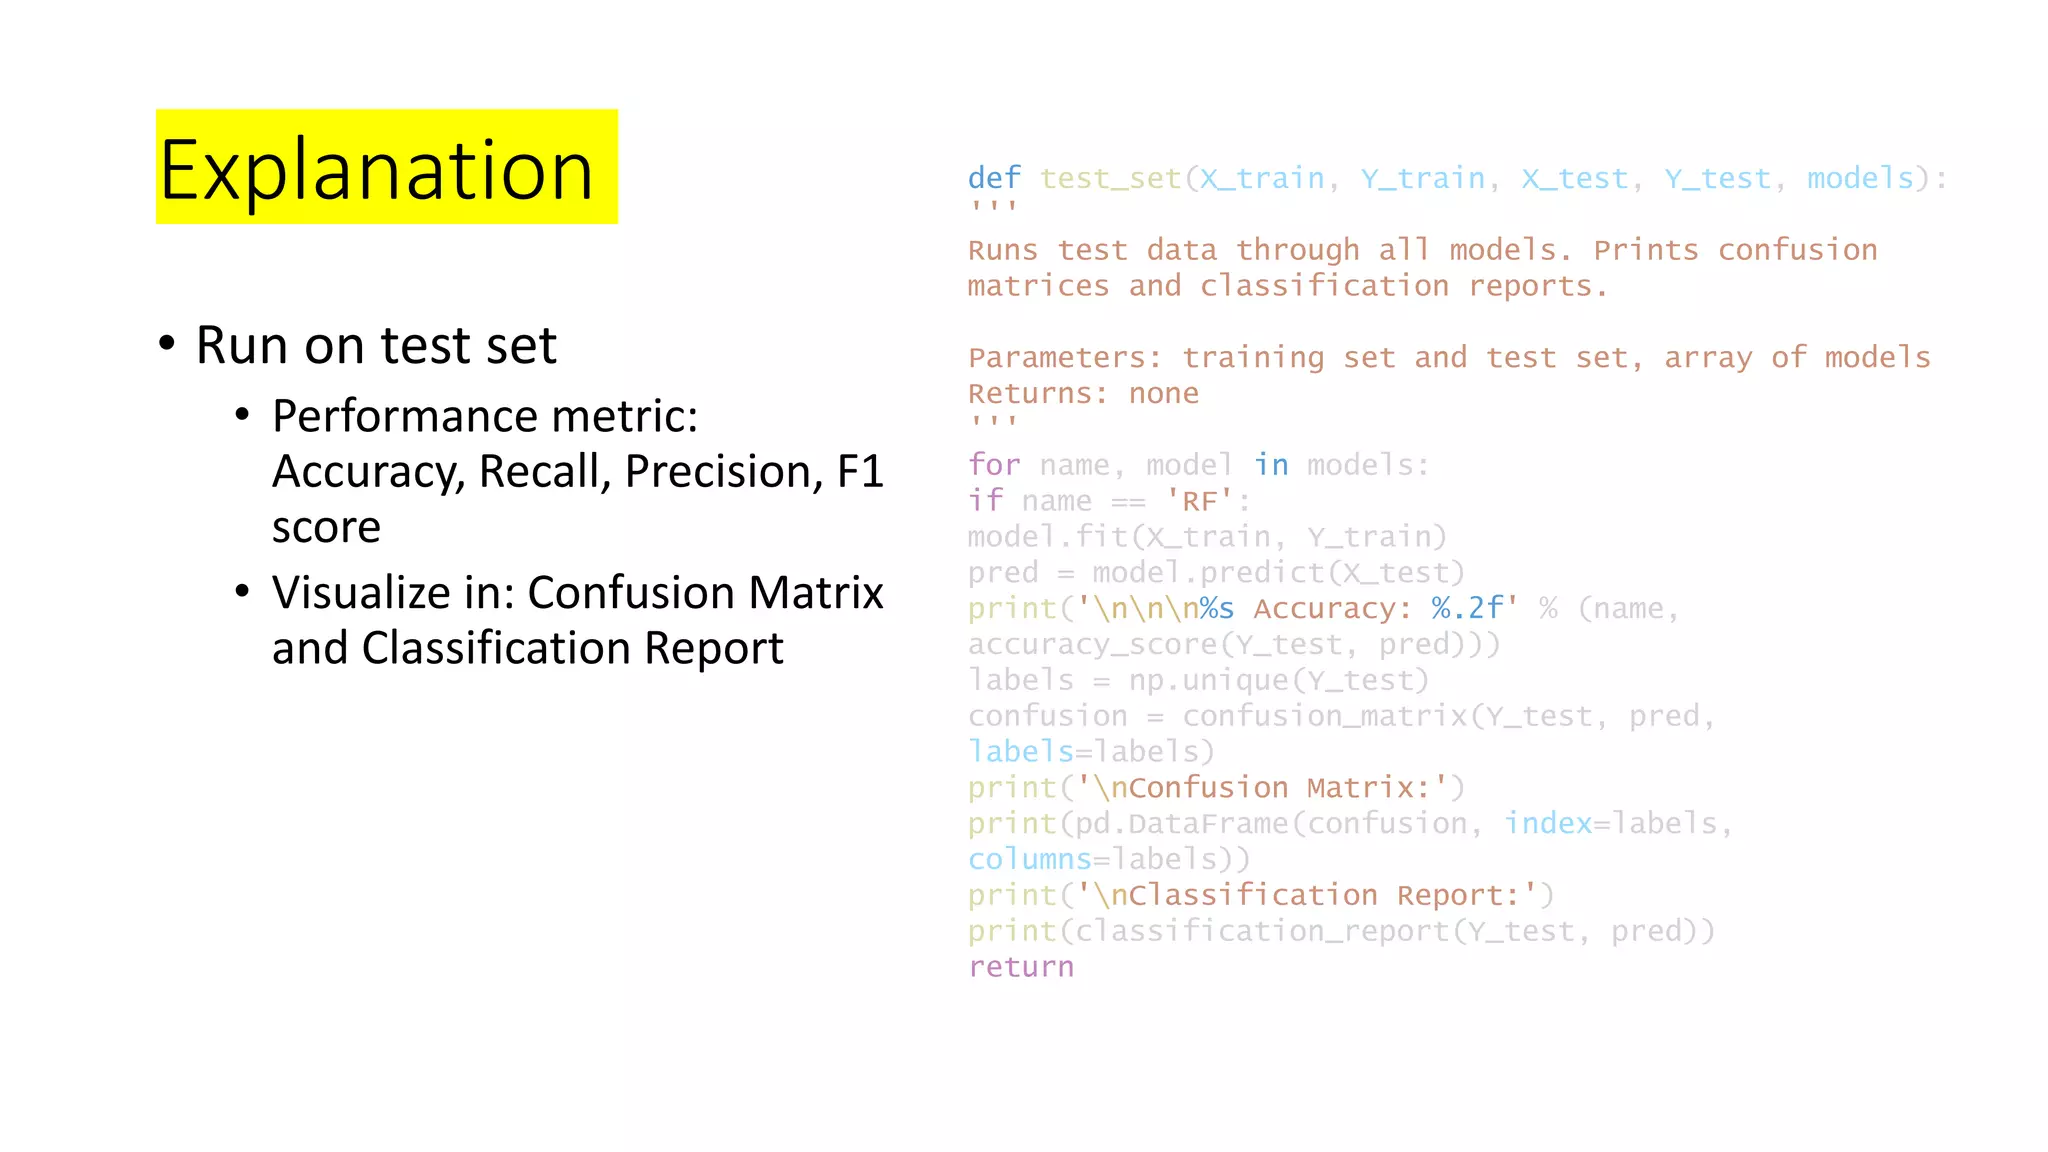
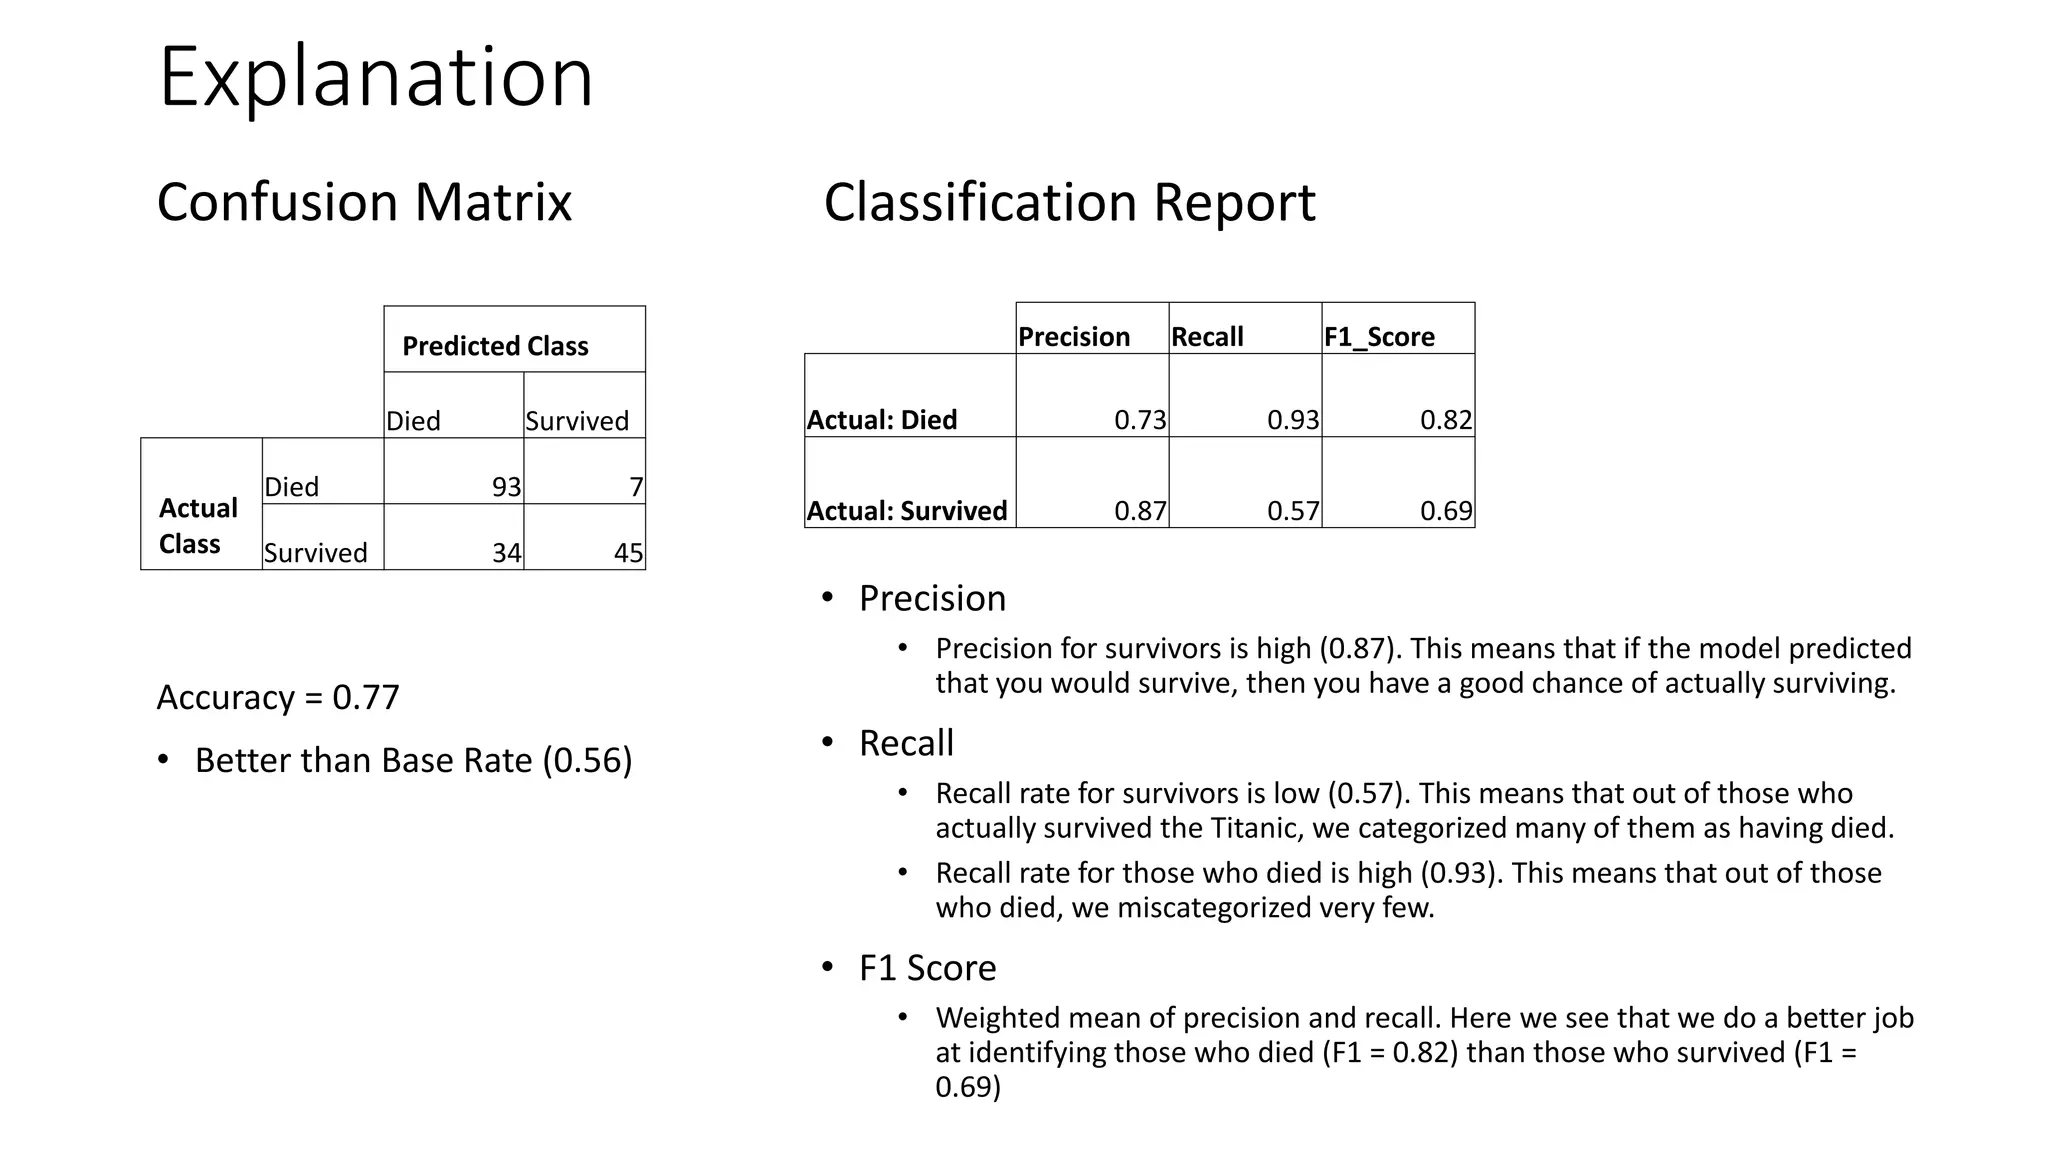
This document discusses building machine learning models to predict if Titanic passengers survived using a dataset from Kaggle. It outlines the steps of exploratory data analysis, data processing including encoding, standardization, and imputation, feature selection, splitting the data into training and test sets, building models like logistic regression, random forest and evaluating them on the test set using metrics like accuracy, confusion matrix and classification report. Random forest is found to have the best performance with an accuracy of 77% on the test set.


![Summary Statistics
• 5 # summary
• Mean, median, frequency
• Number of missing values
def summary_statistics(df):
'''
Prints summary statistics about data set.
Parameters: dataframe
Returns: none
'''
print(df[['Age','Parch','Fare']].describe())
print(df.isnull().sum())
print('%d instances and %d columns' % (df.shape[0],
df.shape[1]))
return
Variable # of missing values
Age 177
Cabin 682
Embarked 2
• How to treat missing values
• Age: transform to median
• Cabin: cabin number could give us useful
info like how close the person is to the
rescue boats. But since 687 out of 891
values are missing, deletion of column is
the better option here.
• Embarked: Very few rows missing, so
deletion of those two rows
imputation
deletion](https://image.slidesharecdn.com/wk5ppt1-190618150756/75/wk5ppt1_Titanic-6-2048.jpg)
![Data Visualization
• Waffle chart
• Scatter matrix
• Correlation matrix
def visualize(df):
'''
Visualizes data using waffle chart, scatter plot, and
correlation matrix.
Parameters: df
Returns: none
'''
# waffle
freq = df.Parch.value_counts()
fig = plt.figure(
FigureClass=Waffle,
rows=15,
values=list(freq.values),
labels=list(freq.index)
)
# scatter matrix
numeric_df =
df.drop(columns=['PassengerId','Name','Ticket'])
scatter_matrix(numeric_df, alpha=0.2, figsize=(9,9))
plt.show()
# correlation matrix
corr = df.corr()
corr.style.background_gradient()
plt.show()
return](https://image.slidesharecdn.com/wk5ppt1-190618150756/75/wk5ppt1_Titanic-7-2048.jpg)
![Data Processing
a. Encoding: turning categorical variables into numeric values
b. Standardizing: scale data into [0, 1] range
c. Imputation: replace null values with median
d. Feature Selection: manually or automatically select input variables
e. Split data into training and validation data sets](https://image.slidesharecdn.com/wk5ppt1-190618150756/75/wk5ppt1_Titanic-8-2048.jpg)
![Encoding Standardizing
def encoding(df):
'''
Converts all categorical variables into numeric
representations, i.e. encoding.
Parameters: dataframe
Returns: dataframe
'''
columns = df.columns.values
for c in columns:
dictionary = {}
def conversion(val):
return dictionary[val]
if df[c].dtype != np.int64 and df[c].dtype !=
np.float64:
unique = set(df[c].values.tolist())
x = 0
for u in unique:
dictionary[u] = x
x += 1
df[c] = list(map(conversion, df[c]))
return df
def standardize(df, variable_name):
'''
Standardizes variable by scaling to range [0, 1].
Parameters: dataframe, name of variable to standardize
Returns: dataframe
'''
variable = pd.DataFrame(df[variable_name])
standardized_variable =
preprocessing.MinMaxScaler().fit_transform(variable)
df[variable_name] = standardized_variable
return df
Imputation
def imputation_null_median(df):
df['Age'] = df['Age'].fillna(df['Age'].median())
df['Embarked'] =
df['Embarked'].fillna(df['Embarked'].median())
return df
These machine learning algorithms only
understand numbers.
Algorithms that exploit distances or similarities like KNN or SVM need to be
standardized. Graphical classifiers like tree-based models do not share this
need, although it is a good idea.
Replace null with median.](https://image.slidesharecdn.com/wk5ppt1-190618150756/75/wk5ppt1_Titanic-9-2048.jpg)
![Feature Selection
• Remove variables like Passenger ID, Ticket ID because primary keys
have no predictive power
• Remove variables with too many NULL values
def choose_features(df):
'''
Splits available data into 80% training set, 20% test
set.
Parameters: dataframe
Returns: array of X, array of Y
'''
# 80% training set, 20% test set
array = df.values
X = array[:,[2, 4, 5, 6, 7, 9, 11]]
Y = array[:,1]
return X, Y](https://image.slidesharecdn.com/wk5ppt1-190618150756/75/wk5ppt1_Titanic-10-2048.jpg)

![Model Building code
def build_model(X_train, Y_train):
'''
Runs training data through Logistic Regression, Linear
Discriminant Analysis, KNN, Decision Tree, Random
Forest, Naive Bayes, and Support Vector Machine.
Parameters: training set - features and output
Returns: array of models
'''
models = []
models.append(('LR',
LogisticRegression(solver='liblinear',
multi_class='ovr')))
models.append(('KNN', KNeighborsClassifier()))
models.append(('CART', DecisionTreeClassifier()))
models.append(('RF',
RandomForestClassifier(n_estimators = 100,
max_depth=5)))
models.append(('NB', GaussianNB()))
models.append(('SVM', SVC(gamma='auto')))
return models
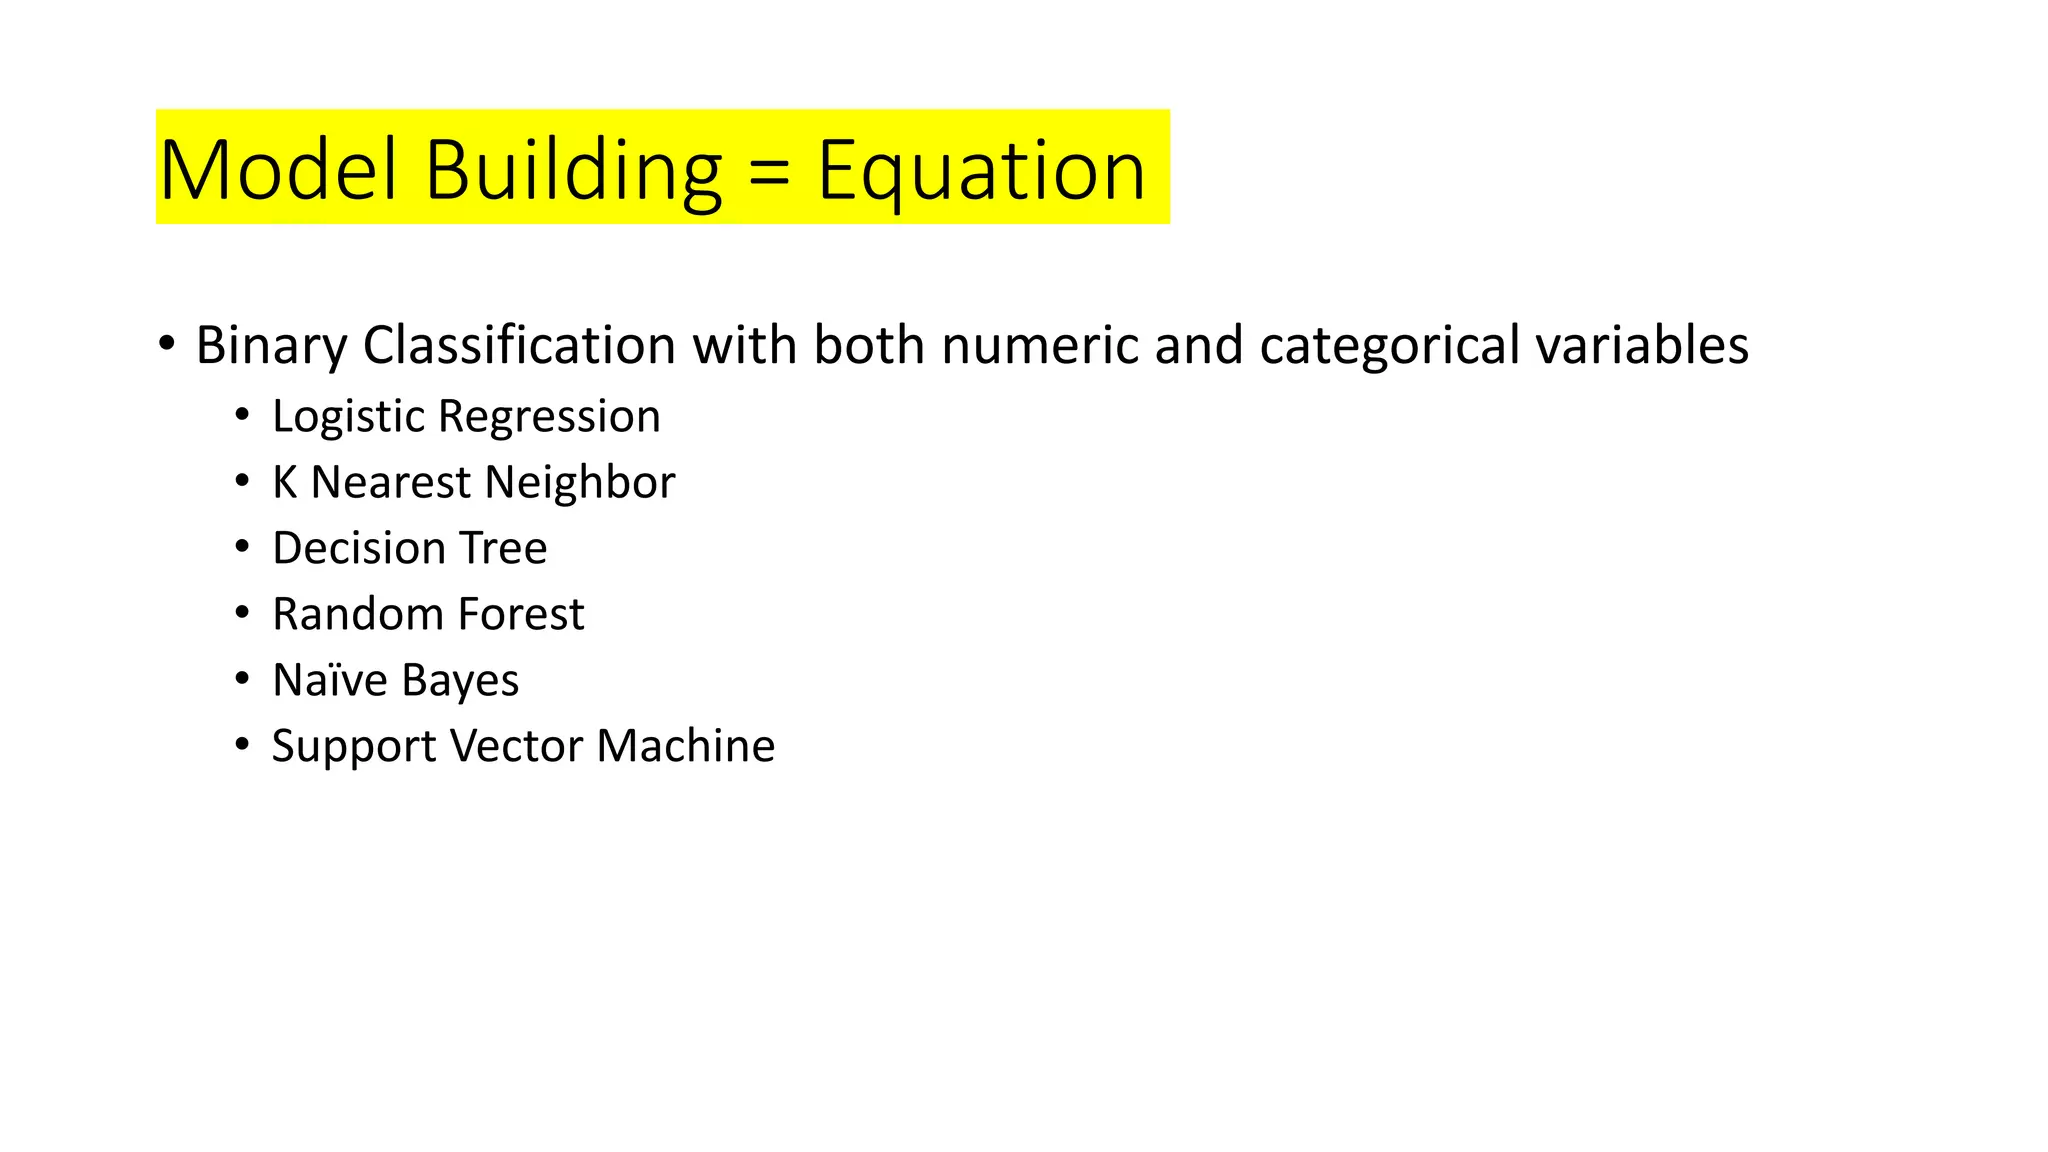
• Logistic Regression
• K Nearest Neighbor
• Decision Tree
• Random Forest
• Naïve Bayes
• Support Vector Machine](https://image.slidesharecdn.com/wk5ppt1-190618150756/75/wk5ppt1_Titanic-14-2048.jpg)
![Estimation
• Gini Impurity
• The features with the most predictive power are Sex, Fare, and Pclass
Feature Gini Index
Sex 0.47
Fare 0.18
Pclass 0.13
Age 0.1
Parch 0.04
SibSp 0.04
Embarked 0.04
def estimate_4e(models, X_train, Y_train, X_test, df):
'''
Examines feature importance using Gini impurity.
Parameters: models, training set, test set, dataframe
Returns: none
'''
random_forest = models[3][1]
keys = df.keys()
keys = keys[[2, 4, 5, 6, 7, 9, 11]]
models[3][1].fit(X_train, Y_train)
pred = models[3][1].predict(X_test)
print(sorted(zip(map(lambda x: round(x, 4),
random_forest.feature_importances_), keys),
reverse=True))
return](https://image.slidesharecdn.com/wk5ppt1-190618150756/75/wk5ppt1_Titanic-15-2048.jpg)
![Accuracy Error Bars
def evaluate_accuracy(models, X_train, Y_train):
'''
Parameters: array of models, training set - features
and output
Returns: array of names, models, means, and stds
'''
results = []
means = []
stds = []
names = []
scoring = 'accuracy'
seed = 12
for name, model in models:
kfold = model_selection.KFold(n_splits=10,
random_state=seed)
cv_results = model_selection.cross_val_score(model,
X_train, Y_train, cv=kfold, scoring=scoring)
results.append(cv_results)
means.append(cv_results.mean())
stds.append(cv_results.std())
names.append(name)
msg = '%s: %f (%f)' % (name, cv_results.mean(),
cv_results.std())
print(msg)
return names, models, means, stds
def evaluate_error_bar(names, models, means, stds):
'''
Compares accuracy of models with Error Bar graph.
Parameters: array of names, models, means, stds
Returns: none
'''
# error bar
fig = plt.figure()
fig.suptitle('Algorithm Comparison')
ax = fig.add_subplot(1, 1, 1)
ax.set_xticklabels(names)
plt.errorbar(names, means, stds, linestyle='None', marker='^')
plt.show()
return
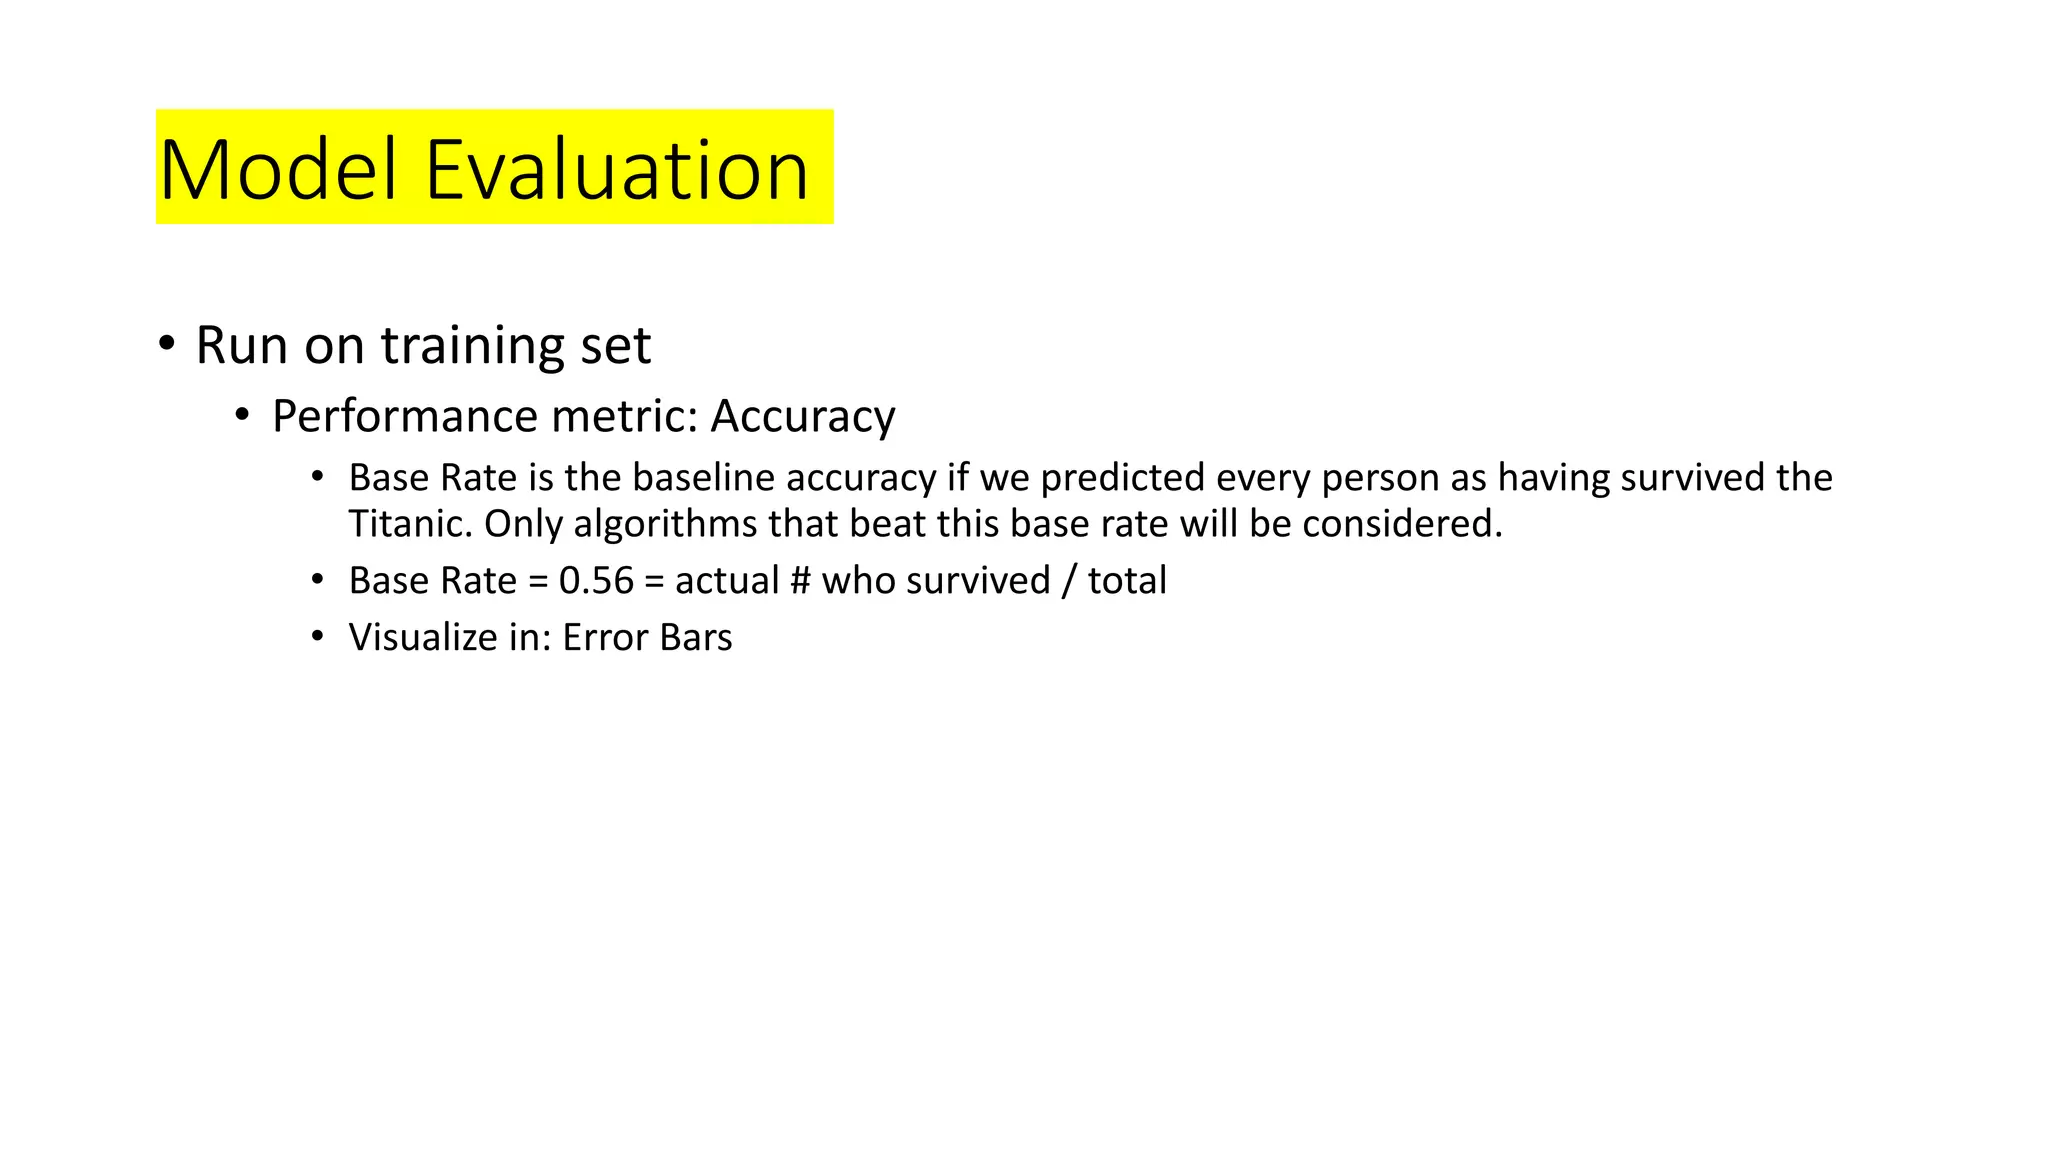
Here we select
Random Forest,
which has the
highest accuracy.](https://image.slidesharecdn.com/wk5ppt1-190618150756/75/wk5ppt1_Titanic-17-2048.jpg)


![Lec 9 05_sept [compatibility mode]](https://cdn.slidesharecdn.com/ss_thumbnails/lec905septcompatibilitymode-130917013819-phpapp01-thumbnail.jpg?width=640&height=640&fit=bounds)


![Lec 8 03_sept [compatibility mode]](https://cdn.slidesharecdn.com/ss_thumbnails/lec803septcompatibilitymode-130917013815-phpapp02-thumbnail.jpg?width=640&height=640&fit=bounds)


![[DevDay2019] Python Machine Learning with Jupyter Notebook - By Nguyen Huu Th...](https://cdn.slidesharecdn.com/ss_thumbnails/thongnguyen-devday2019pythonmlwithjupyternotebook-190408093340-thumbnail.jpg?width=640&height=640&fit=bounds)