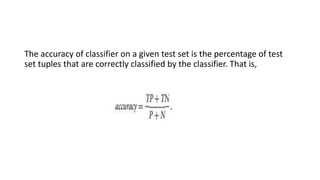
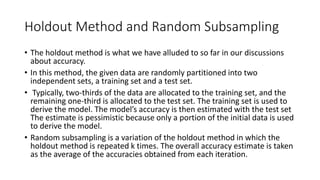
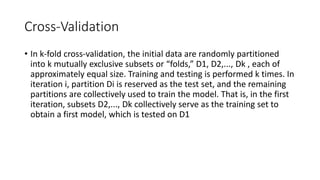
MODEL EVALUATION
METRICS FOR EVALUATING CLASSIFIER
Positive tuples (tuples of the main class of interest)
Negative tuples (all other tuples)
Evaluation measures. Note that some measures are known by more
than one name.
TP,TN,FP,P, N refer to the number of true positive, true negative, false
positive, positive
• True positives (TP): These refer to the positive tuples that were correctly labeled by
the classifier. Let TP be the number of true positives.
• True negatives(TN): These are the negative tuples that were correctly labeled by the
classifier. Let TN be the number of true negatives.
• False positives (FP): These are the negative tuples that were incorrectly labeled as
positive (e.g., tuples of class buys computer = no for which the classifier predicted
buys computer = yes). Let FP be the number of false positives.
• False negatives (FN): These are the positive tuples that were mislabeled as negative (e.g.,
tuples of class buys computer = yes for which the classifier predicted
buys computer = no). Let FN be the number of false negatives
CONFUSION MATRIX
Training Bayesian Belief Network
The accuracy of classifier on a given test set is the percentage of test
set tuples that are correctly classified by the classifier. That is,
The sensitivity and specificity measures can be used, respectively, for
this purpose.
Sensitivity is also referred to as the true positive (recognition) rate (i.e.,
the proportion of positive tuples that are correctly identified),
while specificity is the true negative rate (i.e., the proportion of
negative tuples that are correctly identified).
These measures are defined a
• The precision and recall measures are also widely used in
classification. Precision can be thought of as a measure of exactness
(i.e., what percentage of tuples labeled as positive are actually such),
whereas recall is a measure of Completeness
Holdout Method and Random Subsampling
• The holdout method is what we have alluded to so far in our discussions
about accuracy.
• In this method, the given data are randomly partitioned into two
independent sets, a training set and a test set.
• Typically, two-thirds of the data are allocated to the training set, and the
remaining one-third is allocated to the test set. The training set is used to
derive the model. The model’s accuracy is then estimated with the test set
The estimate is pessimistic because only a portion of the initial data is used
to derive the model.
• Random subsampling is a variation of the holdout method in which the
holdout method is repeated k times. The overall accuracy estimate is taken
as the average of the accuracies obtained from each iteration.
Cross-Validation
• In k-fold cross-validation, the initial data are randomly partitioned
into k mutually exclusive subsets or “folds,” D1, D2,..., Dk , each of
approximately equal size. Training and testing is performed k times. In
iteration i, partition Di is reserved as the test set, and the remaining
partitions are collectively used to train the model. That is, in the first
iteration, subsets D2,..., Dk collectively serve as the training set to
obtain a first model, which is tested on D1
Bayesian Belief Networks
Bayesian belief networks—probabilistic graphical models, which unlike
naïve Bayesian classifiers allow the representation of dependencies
among subsets of attributes.
If an arc is drawn from a node Y to a node Z, then Y is a parent or
immediate predecessor of Z, and Z is a descendant
of Y. Each variable is conditionally independent of its nondescendants
in the graph, given its parents
• A belief network has one conditional probability table (CPT) for each
variable. The CPT for a variable Y specifies the conditional distribution
P(Y|Parents(Y)), where Parents(Y) are the parents of Y
The conditional probability for each known value of LungCancer is
given for each possible combination of the values of its parents. For
instance, from the upper leftmost and bottom rightmost entries,
respectively, we see that P(LungCancer = yes|FamilyHistory = yes,
Smoker = yes) = 0.8 P(LungCancer = no |FamilyHistory = no, Smoker =
no) = 0.9.

MODEL EVALUATION.pptx

  • 1.
  • 2.
    METRICS FOR EVALUATINGCLASSIFIER Positive tuples (tuples of the main class of interest) Negative tuples (all other tuples)
  • 3.
    Evaluation measures. Notethat some measures are known by more than one name. TP,TN,FP,P, N refer to the number of true positive, true negative, false positive, positive
  • 5.
    • True positives(TP): These refer to the positive tuples that were correctly labeled by the classifier. Let TP be the number of true positives. • True negatives(TN): These are the negative tuples that were correctly labeled by the classifier. Let TN be the number of true negatives. • False positives (FP): These are the negative tuples that were incorrectly labeled as positive (e.g., tuples of class buys computer = no for which the classifier predicted buys computer = yes). Let FP be the number of false positives. • False negatives (FN): These are the positive tuples that were mislabeled as negative (e.g., tuples of class buys computer = yes for which the classifier predicted buys computer = no). Let FN be the number of false negatives
  • 6.
  • 7.
  • 9.
    The accuracy ofclassifier on a given test set is the percentage of test set tuples that are correctly classified by the classifier. That is,
  • 10.
    The sensitivity andspecificity measures can be used, respectively, for this purpose. Sensitivity is also referred to as the true positive (recognition) rate (i.e., the proportion of positive tuples that are correctly identified), while specificity is the true negative rate (i.e., the proportion of negative tuples that are correctly identified). These measures are defined a
  • 13.
    • The precisionand recall measures are also widely used in classification. Precision can be thought of as a measure of exactness (i.e., what percentage of tuples labeled as positive are actually such), whereas recall is a measure of Completeness
  • 14.
    Holdout Method andRandom Subsampling • The holdout method is what we have alluded to so far in our discussions about accuracy. • In this method, the given data are randomly partitioned into two independent sets, a training set and a test set. • Typically, two-thirds of the data are allocated to the training set, and the remaining one-third is allocated to the test set. The training set is used to derive the model. The model’s accuracy is then estimated with the test set The estimate is pessimistic because only a portion of the initial data is used to derive the model. • Random subsampling is a variation of the holdout method in which the holdout method is repeated k times. The overall accuracy estimate is taken as the average of the accuracies obtained from each iteration.
  • 15.
    Cross-Validation • In k-foldcross-validation, the initial data are randomly partitioned into k mutually exclusive subsets or “folds,” D1, D2,..., Dk , each of approximately equal size. Training and testing is performed k times. In iteration i, partition Di is reserved as the test set, and the remaining partitions are collectively used to train the model. That is, in the first iteration, subsets D2,..., Dk collectively serve as the training set to obtain a first model, which is tested on D1
  • 16.
    Bayesian Belief Networks Bayesianbelief networks—probabilistic graphical models, which unlike naïve Bayesian classifiers allow the representation of dependencies among subsets of attributes.
  • 17.
    If an arcis drawn from a node Y to a node Z, then Y is a parent or immediate predecessor of Z, and Z is a descendant of Y. Each variable is conditionally independent of its nondescendants in the graph, given its parents
  • 19.
    • A beliefnetwork has one conditional probability table (CPT) for each variable. The CPT for a variable Y specifies the conditional distribution P(Y|Parents(Y)), where Parents(Y) are the parents of Y The conditional probability for each known value of LungCancer is given for each possible combination of the values of its parents. For instance, from the upper leftmost and bottom rightmost entries, respectively, we see that P(LungCancer = yes|FamilyHistory = yes, Smoker = yes) = 0.8 P(LungCancer = no |FamilyHistory = no, Smoker = no) = 0.9.