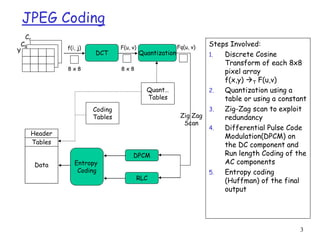
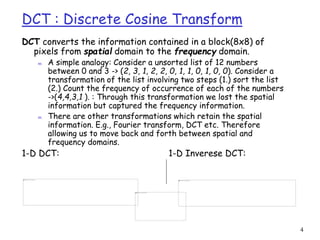
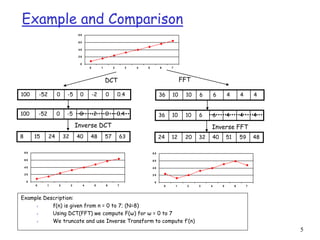
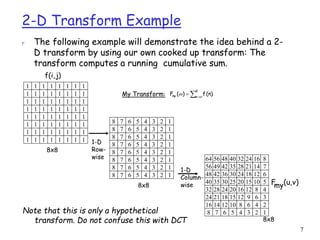
1. JPEG uses discrete cosine transform (DCT) to convert pixel values into frequency coefficients, followed by quantization which reduces the number of bits for each coefficient.
2. Coefficients are then scanned in zig-zag order and entropy encoded to achieve compression.
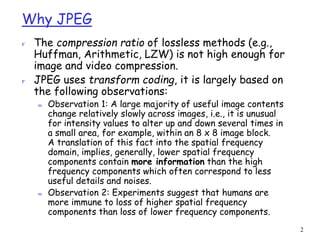
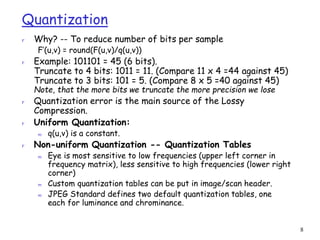
3. Quantization is the main source of lossy compression in JPEG and uses non-uniform quantization tables that retain more precision for low frequency coefficients that are more important to the human visual system.