Download to read offline
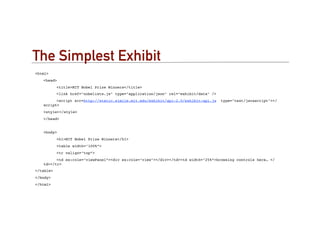
![The Data
{
"items" : [
{ type : "Nobelist",
label : "Burton Richter",
! ! ! latlng: "42.359089,-71.093412",
discipline : "Physics",
shared : "yes",
"last-name" : "Richter",
"nobel-year" : "1976",
relationship : "alumni",
"co-winner" : "Samuel C.C. Ting",
"relationship-detail" : "MIT S.B. 1952, Ph.D. 1956",
imageURL : "http://nobelprize.org/nobel_prizes/
physics/laureates/1976/richter_thumb.jpg"
},
………
]
}](https://image.slidesharecdn.com/mphillecture12-111215173148-phpapp02/85/MPhil-Lecture-of-Data-Vis-for-Presentation-16-320.jpg)
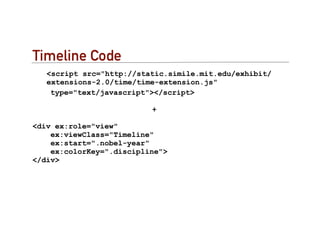
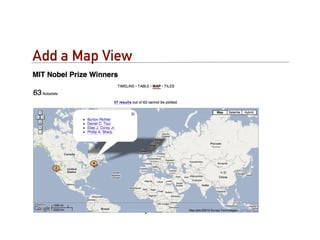
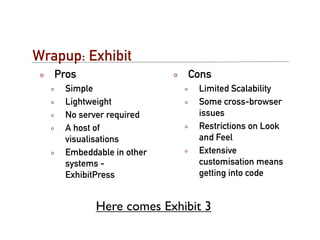
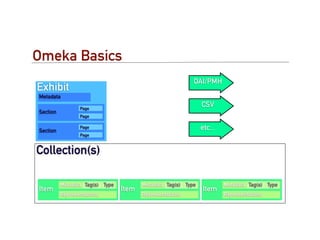
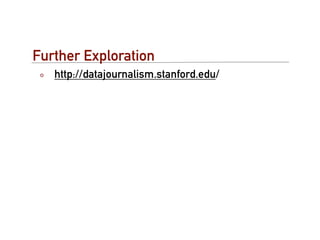

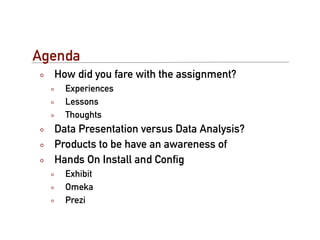
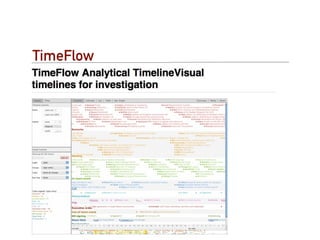
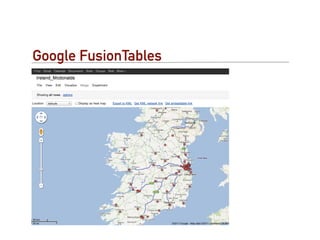
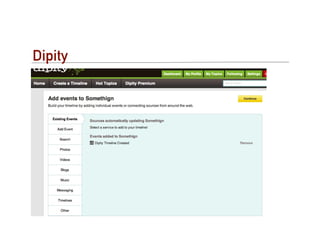
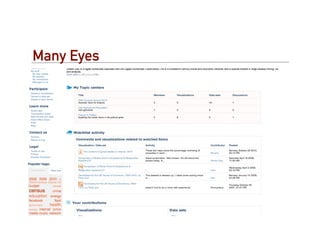
This document provides an introduction to structured data presentation tools for digital humanities scholars. It discusses Exhibit, a lightweight framework for presenting, searching, and faceted browsing of digital collections. The document gives an overview of Exhibit's capabilities and includes code examples for basic implementation. It also discusses other tools like Omeka, Prezi, and visualizations in TimeFlow, Google Fusion Tables, Dipity and Many Eyes. The document concludes with a hands-on exercise to install and configure Exhibit.


