
Recommended
More Related Content
Similar to Lorenzo Fong Ponce's Master Slides for Business Presentations Version 1.0
Similar to Lorenzo Fong Ponce's Master Slides for Business Presentations Version 1.0 (20)
Recently uploaded
Recently uploaded (20)
Lorenzo Fong Ponce's Master Slides for Business Presentations Version 1.0
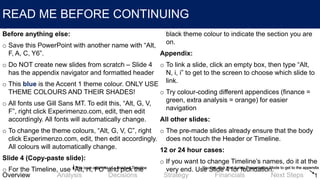
- 1. READ ME BEFORE CONTINUING Before anything else: o Save this PowerPoint with another name with “Alt, F, A, C, Y6”. o Do NOT create new slides from scratch – Slide 4 has the appendix navigator and formatted header o This blue is the Accent 1 theme colour. ONLY USE THEME COLOURS AND THEIR SHADES! o All fonts use Gill Sans MT. To edit this, “Alt, G, V, F”, right click Experimenzo.com, edit, then edit accordingly. All fonts will automatically change. o To change the theme colours, “Alt, G, V, C”, right click Experimenzo.com, edit, then edit accordingly. All colours will automatically change. Slide 4 (Copy-paste slide): o For the Timeline, use “Alt, H, FC” and pick the black theme colour to indicate the section you are on. Appendix: o To link a slide, click an empty box, then type “Alt, N, i, i” to get to the screen to choose which slide to link. o Try colour-coding different appendices (finance = green, extra analysis = orange) for easier navigation All other slides: o The pre-made slides already ensure that the body does not touch the Header or Timeline. 12 or 24 hour cases: o If you want to change Timeline’s names, do it at the very end. Use Slide 4 for foundation. 1FinancialsStrategyDecisionsAnalysisOverview Next Steps You can click this during Presentation Mode to get to the appendixThis is an example of a finished Timeline
- 2. Useful shortcuts (Apple Products and Spanish PowerPoint clients unfortunately do not apply, but can be easily Googled) 2 When practiced often enough, using the “Alt” key to navigate the Home, Insert, Animations, Format etc tabs can save enormous amounts of time Each is a 5-minute read. FinancialsStrategyDecisionsAnalysisOverview Next Steps
- 3. Slides to add in the future 3 Marketing • Funnel • Funnel broken down • Inbound methodology Strategy Slides • More in general (Find from other teams in UNICC) Other • Organisational structure • More charts • Mobile phone & tablet slides FinancialsStrategyDecisionsAnalysisOverview Next Steps
- 4. This Header is the length of an average Case Comp title. It summarises the body in 1.5 lines 4FinancialsStrategyDecisionsAnalysisOverview Next Steps
- 5. 5 Key Takeaway Copy-paste this for especially important key takeaways (or if there’s no space on the slide)
- 6. Company Name Tagline about the solution Cloud Riders | Lorenzo Fong Ponce · Leyre Unzu · Elena Garatea · Marcelo Moreira 6
- 7. Write a goal that supports the entire Executive Summary, and try to include numbers (Normally done near the end of prep) 7FinancialsStrategyDecisionsAnalysisOverview Next Steps Challenges Effects Recommendatio n Challenge 1 in a short sentence Challenge 3 in a short sentence Challenge 2 in a short sentence Effect 1 in a short sentence Effect 3 in a short sentence Effect 2 in a short sentence Recommendation 1 in a short sentence Recommendation 3 in a short sentence Recommendation 2 in a short sentence
- 8. Short Case Overview (resize text and add boxes as needed) 8FinancialsStrategyDecisionsAnalysisOverview Next Steps Name and overall idea of your strategy Situation Current performance of the case company. Complication Challenge 1 in a short sentence Challenge 2 in a short sentence Key Questions How to position? How to market? How to create growth?
- 9. Key questions to consider when developing your strategy 9FinancialsStrategyDecisionsAnalysisOverview Next Steps What What is the case company hiring you do achieve? Why How does their objective match with their overall business goals and vision? How What is the key idea of the strategy you are recommending the case company to do? Impact How will this impact their business?
- 11. Market Sizing. (Animated) 11FinancialsStrategyDecisionsAnalysisOverview Next Steps o Characteristic 1 o Characteristic 2 o Characteristic 3 Assumptions 40M Next segment 100M Primary segment 8M Next segment 2M Conclusion about target market’s attractiveness / concerns
- 12. PITA Model – Revenue Drivers Breakdown. P*I*T*A will give you Total Sales (Animated) 12FinancialsStrategyDecisionsAnalysisOverview Next Steps Population of Customer Segment Penetration rate (Incidence) Transactions per year / month / day Amount purchased / transaction (P*Q) Total Revenue: $102398 Ideas to improve an underperforming driver
- 13. PITA Model – Comparison to other populations / product lines / product types / product prices (Might need slide 5) 13FinancialsStrategyDecisionsAnalysisOverview Next Steps Population of Customer Segment Penetration rate (Incidence) Transactions per year / month / day Average purchase (P*Q) Total Revenue: $10239 8 Population of Customer Segment Penetration rate (Incidence) Transactions per year / month / day Average purchase (P*Q) Total Revenue: $10239 8
- 14. This can be both an Analysis or Decision slide. Delete / add criteria as required. 14FinancialsStrategyDecisionsAnalysisOverview Next Steps With Without Position Branding International Presence Revenue The key reason to go with “With” or “Without” Stabilisation / Growth in sales in Spain Sales in Spain will continue to decline by as much as 20% Pioneer of non-alcoholic wine, market leader Inconsistent: leader of alcoholic wine but lags behind competitors Gateway for non-alcohol wines for “New World” markets Limited expansion options in European “Old World” markets €1.6B over the next 5 years €1.4B over the next 5 years
- 15. Customer profile comparison – if needed, there is space for one more profile (Ctrl + Shift + G to ungroup, Ctrl + G to regroup) 15FinancialsStrategyDecisionsAnalysisOverview Next Steps Most significant relation between customer segments Cautious Cody Age: 21 Occupation: student Values: Brand reputation, product value Other: up to you Clever Clara Age: 21 Occupation: student Values: Brand reputation, product value Other: up to you
- 16. Information that shows why this customer profile is important 16FinancialsStrategyDecisionsAnalysisOverview Next Steps Conclusion that leads to a decision / strategy o Copy a character o Double-Click the man, “Alt, JD, O” o Picture or texture fill, insert picture from, Clipboard Consumption Drivers o Statistic 1 o Statistic 2 o Statistics 3 Business Implications Cautious Cody Key statistic
- 17. Information that shows why this customer profile is important (detailed) 17FinancialsStrategyDecisionsAnalysisOverview Next Steps Conclusion that leads to a decision / strategy o 50+ years o Mid-high income o Appreciate tradition o Often go to doctors o Travel often: cruisers, spa Characteristics Cautious Cody o 16.5 M people o Future growth: Size o With meals at home o While travelling o Restaurants o Special occasions Occasions Other (Revenue Streams etc.) 18.5 %
- 18. Characteristics of current customer segment (Add and resize panels accordingly) 18FinancialsStrategyDecisionsAnalysisOverview Next Steps Current Customers Clever Clara o Pregnancy o Health Trend o Social Causes Consumption Drivers Decision on what to do with current customer segment o Add data / bullet points / graph / anything Optional Panel(s)
- 19. Selection of a new customer segment 19FinancialsStrategyDecisionsAnalysisOverview Next Steps New Customers Techie Becky Cautious Cody Wine Consumption 15% 48% Income Mid – high Mid – high Diet Restrictions Mostly due to a trend and weight loss initiative Mostly due to health conditions Revenue Potential $4.5M / year $16.5M / year
- 20. Selection of a new customer segment (rated and selected). “Ctrl + Click” to drag the squares 20FinancialsStrategyDecisionsAnalysisOverview Next Steps New Customers How your chosen new segment impacts strategy Techie Becky Cautious Cody Wine Consumption Income Diet Restrictions Revenue Potential
- 21. Conclusion of analysis and how it guides your decision criteria 21FinancialsStrategyDecisionsAnalysisOverview Next Steps Key Findings Decision Criteria
- 23. Analysis Key Outcomes (Can also be decision criteria outcomes) 23FinancialsStrategyDecisionsAnalysisOverview Next Steps Key Outcomes Name of Strategy Strategy 1 Strategy 2 Strategy 3
- 24. Positioning Map – Other examples can include simple vs complex, healthy vs unhealthy, high vs low volume / tech etc 24FinancialsStrategyDecisionsAnalysisOverview Next Steps Where the case company should position and why High Price Low Price Low Quality High Quality
- 25. Decision 1 / 2 / 3: How viable you think his decision is and main reason why 25FinancialsStrategyDecisionsAnalysisOverview Next Steps Specifically which point affects the client the most o Point 1 o Point 2 Advantages o Point 1 o Point 2 Challenges o Maybe put a graph? Delete this if not necessary Additional Data
- 26. Describe the main reasons why you did not take some decisions 26FinancialsStrategyDecisionsAnalysisOverview Next Steps Why the final decision fits your strategy the best Decision 3 o Key Reason 1 o Key Reason 2 o Key Reason 3 Decision 1 o Key Reason 1 o Key Reason 2 o Key Reason 3 Decision 2 o Key Reason 1 o Key Reason 2 o Key Reason 3
- 27. More concise version of the previous two slides 27FinancialsStrategyDecisionsAnalysisOverview Next Steps Option 3 Characteristic 1 Characteristic 2 Characteristic 3 Conclusion Option 1 Characteristic 1 Characteristic 2 Characteristic 3 Conclusion Option 2 Characteristic 1 Characteristic 2 Characteristic 3 Conclusion
- 28. One a scale of 1 to 5, we evaluated each option’s viability / competitor’s strength with the following weighted criteria 28FinancialsStrategyDecisionsAnalysisOverview Next Steps Criteria 1 (40%) Criteria 2 (20%) Criteria 3 (20%) Criteria 4 (10%) Criteria 5 (10%) Option 1 1 2 2 2 2 Option 2 Option 3 Option 4 Option 5 TOTAL (out of 5) 1.6
- 29. Alternative version – more focused and fewer criteria (Ctrl + Click to drag squares) 29FinancialsStrategyDecisionsAnalysisOverview Next Steps Criteria 1 Criteria 2 Option 1 Option 2 Option 3 Option 4 Option 5 Further details how the chosen option is the best way forward
- 30. A high-level breakdown of your recommendations before getting to the strategy section of the timeline 30FinancialsStrategyDecisionsAnalysisOverview Next Steps Strategy 1 Tactic 1 Tactic 2 Challenge Addressed Challenge from Executive Summary Key Effect Effect from Executive Summary Strategy 2 Tactic 1 Tactic 2 Challenge Addressed Challenge from Executive Summary Key Effect Effect from Executive Summary Strategy 3 Tactic 1 Tactic 2 Challenge Addressed Challenge from Executive Summary Key Effect Effect from Executive Summary
- 31. More concise version 31FinancialsStrategyDecisionsAnalysisOverview Next Steps Strategy 2 Tactic 1 Tactic 2 Effect from Executive Summary Strategy 3 Tactic 1 Tactic 2 Effect from Executive Summary Strategy 1 Tactic 1 Tactic 2 Effect from Executive Summary
- 32. Even more concise version (Change icons as needed with “Alt, N, Y1”) 32FinancialsStrategyDecisionsAnalysisOverview Next Steps xx xx xx Name of the strategy and main challenges / opportunities it addresses xx
- 33. Recommendation 1, 2, or 3 – Key Effect 33FinancialsStrategyDecisionsAnalysisOverview Next Steps Tactic 1 Tactic 2 Tactic 3
- 34. Overall objective of your recommendation 34FinancialsStrategyDecisionsAnalysisOverview Next Steps o Some Point o Other Point o Final Point 1. Step o Some Point o Other Point o Final Point 2. Step o Some Point o Other Point o Final Point 3. Step How the steps contribute to a metric that supports your strategy
- 35. This Header is the length of an average Case Comp title. It summarises the body in 1.5 lines 35FinancialsStrategyDecisionsAnalysisOverview Next Steps o Some Point o Other Point o Final Point Some statistic explaining why this tactic is necessary How this tactic contributes to your recommendation Steps to take in order to implement your tactic Step one with highlight thing1 Step two with highlight thing2 Step three with highlight thing3
- 36. Segmenting channels by marketing funnel – Main rationale for segmentation 36FinancialsStrategyDecisionsAnalysisOverview Next Steps How each channel addresses each business objective o Channel: Print, Online, Sponsorship Build an authentic story (Awareness) o Channel: On-trade Induce motivation to purchase (Evaluation) How each channel addresses each business objective o Channel: Online Generate loyal brand advocates (Conversion) How each channel addresses each business objective
- 37. Super common UNAV Team slide set for virtually any tactic / process / feature breakdown 37FinancialsStrategyDecisionsAnalysisOverview Next Steps Key takeaway for each thing and how it ties to the strategy Thing 1 What? o Point 1 o Point 2 o Point 3 Who? o Point 1 o Point 2 o Point 3 When? o Point 1 o Point 2 o Point 3
- 38. Super common UNAV Team slide set for virtually any tactic / process / feature breakdown 38FinancialsStrategyDecisionsAnalysisOverview Next Steps Key takeaway for each thing and how it ties to the strategy Thing 2 o Key Ideas from Example Graph o Key Ideas from Example Graph o Key Ideas from Example Graph 1 1.3 1.6 1.7 2.5 Year 1 Year 2 Year 3 Year 4 Year 5 Net Profit (in $M)
- 39. Super common UNAV Team slide set for virtually any tactic / process / feature breakdown 39FinancialsStrategyDecisionsAnalysisOverview Next Steps Key takeaway for each thing and how it ties to the strategy Put anything here Thing 3
- 40. Super common UNAV Team slide set for virtually any tactic / process / feature breakdown 40FinancialsStrategyDecisionsAnalysisOverview Next Steps How this strategy contributes to overall case objective Tactic Tactic 1 Tactic 2 Challenge Resolved How to position? How to market?
- 42. This slide should be animated. Otherwise, it would be quite an overload 42FinancialsStrategyDecisionsAnalysisOverview Next Steps Revenue Drivers and Assumptions Gradual increase in sales $11 sales by 2021 NPV: $7.4M Cost Drivers and Assumptions Gradual increase in sales $11 sales by 2021 NPV: $7.4M 1 1.3 1.6 1.7 2.5 Year 1 Year 2 Year 3 Year 4 Year 5 Net Profit (in $M) Largest revenue and lowest cost that contribute to net profit
- 43. Sources of income / expenses and their segmentation. Highlight interesting numbers. 43FinancialsStrategyDecisionsAnalysisOverview Next Steps Conclusion about the total cost and what action to take o Point 1 o Point 2 o Total: Logistics (%) o Point 1 o Point 2 o Total: IT (%) o Point 1 o Point 2 o Total: Salaries (%) Total:
- 44. Key financial objectives (based on decision criteria) achieved – Strategy 1, 2, and 3 can be deleted if irrelevant 44FinancialsStrategyDecisionsAnalysisOverview Next Steps Strategy 1 Strategy 3Strategy 2 How the achieved financial objectives contribute to the main strategy 2.3 3.5 Current Forecasted Gross Margin (in $M) 4.5% 10.5 % Current Forecasted % of US Sales to Total Sales 28 43 Current Forecasted Quantity Imported (in 1000 bottles)
- 46. High-level, super-concise timeline. You can delete the bottom half and add additional timelines 46 Period 1: Enhance ATM Period 2: New partnerships Period 3: Further Internationalization FinancialsStrategyDecisionsAnalysisOverview Next Steps Period 1: Enhance ATM Period 2: New partnerships Period 3: Further Internationalization Period 1: Enhance ATM Period 2: New partnerships Period 3: Further Internationalization
- 47. More details on each (Can also be an appendix slide) 47 Period 1: Enhance ATM Period 2: New partnerships Period 3: Further Internationalization Market analysis by country & customer segment Monitor economic scenarios Build up a new ranking of attractiveness & opportunities Extend the Trial Program in the US Continue innovating & adapting to market needs Customer insights: leverage data Large companies with low- profile m-payment apps Integrated & sustainable penetration Gamification benefits FinancialsStrategyDecisionsAnalysisOverview Next Steps
- 48. Another timeline style 48 2018 o Action 1 o Action 2 2019 o Action 1 o Action 2 2020 o Action 1 o Action 2 2021 o Action 1 o Action 2 2022 o Action 1 o Action 2 FinancialsStrategyDecisionsAnalysisOverview Next Steps The most important actions that have the most impact
- 49. Almost-GANTT timeline style (Animating this slide would be a very good idea) 49FinancialsStrategyDecisionsAnalysisOverview Next Steps Year 3 Year 4 Year 5Year 2Year 1Now Strategy 1 Strategy 3 Strategy 2 Action 1 Action 2
- 51. Relation between two concepts 51 o Some Point o Other Point o Final Point One Point o Some Point o Other Point o Final Point Another Point Joint conclusion about the two points FinancialsStrategyDecisionsAnalysisOverview Next Steps
- 52. Two concepts, two conclusions, one joint conclusion 52 o Some Point o Other Point o Final Point One Point o Some Point o Other Point o Final Point Another Point Joint conclusion about the two points FinancialsStrategyDecisionsAnalysisOverview Next Steps Conclusion 1 Conclusion 2
- 53. Two concepts combining into one entity 53FinancialsStrategyDecisionsAnalysisOverview Next Steps o Some Point o Other Point o Final Point o Some Point o Other Point o Final Point Social responsibility Fashion trend Core Competency One-for-many business model
- 54. This Header is the length of an average Case Comp title. It summarises the body in 1.5 lines 54 Graph / Data One Point o Insight 1 o Insight 2 o Insight 3 Graph / Data Another Point o Insight 1 o Insight 2 o Insight 3 Graph / Data Last Point o Insight 1 o Insight 2 o Insight 3 Key Takeaway (animated) FinancialsStrategyDecisionsAnalysisOverview Next Steps
- 55. This Header is the length of an average Case Comp title. It summarises the body in 1.5 lines 55 Main Idea Sub Idea Description Sub Idea Description Sub Idea Description Optional conclusion that supports certain decisions you made FinancialsStrategyDecisionsAnalysisOverview Next Steps
- 56. Segment within a segment (animated) 56 56% 44%On Trade Off Trade 14% 3% 5% 8% 30% 40% Other Own Wine Bars Catering Firms Wine Bars Hotels Restaurants How your chosen segments tie into your larger strategy FinancialsStrategyDecisionsAnalysisOverview Next Steps
- 57. Segment within a segment 2 (animated) 57 56% 44% On Trade Off Trade 10% 3% 41% 46% Other Cash & Carry Hypermarkets Small Supermarkets How your chosen segments tie into your larger strategy FinancialsStrategyDecisionsAnalysisOverview Next Steps
- 58. Comparison between two segments / strategies / channels (animated) 58 Cautious Cody Characteristic one Characteristic two Characteristic three Clever Clara Characteristic one Characteristic two Characteristic three Important similarities between the two Important similarities between the two Action to take based on the findings FinancialsStrategyDecisionsAnalysisOverview Next Steps
- 59. Gap Analysis (Can be both main presentation or appendix) 59 Future Position Xxx Xxx Xxx Xxx Xxx Current Position Xxx Xxx Xxx Xxx Xxx Most difficult challenge they face and most important action they can take FinancialsStrategyDecisionsAnalysisOverview Next Steps
- 60. Really popular multi-functional slide from past UNAV teams 60 xxx xxx xxx xxx xxxxxx Key takeaways FinancialsStrategyDecisionsAnalysisOverview Next Steps
- 61. Simple version 61 xxx Key takeaways FinancialsStrategyDecisionsAnalysisOverview Next Steps xxxxxx
- 62. Multiple ideas leading to a conclusion 62 xxx xxx xxx xxx xxx xxx xxx xxx FinancialsStrategyDecisionsAnalysisOverview Next Steps A combined conclusion that relates to your analysis / decision / strategy
- 63. This Header is the length of an average Case Comp title. It summarises the body in 1.5 lines 63FinancialsStrategyDecisionsAnalysisOverview Next Steps
- 64. This slide or the appendix should be the one the judges see while doing Q&A – no need for a “Thank You” slide 64 Challenges Effects Recommendatio n Challenge 1 in a short sentence Challenge 3 in a short sentence Challenge 2 in a short sentence Recommendation 1 in a short sentence Recommendation 3 in a short sentence Recommendation 2 in a short sentence One compelling reason why your strategy is unbeatable
- 65. Appendix 1. Overview 2. Analysis 1 3. Analysis 2 4. Decision Criteria 5. Strategy 1 6. Strategy 2 7. Financials 8. Next Steps
- 66. Porter’s 5 Forces (Click on the graph, then “Alt, JC, D” to edit data) 66 Competitors Substitutes EntrantsSuppliers Customers FinancialsStrategyDecisionsAnalysisOverview Next Steps
- 67. Detailed Porter’s 5 Forces (“Ctrl + Click” to drag the squares) 67 Suppliers Threat o Just some info o More info o Last info Entrants Threat o Just some info o More info o Last info Rivals Threat o Just some info o More info o Last info Substitutes Threat o Just some info o More info o Last info Customers Threat o Just some info o More info o Last info Optional conclusion that supports certain decisions you made FinancialsStrategyDecisionsAnalysisOverview Next Steps
- 68. Porter Value Chain (Firm Infrastructure and Operations are shaded different as an example use case for this slide) 68 Inbound logistics Operations Outbound logistics Marketing & Sales Service Procurement Human Resource Management Technology Development Firm Infrastructure Margin PrimaryActivitiesSupportActivities Activities that are performing especially good or bad and what to do about it FinancialsStrategyDecisionsAnalysisOverview Next Steps
- 69. PEST / SWOT / Eliminate-Reduce-Raise-Create 69 Optional conclusion that supports certain decisions you made • Some Point • Other Point • Final Point Political / Strengths / Eliminate • Some Point • Other Point • Final Point Economical / Weaknesses / Reduce • Some Point • Other Point • Final Point Social / Opportunities / Raise • Some Point • Other Point • Final Point Technological / Threats / Create FinancialsStrategyDecisionsAnalysisOverview Next Steps
- 70. PESTLE Analysis (Ctrl + Click to put levels) 70 Optional conclusion that supports certain decisions you made FinancialsStrategyDecisionsAnalysisOverview Next Steps Political o Just some info o More info Technological o Just some info o More info Economical o Just some info o More info Legal o Just some info o More info Social o Just some info o More info Environmental o Just some info o More info
- 71. Marketing Mix (4P) / Any four-box Analysis 71 o Point 1 o Point 2 o Point 3 Product o Point 1 o Point 2 o Point 3 Price o Point 1 o Point 2 o Point 3 Place o Point 1 o Point 2 o Point 3 Promotion FinancialsStrategyDecisionsAnalysisOverview Next Steps Optional conclusion that supports certain decisions you made
- 72. World Map 72 Hong Kong Pamplona Brisbane Seattle FinancialsStrategyDecisionsAnalysisOverview Next Steps
- 73. TOWS Analysis 73 StrengthWeakness ThreatOpportunity Main strategy from Executive Summary Most important mitigation from risks and mitigations Core competency vs external threat New capability that might need to be built FinancialsStrategyDecisionsAnalysisOverview Next Steps
- 74. Most previous UNAV teams liked this Risks slide a lot. 74 Severity Probability 3 1 6 4 2 5 MAIN RISKS 1.Redundancy in distribution channels 2.Cannibalization of current TG in Spain 3.Cannibalization of other brands in Spain 4.Differentiation failure in China 5.Product price drop in China 6.New entrants with same value FinancialsStrategyDecisionsAnalysisOverview Next Steps
- 75. Most previous UNAV teams liked this Risks slide a lot. 75 Severity Probability MAIN RISKS 1.Redundancy in distribution channels 2.Cannibalization of current TG in Spain 3.Cannibalization of other brands in Spain 4.Differentiation failure in China 5.Product price drop in China 6.New entrants with same value 3 1 6 4 2 5 FinancialsStrategyDecisionsAnalysisOverview Next Steps
- 76. Describe the similarities between each mitigation to make your back-up plans more “strategic” (“Ctrl + Click” to drag squares) 76 Recommendation 1 Key Risk Mitigation Probability: Severity: Recommendation 3 Key Risk Mitigation Probability: Severity: Recommendation 2 Marketing channels may have less effect than intended Redivert budget to alternative channels and customer retention efforts Probability: Severity: FinancialsStrategyDecisionsAnalysisOverview Next Steps
- 77. For a 24-hour case, you might want to explore each recommendation’s risks in more detail 77 Tactic 1 Key Risk Mitigation Probability: Severity: Tactic 3 Key Risk Mitigation Probability: Severity: Tactic 2 Influencers’ audiences are not very concerned with sponsored products Work closer with influencers to more seamlessly integrate your products in their content Probability: Severity: FinancialsStrategyDecisionsAnalysisOverview Next Steps
- 78. Market Share Growth Rate High High Low Low BGC / Product Portfolio Matrix 78 Lingerie Products Sports Bras FinancialsStrategyDecisionsAnalysisOverview Next Steps
- 79. New Products New Markets Existing Products Existing Markets Ansoff / Product Idea Generation Matrix 79 Product Development Diversification Market Penetration Market Development FinancialsStrategyDecisionsAnalysisOverview Next Steps
- 80. Broad Target Differentiation Narrow Target Low Cost Generic Strategies Matrix 80 Cost Leadership Differentiation Cost Focus Differentiation Focus FinancialsStrategyDecisionsAnalysisOverview Next Steps
- 81. X axis Y Axis High High Low Low Customisable Matrix 81 Optional Description Optional Description Optional Description Optional Description FinancialsStrategyDecisionsAnalysisOverview Next Steps
- 82. Innovation Adoption Lifecycle 82 Innovators Description Early Adopters Description Early Majority Description Late Majority Description Laggards Description FinancialsStrategyDecisionsAnalysisOverview Next Steps
- 83. Strategy Panel 83 Key partners Key activities Value Proposition Customer relationships Customer Segments Key resources Channels Cost Structure Revenue Streams FinancialsStrategyDecisionsAnalysisOverview Next Steps
- 84. Financial Statements go on the left 84 Key takeaway about specific items in the statement Overall takeaway Income Statement % 2006 2007 2008 2009 2010 Industry 2010 Sales 100% 100% 100% 100% 100% Other revenue 0% 0% 0% 0% 0% Total Revenue 100% 100% 100% 100% 100% COGS cost 69% 71% 72% 73% 74% 58% Gross Profit 31% 29% 28% 27% 26% 42% Operating Costs Selling and distribution 11% 9% 10% 9% 8% 14.45% R&D 1% 2% 2% 3% 3% 1.56% Administration 4% 4% 5% 6% 6% 5.67% EBITDA 15% 14% 12% 10% 9% Amortization 4% 3% 5% 5% 5% EBIT 11% 10% 7% 4% 4% Financial revenue 0% 0% 0% 0% 0% Interest Expense 1% 2% 2% 3% 3% 1.59% EBT 10% 9% 4% 2% 1% Taxes 3% 3% 2% 1% 0% Net Profit 6% 6% 3% 1% 0% FinancialsStrategyDecisionsAnalysisOverview Next Steps
- 85. Finance Appendix Slide example 85 Positive global earnings: 2020 Constant growth after 7th year of project Sustainable Earnings: $1,965K Global (2027) inthousands 2017 2018 2019 2020 2021 2022 2023 2024 2025 2026 2027 ExpectedEBITfromMilkMakeup 37- 18- 43 112 287 356 487 560 644 741 852 ExpectedEBITfromDooile - 43- 19- 71 136 203 275 387 453 543 652 ExpectedEBITfromElysiumHealth - - 54- 8- 36 99 217 303 348 401 461 -100 - 100 200 300 400 500 600 700 800 900 2017 2018 2019 2020 2021 2022 2023 2024 2025 2026 2027 inthousands Evolution of Earnings Exp. EBIT from Milk Makeup Exp. EBIT from Dooile Exp. EBIT from Elysium Health FinancialsStrategyDecisionsAnalysisOverview Next Steps
- 86. Stock Photos and Icons 86
- 87. 87
- 88. 88 map feature like feature battery feature
- 89. 89 x x x x x
- 90. 90 x x x x x x x
- 93. 93
- 94. Education Slides from Past Teams 94
- 95. Liquidity Ratios 95 Cash Ratio: 0.5:1 or higher is preferred. Quick Ratio: Ideally 1:1 Current Ratio: 2:1 is considered to be acceptable Show Company’s ability to quickly pay its liabilities with its current assets
- 96. CSI’s Value Chain 96 • Constant monitoring • 3m periods • Use all 3 sources • Analysis team • Trend&conclusions • Understand new needs • Ideate new features • Prototype designs • Select target groups • Try different target groups • Adapt to diff behaviors • Modify/eliminate • Install successful features & run them in 3 months Acquire DevelopInterpret Test Implement
- 97. Successful Matrix Structure 97 •Independent subsidiaries •Costs, conflict and worse decision making Line structure • Combination of Product Type - R&D • Controlled decentralization • Room for opportunities Matrix Structur e
- 98. Case Types 98 1. Internationalization – market entry 2. M&As 3. Develop a new product 4. Pricing strategy 5. Growth strategies 1. Increase distribution channels 2. Increase product line 3. Invest in major marketing campaign 4. Diversify products and services 5. Acquire competitors 6. Increase sales 1. Increase volume 2. Increase amount of each purchase 3. Increase prices 4. Create seasonal balance 7. Competitive response 1. Acquire competitors 2. Merge with competitors 3. Copy the competitors 4. Hire competitor’s management 5. Increase our profile with a marketing and public relations campaign 8. Increase volume 1. Expand into new areas 2. Increase sales force 3. Increase marketing 4. Reduce prices 5. Improve customer service