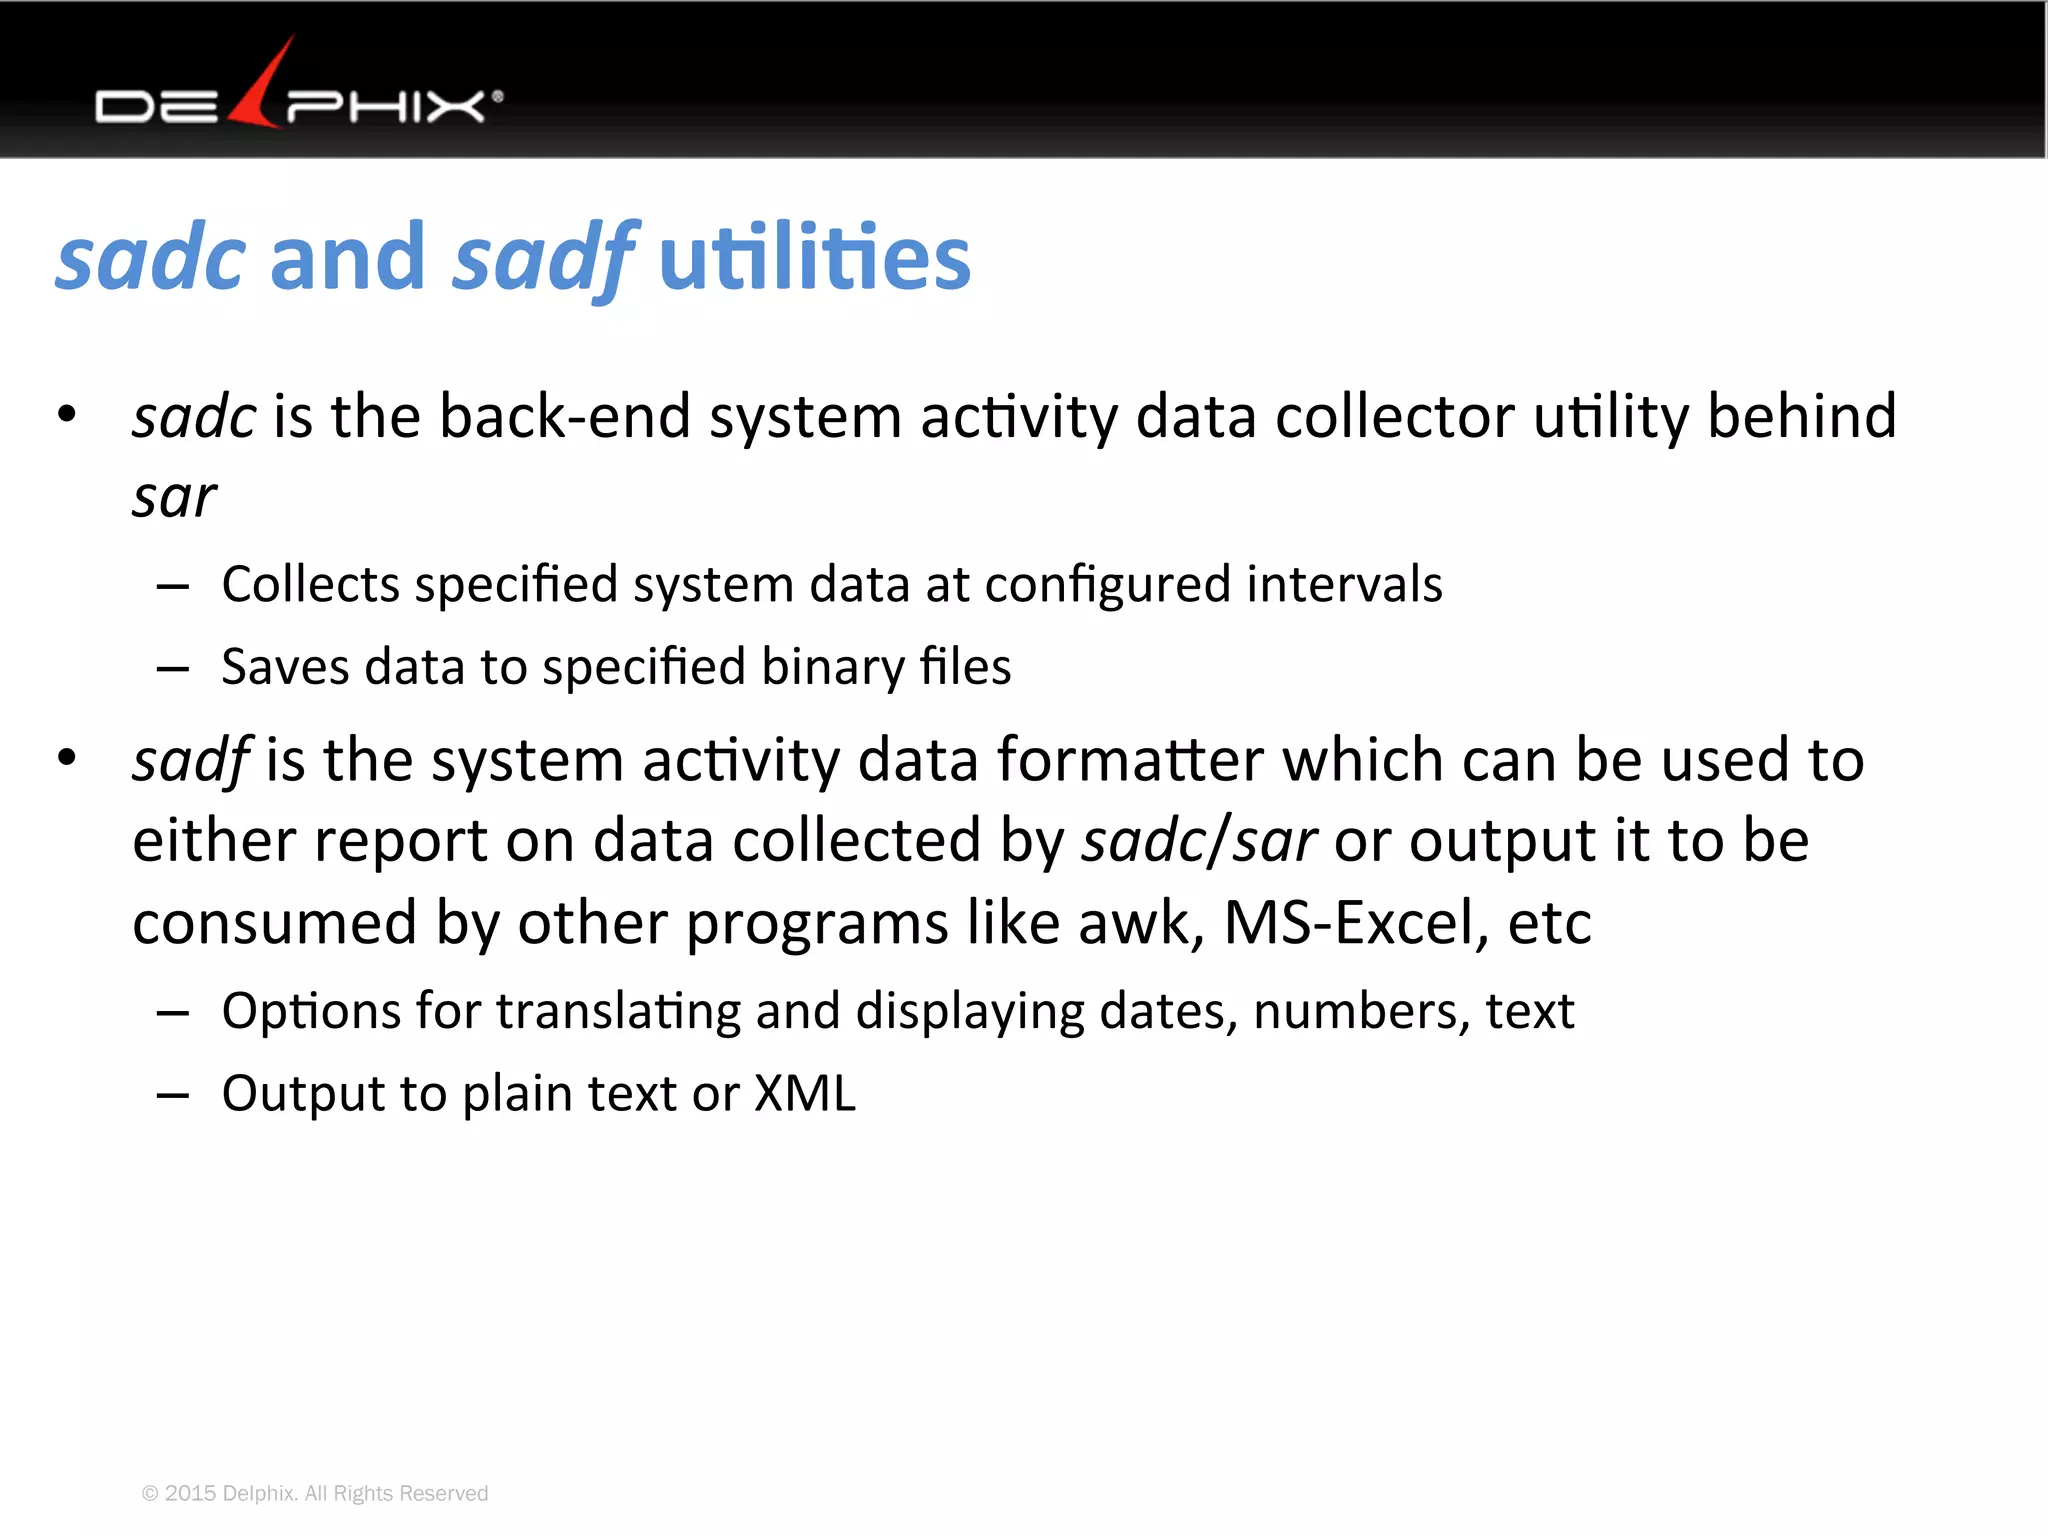
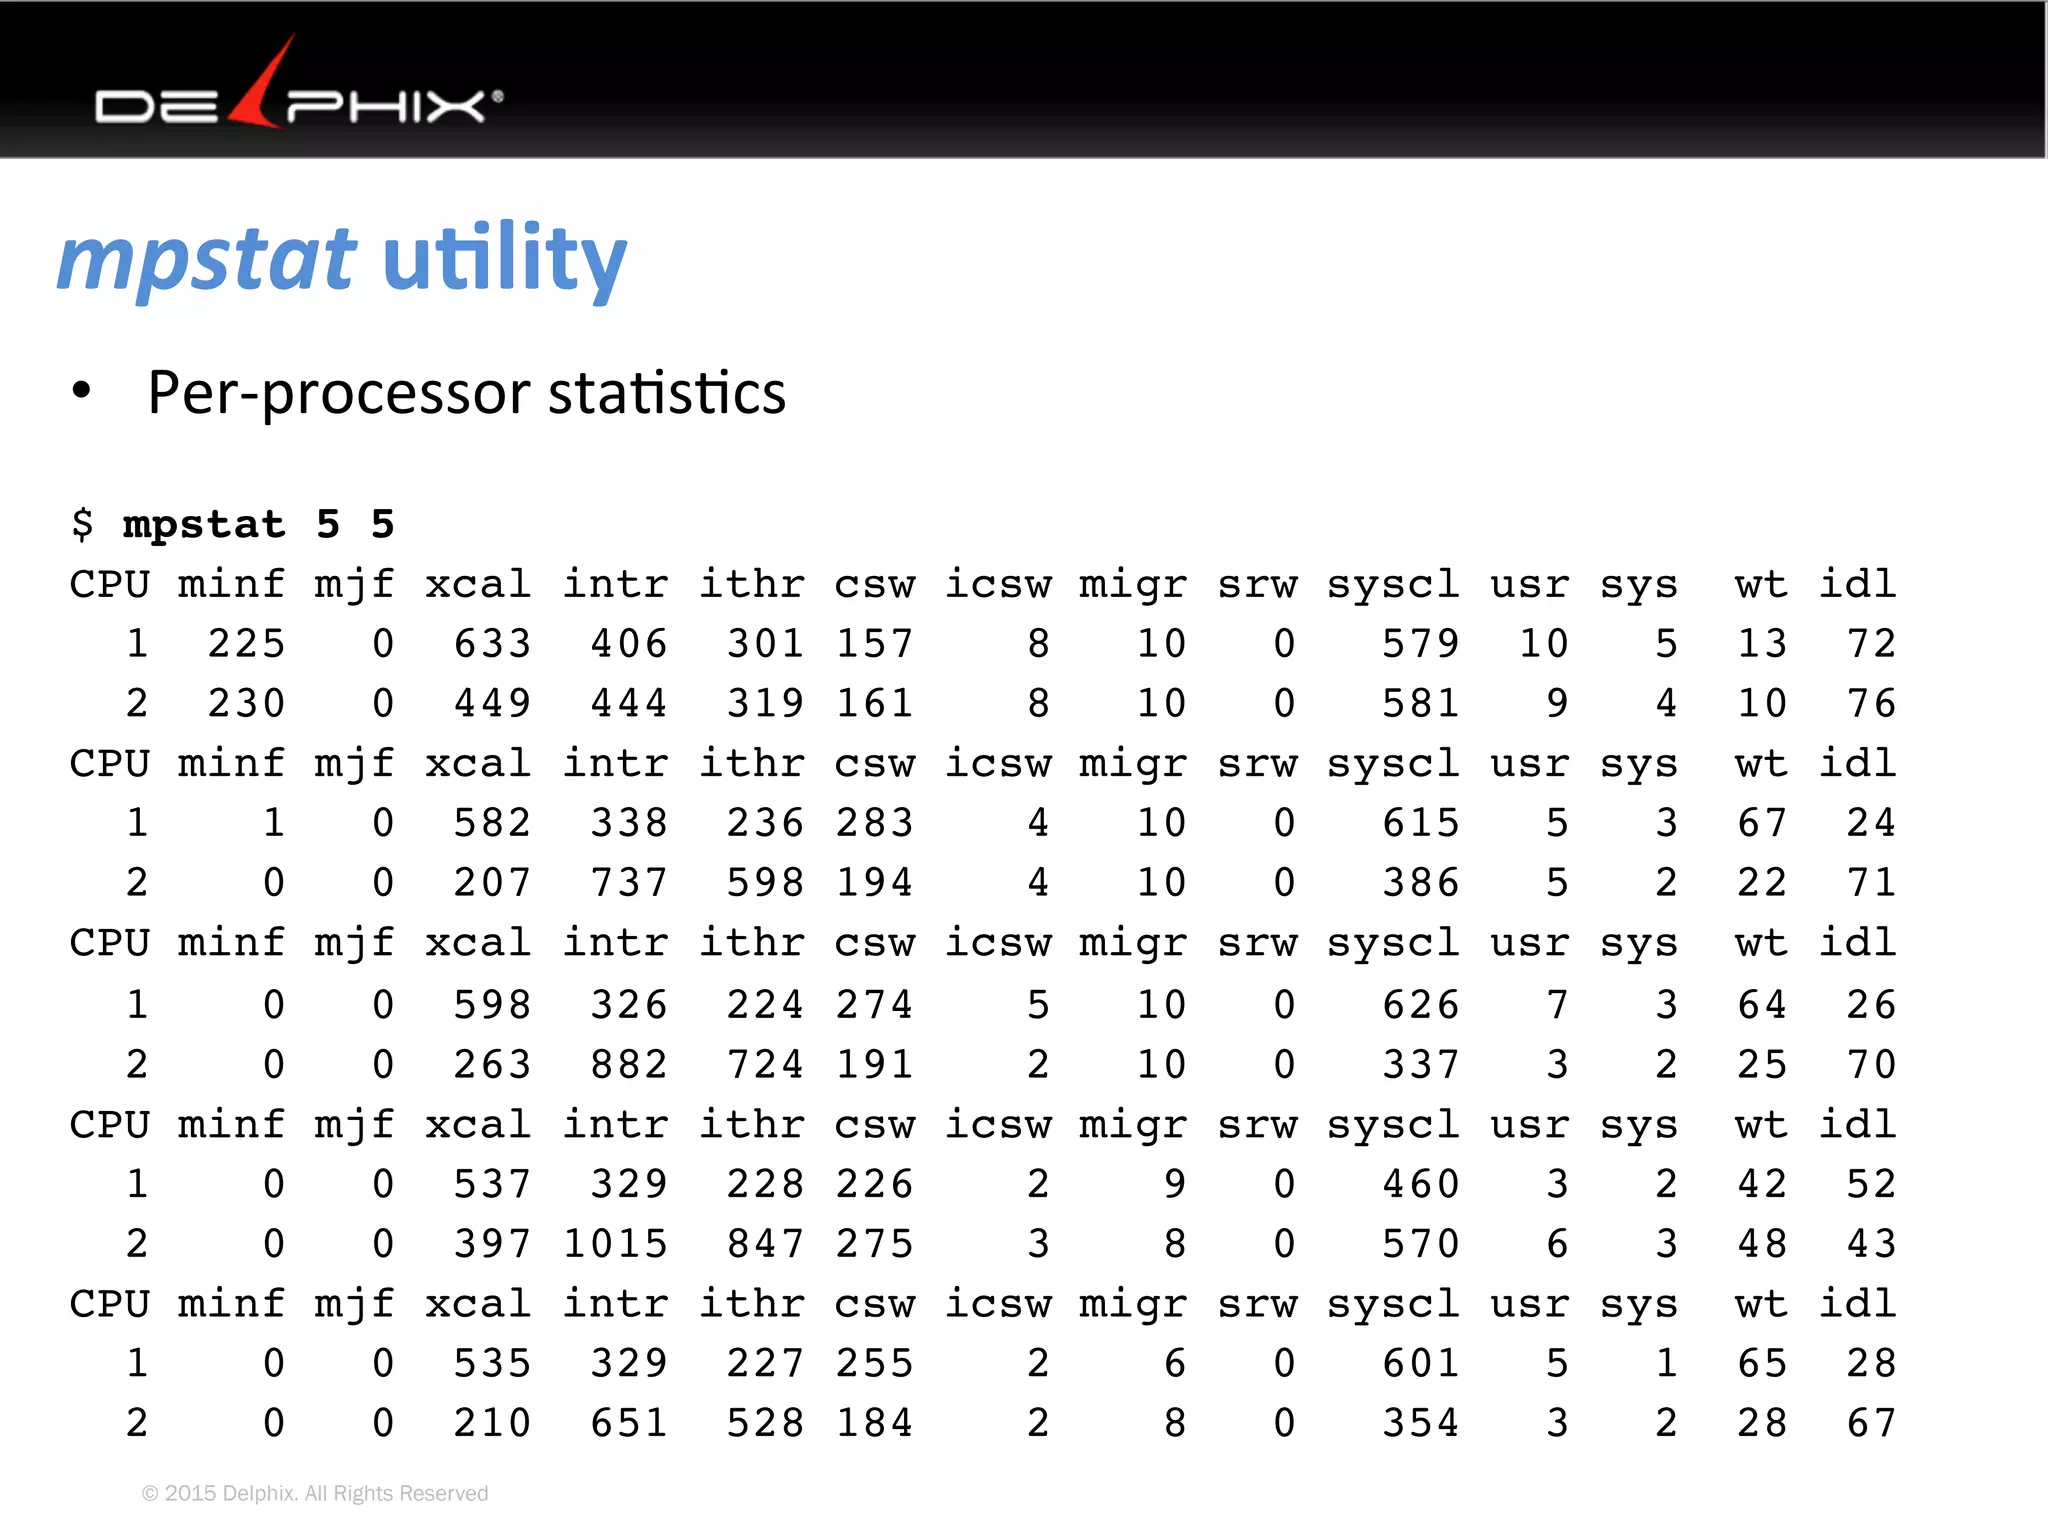
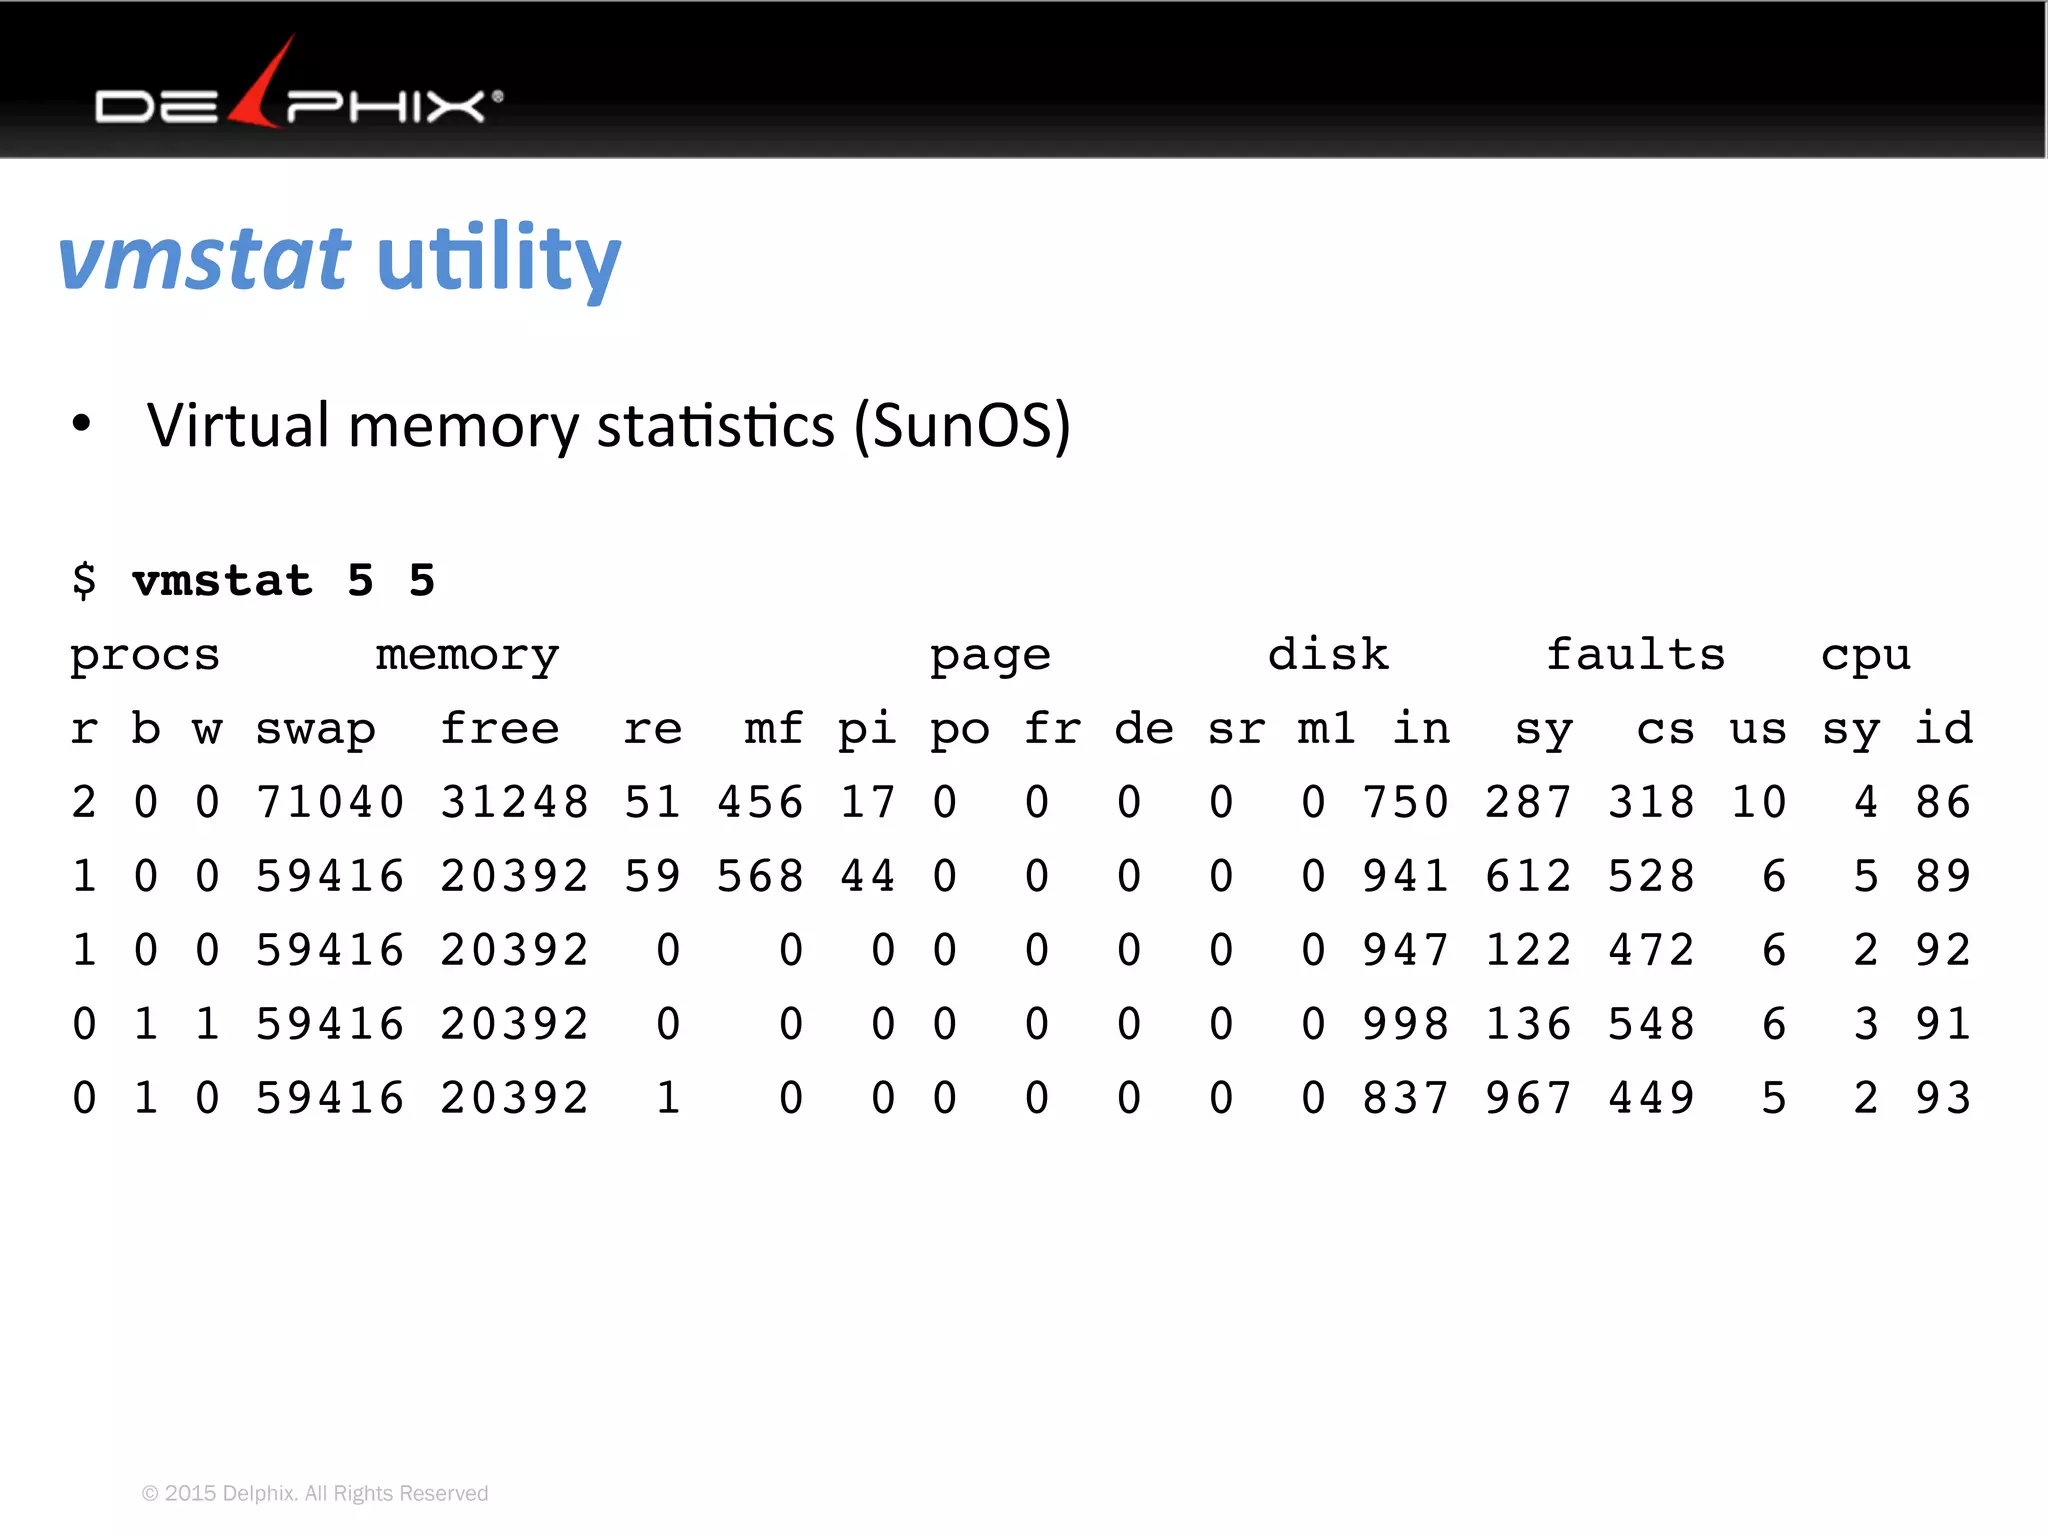
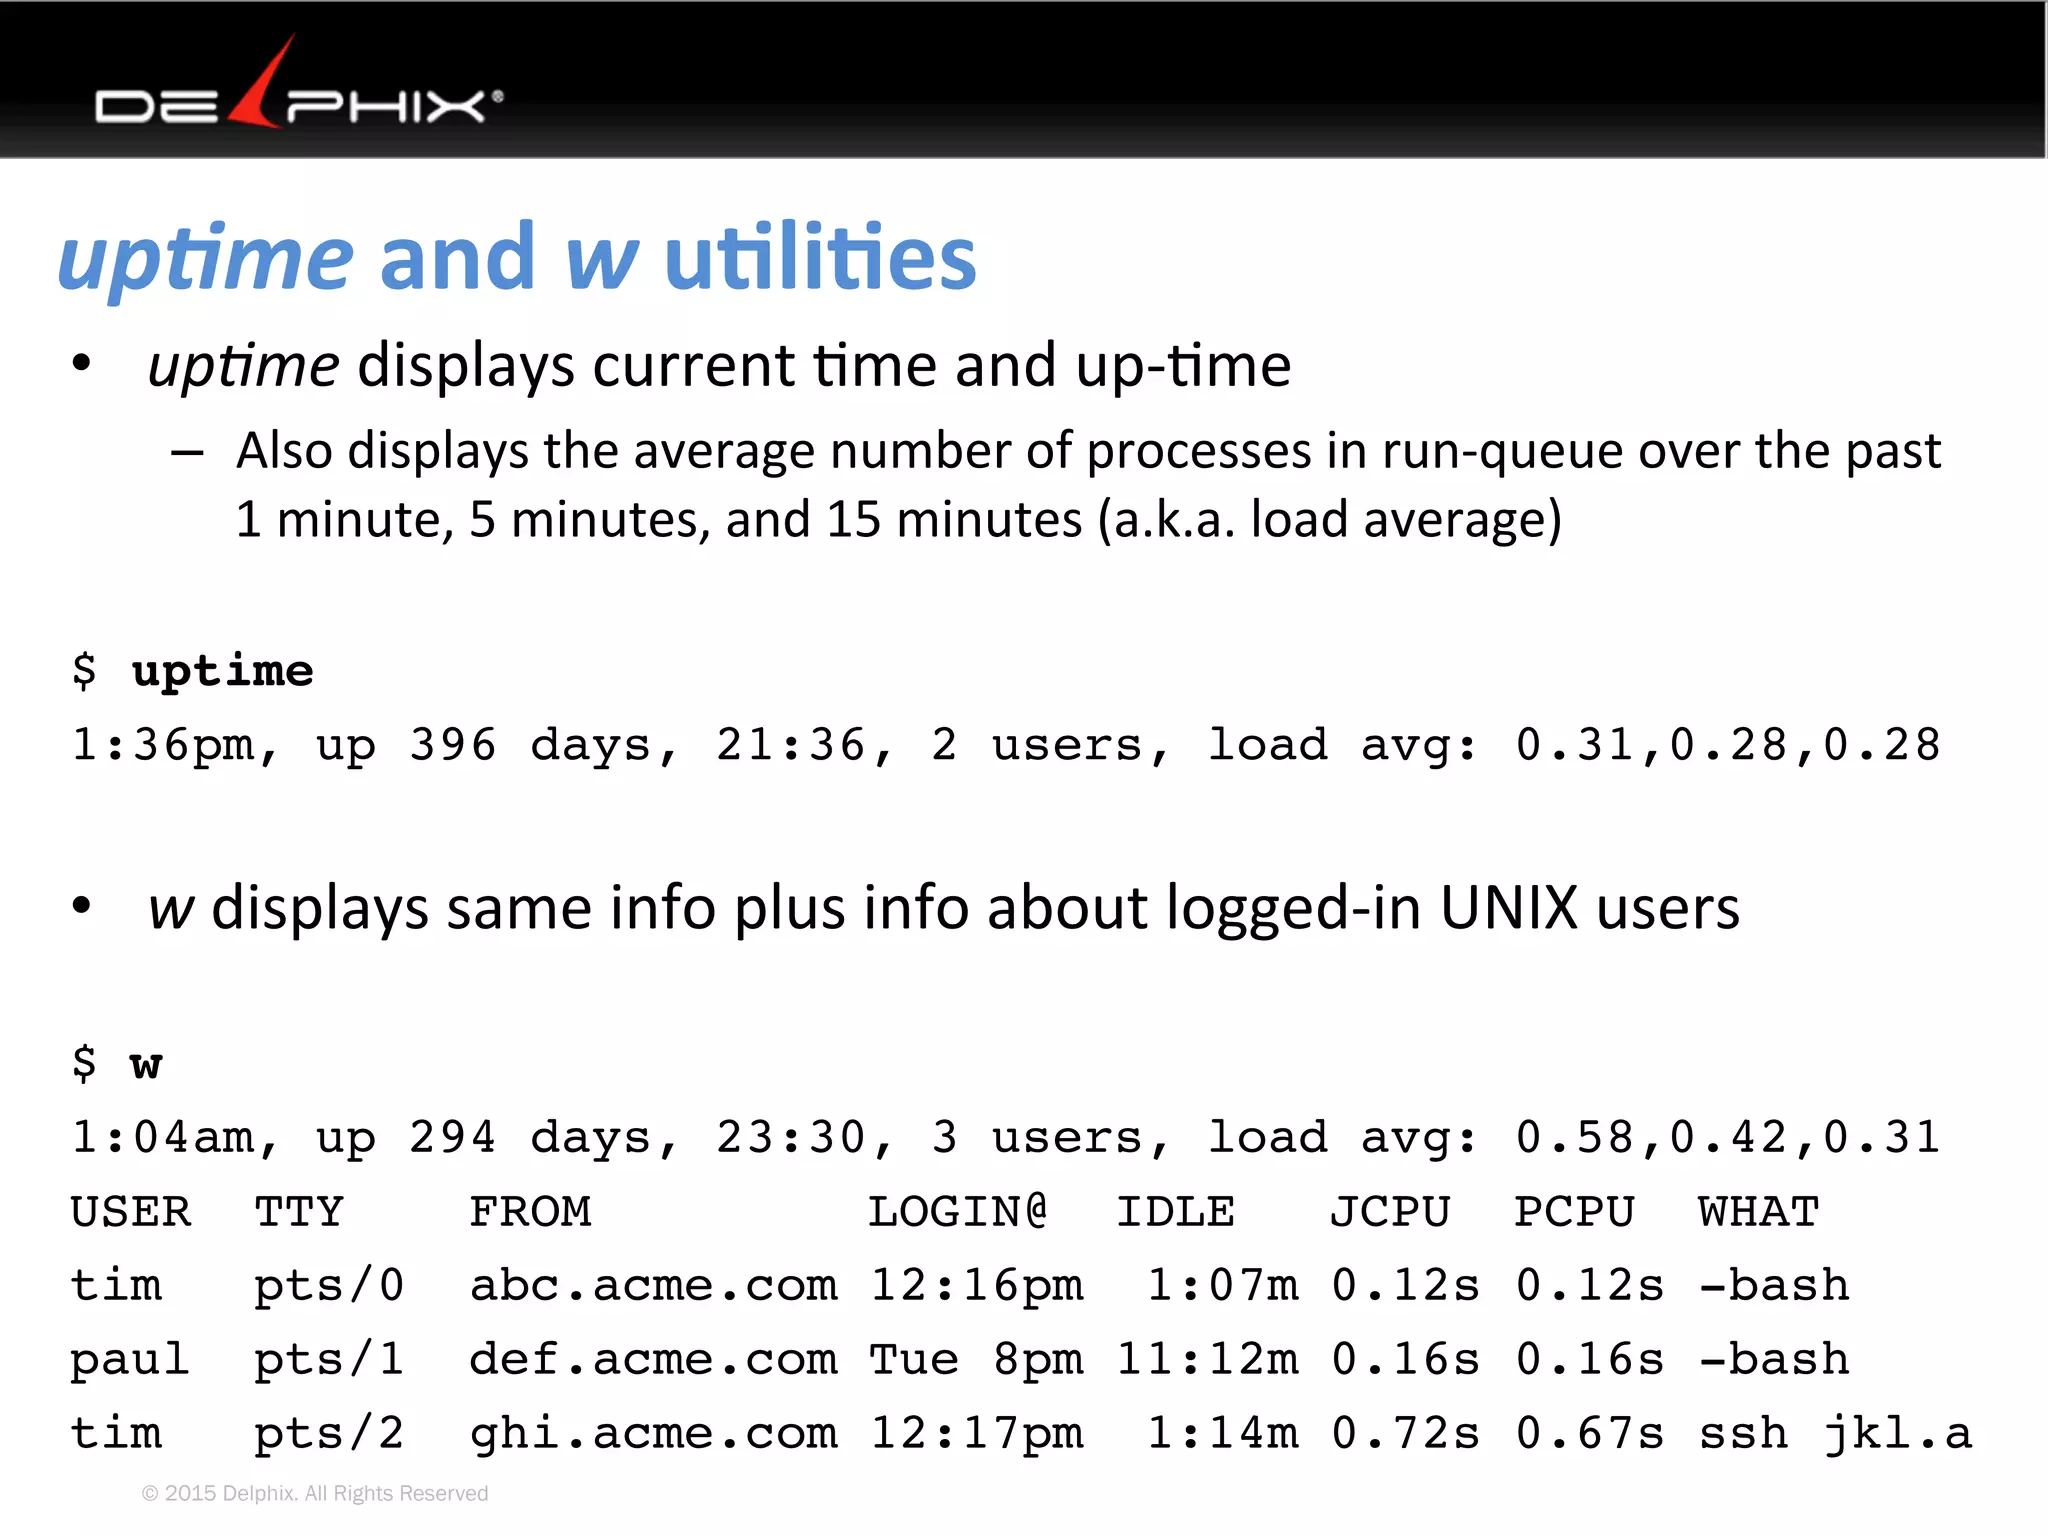
The document provides information on useful Linux/UNIX command line tools for Oracle DBAs to monitor and troubleshoot the underlying operating system and Oracle database. It discusses tools such as sar, sadc, sadf, mpstat, vmstat, ipc, and others that provide statistics on CPU usage, memory usage, paging activity, process activity and interprocess communication resources. For each tool, it provides examples of commands and output to understand what statistics are reported. The document is a guide to key Linux/UNIX command line performance monitoring and diagnostic utilities for Oracle DBAs.


![© 2015 Delphix. All Rights Reserved
ps uElity
• SysV version (most variants)
$ ps -eaf
• BSD version (MacOSX)
% ps -aux
• Posix XPG3/4 (X/Open Portability Guide v3/4)
# ps –eo opt[,opt…]
• Provides info about individual processes
– Status, PID, PPID, user, command text and parameters
– Cumula4ve and recent CPU usage
– Memory (virtual, resident)](https://image.slidesharecdn.com/tgormancollab16unixtools20160411-220731101434-ba2715f4/75/TGorman-Collab16-UnixTools-20160411-pdf-22-2048.jpg)


![© 2015 Delphix. All Rights Reserved
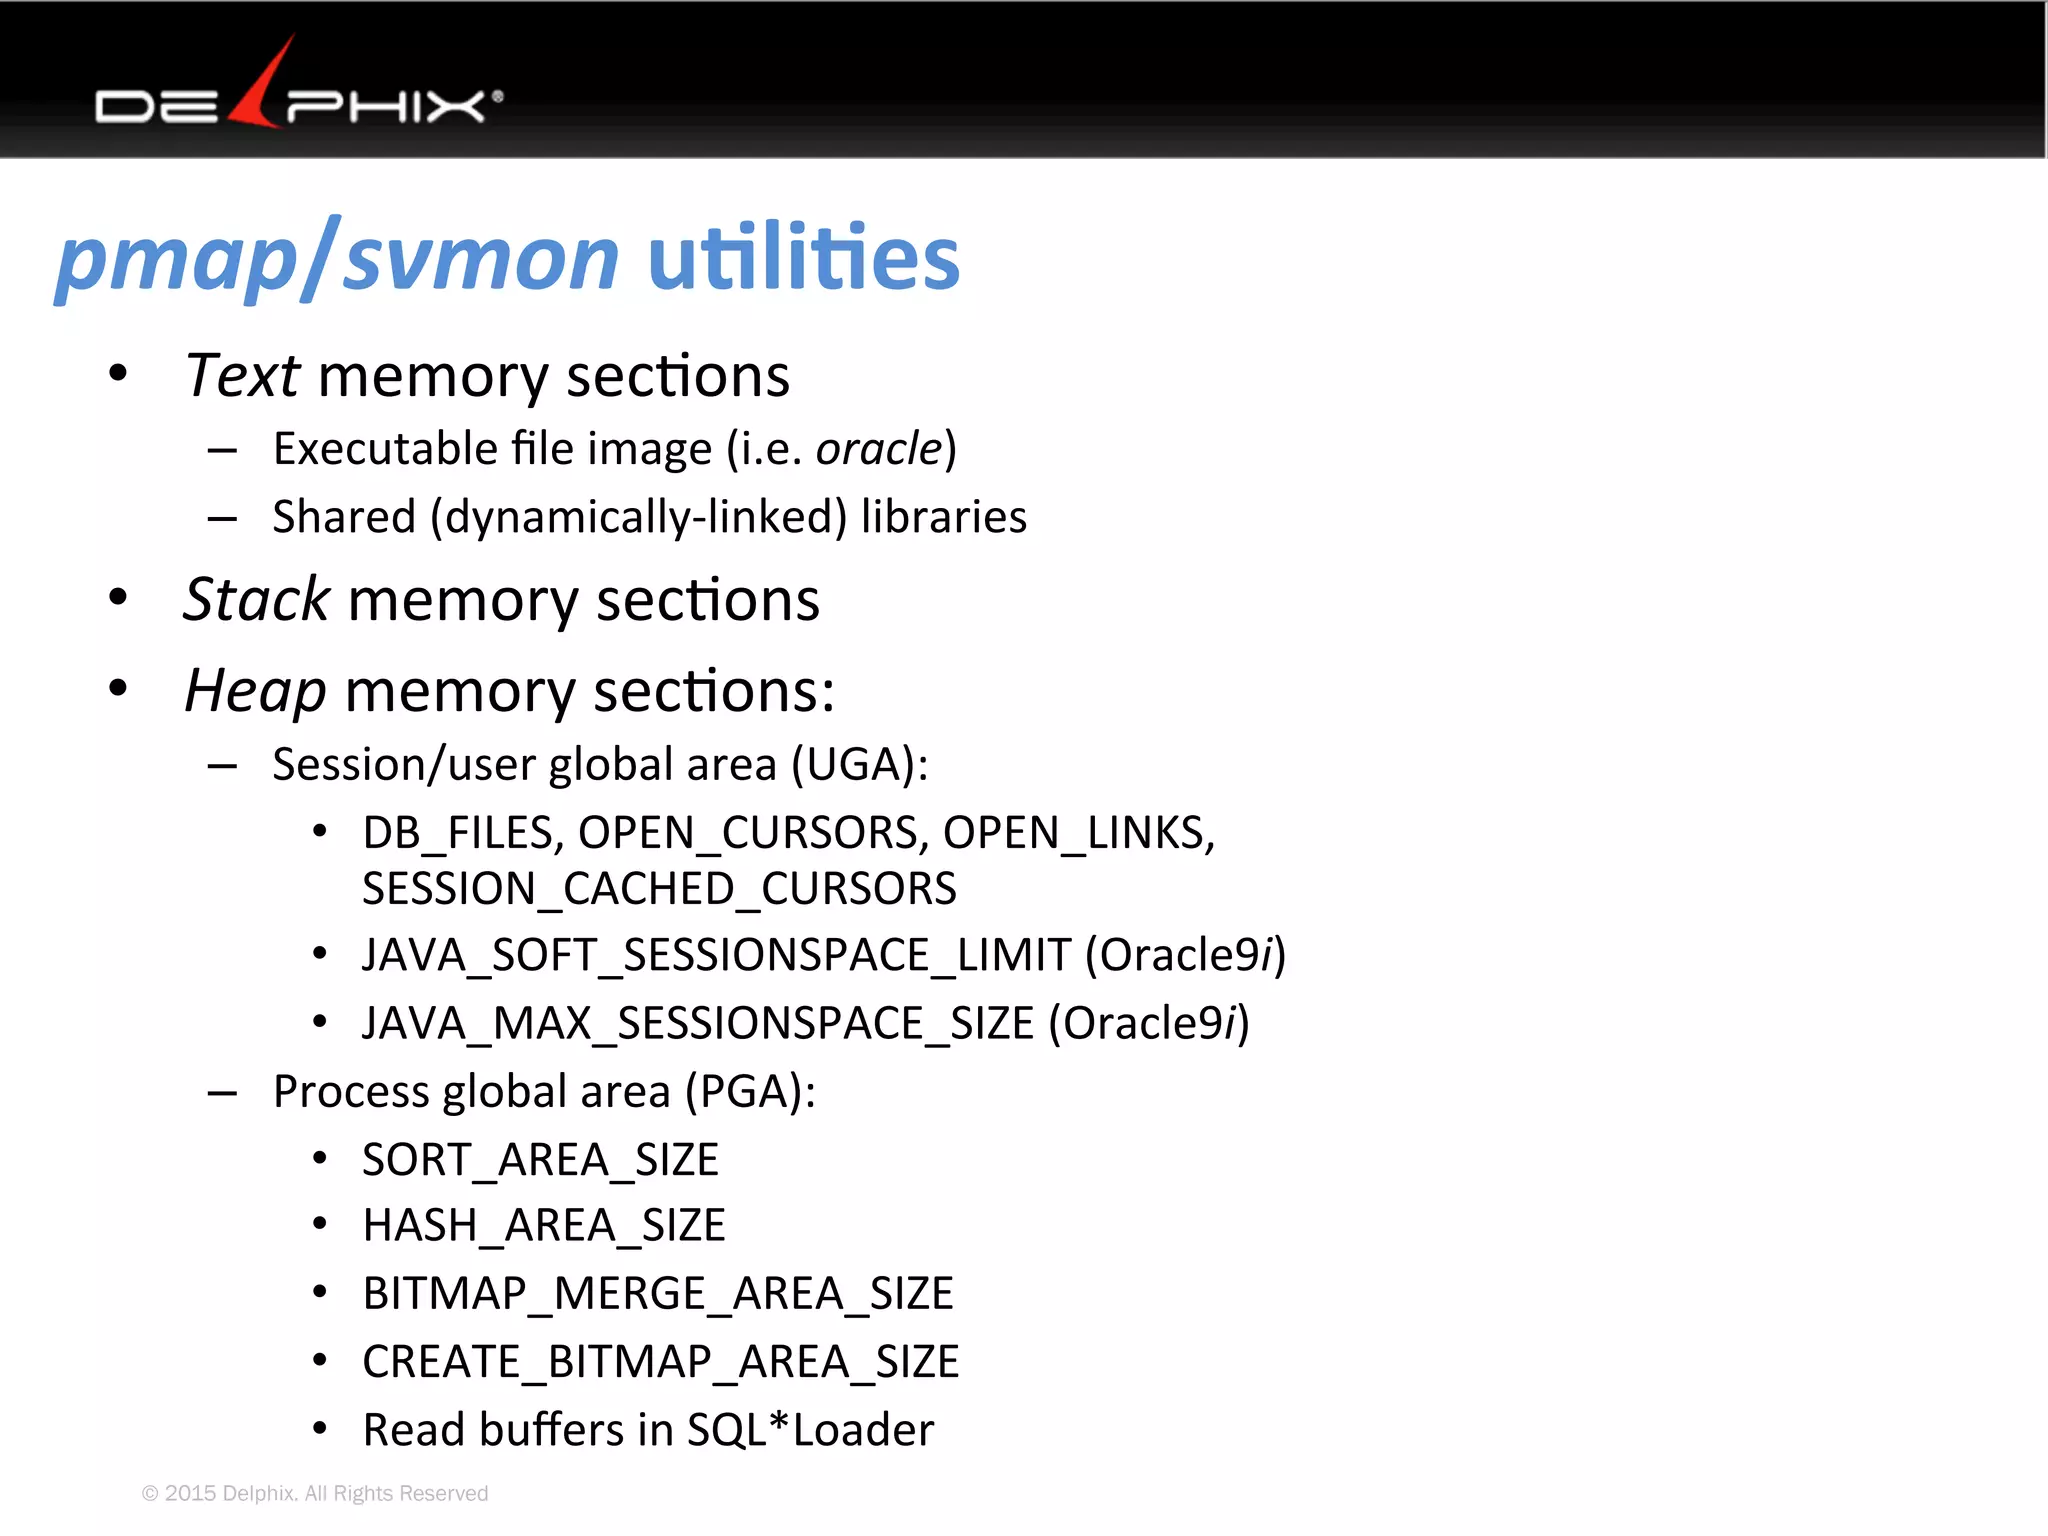
pmap/svmon uEliEes
$ pmap -x 18373
18373: oraclePROD (DESCRIPTION=(LOCAL=no))
Addr Kbytes Resdent Shared Private Permissions Mapped File
00010 26488 13936 13536 400 read/exec orac
019FC 272 272 216 56 read/write/exe orac
01A40 480 480 - 480 read/write/exe [ heap ]
80000 996816 996816 - 996816 read/write/shr [ ism shmi
FEAE6 8 8 - 8 read/write/exe psrn
FEAF0 16 16 8 8 read/exec libc
FEBF4 8 8 - 8 read/write/exe libm
FEC00 4656 992 960 32 read/exe libj
...
FF3E0 8 8 - 8 read/write/exe ld.s
FFBE0 64 64 - 64 read/write/exe [ stack ]
----- ------ ------ ------ ------
Total 131688 115352 16480 998872](https://image.slidesharecdn.com/tgormancollab16unixtools20160411-220731101434-ba2715f4/75/TGorman-Collab16-UnixTools-20160411-pdf-27-2048.jpg)


![© 2015 Delphix. All Rights Reserved
tcpdump uElity
• Dump/sniff traffic on a network
$ tcpdump
tcpdump: listening on hme0
17:01:12.147248 mail.acme.com.22 >
0-2pool82-90.nas33.thornton1.co.us.da.qwest.net.49161: P
428278756:428278820(64) ack 1413349383 win 24624
<nop,nop,timestamp 157942572 1881953418> (DF) [tos 0x10]
17:01:12.344385
0-2pool82-90.nas33.thornton1.co.us.da.qwest.net.49161 >
mail.acme.com.22: . ack 64 win 32832 <nop,nop,timestamp
1881953418 157942561> (DF) [tos 0x10]
17:01:13.143542 mail.acme.com.22 >
0-2pool82-90.nas33.thornton1.co.us.da.qwest.net.49161: P
64:480(416) ack 1 win 24624 <nop,nop,timestamp 157942672
1881953418> (DF) [tos 0x10]](https://image.slidesharecdn.com/tgormancollab16unixtools20160411-220731101434-ba2715f4/75/TGorman-Collab16-UnixTools-20160411-pdf-41-2048.jpg)


![© 2015 Delphix. All Rights Reserved
truss uElity
• Output from truss on Solaris10
– Oracle PMON process
semop(196608, 0xFFBEE7F4, 1) (sleeping...)
Received signal #14, SIGALRM, in semop() [caught]
semop(196608, 0xFFBEE7F4, 1) Err#91 ERESTART
sigprocmask(SIG_BLOCK, 0xFFBEE320, 0x00000000) = 0
sigprocmask(SIG_UNBLOCK, 0xFFBEE320, 0x00000000) = 0
getcontext(0xFFBEE0E0)
setcontext(0xFFBEE0E0)
sigprocmask(SIG_BLOCK, 0xFFBEE5FC, 0x00000000) = 0
setitimer(ITIMER_REAL, 0xFFBEE584, 0x00000000) = 0
sigprocmask(SIG_UNBLOCK, 0xFFBEE5FC, 0x00000000) = 0
getcontext(0xFFBEE4E8)
sigprocmask(SIG_BLOCK, 0xFFBEE5FC, 0x00000000) = 0](https://image.slidesharecdn.com/tgormancollab16unixtools20160411-220731101434-ba2715f4/75/TGorman-Collab16-UnixTools-20160411-pdf-44-2048.jpg)