SlideShare a Scribd company logo
UCSF ASL Perfusion Processing Methods
Daniel Cuneo, Derek Flenniken, Duygu Tosun-Turgut, PhD, Norbert Schuff, PhD
November 6, 2012
Contents
Overview 1
Brief Description of ASL 1
ASL-MRI Pre-Processing Steps 2
Structural-to-ASL coregistration and nonlinear
geometric distortion correction 3
Partial Volume Correction 4
Computation of CBF in T1 Space 5
Free Surfer ROI Statistics 5
CBF Output Quality Control (QC) Criteria and Steps 6
Limitations 7
Processing Steps Flow Diagram 8
Simulated T2-weighted MRI 9
Data Set Information 9
References 9
Contact Information 10
Overview
The Center for Imaging of Neurodegenerative Diseases (CIND) processing pipeline for Arterial Spin Label (ASL)
imaging, prepares perfusion-weighted images (PWI) and computes a quantitative map of cerebral blood flow
(CBF) and a regional analysis. The quantification of CBF and correspondence to high-resolution anatomical
MRI data, is achieved by implementing multiple tools from the public domain such as, SPM8 [1], EPI nonlinear
geometric distortion correction [2], various FSL tools [3], FreeSurfer [4], Insight Toolkit (ITK) [5] and in house
MATLAB scripts.
In brief, the pipeline performs 1) motion correction of the individual ASL frames, 2) computation of the PWI
by subtracting the mean of tagged from untagged ASL data sets, 3) alignment of ASL and structural MRI data,
4) geometric distortion correction, 5) partial volume correction, 6) and CBF quantification in physical units by
normalizing ASL to an estimated blood water density signal.
The outputs include the PWI and a CBF image, both corrected for EPI distortion in two representations: a) in
native perfusion MRI space and b) in the subject-specific space of the corresponding structural MRI data. Each
output offers users a variety of options for further processing and analysis of the data, such as subject-specific
analysis using anatomical regions of interest or group-specific analysis, such as parametric mapping.In addition,
summary measures of CBF within anatomically defined brain regions are provided separately.
Brief Description of ASL
The concept of ASL provides a means of measuring cerebral blood flow (CBF) completely noninvasive by
exploiting the endogenous spins of arterial water as a proxy for blood flow. Labeling (or tagging) is achieved by
selectively inverting the magnetization of the arterial spins using MRI principles. After a short delay, allowing
the arterial spins to reach the brain, conventional MRI methods are used to map the spatial distribution of the
ASL signal. The signal to noise ratio of ASL signal is inherently low due to intense background signal from
tissue water. Therefore, the ADNI-2 ASL acquisition protocol requires a set of 52 pairs of repeated tagged and
untagged image frames which are then averaged to increase the SNR.
Many variants of ASL have been developed over the years, such as continuous, pulsed, and velocity selective
labeling. Here, we describe a pipeline to process a version of pulsed ASL method referred to as “QUIPSS II with
thin-slice TI1 periodic saturation” or “Q2TIPS” [6], augmented by conventional echo-planar imaging (EPI),
which has been used in ADNI-2. In Q2TIPS, arterial spins are labeled within a thick (≈ 10 cm) inversion slab,
placed proximal to the imaging slices, as shown in the figure below. The critical timing parameters of Q2TIPS
for quantifying flow are the ASL bolus duration and the transit delay from the time of inversion to the time of
EPI mapping.
1
Diagram of ASL regions
http://www.birncommunity.org/wp-content/uploads/2009/08/4077_Rasmussen.pdf
ASL-MRI Pre-Processing Steps
1. Motion Correction: The ASL image series is converted from DICOM to NiFTI format. Each frame is
aligned to the first frame to correct for head motion, by a rigid body transformation and least squares
fitting, using SPM8.
2. PWI Computations: The ASL images are arranged in groups of tagged and untagged scans and the mean
of each group is computed and saved as an image. Then the difference of the mean-tagged and mean-
untagged images (meantagged −meanuntagged) is taken to obtain a PWI. In addition, the very first untagged
ASL image, which provides a fully relaxed MRI signal, is used as a reference of water density and termed
M0. The reference image is primarily used to calibrate the ASL signal for computations of the CBF and
also as an intermediate frame to estimate the transformation to co-register between images from the ASL
MRI and structural MRI. In this capacity, the M0 is used as the blood-water-density proxy, Mblood, see
below.
3. Intensity Scaling: The PWI image as well as the M0 image, are intensity scaled. The PWI is scaled to
account for signal decay during acquisition and also to provide intensities in meaningful physical units.
The M0 is scaled to become Mblood, that is, water to blood density.
Description of PWI Scaling: PWI intensities are corrected for the longitudinal relaxation of the spin
tracers during data acquisition, including time lags between consecutive image slices, as well as for incomplete
labeling. Assuming an ascending slice order at acquisition with n = 1 indicating the first slice, the intensity
correction for the nth slice is:
PWIlag−corr =
PWIraw
2αTI1
e[R1a(TI2+(n−1) τ)]
, (1)
where α is the tagging efficiency, R1a is the longitudinal relaxation rate of blood, TI1 is the inversion time of
arterial spins and TI2, is the total transit time of the spins, n is the nth slice, and τ is the time lag between
slices.Specific intensity correction parameters used in our implementation are reported in Table 1. R1a is a
2
biological parameter whereas TI1, TI2, and τ are specific to ADNI-2 acquisition protocol. The resultant image
in the native ASL image space is provided in units of blood flow.
Intensity Scaling of M0: The control (M0) image is scaled to estimate a map of the blood magnetization,
Mblood by correcting for the lower density of tissue water relative to arterial blood water, λ , and for the different
relaxation characteristics of tissue and arterial blood water,as follows:
Mblood =
M0
λ
e(R∗
2tissue− R∗
2blood)TE
, (2)
where λ is the blood/water ratio in tissue, R∗ are the two relaxation rates and TE is the blood relaxation time.
See table 1 for the parameter values.
Table 1
Parameter Values
α 0.95
λ 0.90
τ 22.5 ms
TE 12 ms or 13 ms protocol specific
TI1 700 (ms)
TI2 1900 (ms)
R1a 1/1684 (kHz) [8]
R∗2tissue 1/44 ms [9]
R∗2blood 1/43 ms [10]
Computing A CBF in ASL Space: A CBF map in the ASL space, can be formed with the Mblood and
the PWIlag−corr, using,
CBFASL =
PWIlag−corr
Mblood
. (3)
Structural-to-ASL coregistration and nonlinear
geometric distortion correction
EPI-based perfusion images suffer from nonlinear geometric distortion due to magnetic susceptibility variations
whereas structural MR images are less susceptible to geometric distortions. This is a key challenge in achieving
an accurate anatomical match between data from ASL-MRI and structural MRIs. We use a variational image-
based approach to correct for these EPI-induced nonlinear geometric distortions in ASL-MRIs.
The geometric distortion correction step is performed in the PWI native space. Instead of using the T2∗ image,
we use a simulated T2 weighted image, made from the T1 in the acquisition series. The T2 simulation process
is briefly described in the appendix.
The processing steps for nonlinear geometric distortion correction areas follows:
• SimT2 image is masked leaving a layer of sulcal CSF around the brain.
3
• Mblood is skull stripped with BET [7] and coregistered to the masked T2 using the normalized mutual
information metric with 9 degrees of freedom.
• Masked SimT2 is down sampled to the Mblood space and named, T2rPWI.
• Distortion correction performed on the Mblood using the T2rPWI and the correction field applied to the
PWI.
Partial Volume Correction
We are interested in the blood flow of gray matter tissue (GM), which is bounded by cerebrospinal fluid (CSF)
and white matter (WM) tissues. To correct for variations in both PWIlag−corr and Mblood due to variable
coverage of GM, WM and CSF at each voxel, both images are corrected for the tissue partial volume effects
before computation of a CBF map.
Both PWIlag−corr and Mblood maps are first upsampled to the T1-weighted MR image space using trilinear
interpolation and inverse affine transformation estimated to coregister simulated T2 to masked Mblood.
The PWIlag−corr intensities are adjusted voxel wise, according to GM and WM tissue density distributions
estimated using 4 tissue segmentation provided by SPM8, and assuming a constant ratio between GM and WM
matter perfusion. The intensities are corrected according to,
PWIgm = (PWIrT1)
[
GM
GM + 0.4WM
.
]
(4)
Here, PWIrT1 is the PWIlag−corr resliced to T1 image space. βGM and βWM are the volume fractions of gray
matter and white matter respectively.
In this partial volume model of PWIrT1, we assume that signal at each voxel is a weighted linear combination of
perfusion from GM and WM, with the weighting coefficients expressing perfusion in terms of the corresponding
tissue densities (i.e., βi for i = GMi , WMi) and the ratio of GM to WM perfusion is spatially constant at 2.5
value (Kanetaka et al., 2004) [11].
A similar PVC is performed for the Mblood . In contrast to PWI, however, partial volume correction for the tissue
water reference image needs to include CSF. Partial volume correction of the Mblood is computed according to,
Mblood−PV C = (MrT1−blood)
[
γGM
(
γ−1
GM + γ−1
1 WM + γ−1
2 CSF
)]
+ κ . (5)
The ratios of tissues to water are,
γ =
GM
H2O
= 0.78 , γ1 =
WM
H2O
= 0.65 , γ2 =
CSF
H2O
= 0.97 ,
and
κ =
1 −
∑
(GM + WM + CSF)
1 × 10100
.
4
The κ parameter is used to regularize the CBF computation (see next section),in the limits where the voxels
are entirely made up of gray matter in the CBF ( numerator ) image, or CSF.
Computation of CBF in T1 Space
The PWIPV C, is normalized by the Mblood−PV C to express the ASL signal in physical units of arterial water
density
(
ml
100g 60s
)
, yielding CBF according to
CBF =
PWIPV C
Mblood−PV C
. (6)
The Mblood in the denominator, is spatially smoothed using a 3D isotropic Gaussian smoothing kernel, whose
FWHM is the largest voxel dimension in millimeters, of the native ASL MR image. The normalization also
eliminates spatial B1-inhomogeneity by definition, since both maps are subject to the same B1-inhomogeneity
distribution.
The CBF image is also threshold-ed for high intensity outliers by finding the intensity, C, that corresponds
to 1% of mean CBF signal. The global mean CBF is computed as the center of a the mode in a histogram of
the normalized output. CBF intensities are then truncated such that intensities greater than are set to C + ϵr,
where ϵr is a random number between zero and one.
The CBF data type is initially double precision floating point numbers. The final output CBF is saved with a
data type of INT32. To preserve the data through this change of data type, the values are scaled up by 1 × 10⁴.
Therefore, all values read from a viewer must be divided by 1 × 10⁴ to obtain CBF in units of ml/100mg/min .
CBF =
voxel intensity
1 × 10⁴ (7)
Free Surfer ROI Statistics
In addition to the CBF image, ROI statistics from anatomical regions of interest are also computed, from the
CBF image in T1 space. FreeSurfer is used to segment sub-cortical structures and parcellate the cortical surface
into regions of interest (ROI). Because the ASL-MRI acquisition might have partial brain coverage (e.g., possible
temporal and occipital cut-offs), FreeSurfer ROIs are truncated with a non-zero CBF brain mask. An Insight-
Toolkit (ITK) based in house C++ program is then employed to compute the quantities listed below. The
output is a space delimited text file named ‘ROIperfusion.log’ and contains only regions with a non-zero count
of voxels in the ROI.
• number of voxels in the ROI
• minimum
• maximum
• mean
• median
• standard deviation
5
CBF Output Quality Control (QC) Criteria and Steps
1. Image Quality QC
(a) Raw Data QC: Pass/Fail
i. This is the only level where we are making a judgment based on the image quality.
ii. All data is run regardless of QC
2. Processing QC: Registration check to determine the success of the processing pypeline
(a) Registration QC: The output image check and the only category that determines exclusion from
uploads.
i. This QC is performed by overlaying the Final Mblood file (“SubjectCode Mblood-EpiCorr-rT1-
PVC-Smoothed.nii”) onto the raw T1 (“SubjectCode T1.nii”).
ii. Pass: Mblood overlays completely onto T1. Verified by checking brain edges and, if possible,
Vents.
iii. Follow-up: Anything strange; brain edges not aligned, Ventricles off, or perhaps a 3D lateral shift
iv. Note: We are not doing a QC on the quality of the MBlood image. So any signal loss in the
extremities like inferior temps or medialorbitofrontal does not affect the rating. We are checking
for a successful registration only.
(b) There is no rating of Fail in the processing QCs because at the moment we are attempting to resolve
all issues that require follow-up.
Mblood-EpiCorr-rT1-PVC-Smoothed.nii
QC Registration Pass QC Registration Follow Up
6
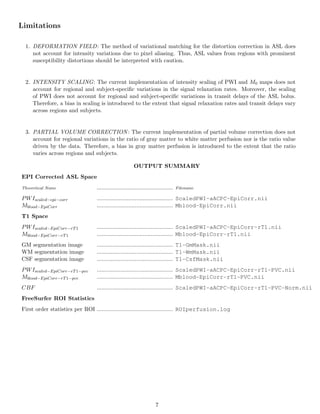
Limitations
1. DEFORMATION FIELD: The method of variational matching for the distortion correction in ASL does
not account for intensity variations due to pixel aliasing. Thus, ASL values from regions with prominent
susceptibility distortions should be interpreted with caution.
2. INTENSITY SCALING: The current implementation of intensity scaling of PWI and M0 maps does not
account for regional and subject-specific variations in the signal relaxation rates. Moreover, the scaling
of PWI does not account for regional and subject-specific variations in transit delays of the ASL bolus.
Therefore, a bias in scaling is introduced to the extent that signal relaxation rates and transit delays vary
across regions and subjects.
3. PARTIAL VOLUME CORRECTION : The current implementation of partial volume correction does not
account for regional variations in the ratio of gray matter to white matter perfusion nor is the ratio value
driven by the data. Therefore, a bias in gray matter perfusion is introduced to the extent that the ratio
varies across regions and subjects.
OUTPUT SUMMARY
EPI Corrected ASL Space
Theoretical Name ................................................ Filename
PWIscaled−epi−corr ................................................ ScaledPWI-aACPC-EpiCorr.nii
Mblood−EpiCorr ................................................ Mblood-EpiCorr.nii
T1 Space
PWIscaled−EpiCorr−rT1 ................................................ ScaledPWI-aACPC-EpiCorr-rT1.nii
Mblood−EpiCorr−rT1 ................................................ Mblood-EpiCorr-rT1.nii
GM segmentation image ................................................ T1-GmMask.nii
WM segmentation image ................................................ T1-WmMask.nii
CSF segmentation image ................................................ T1-CsfMask.nii
PWIscaled−EpiCorr−rT1−pvc ................................................ ScaledPWI-aACPC-EpiCorr-rT1-PVC.nii
Mblood−EpiCorr−rT1−pvc ................................................ Mblood-EpiCorr-rT1-PVC.nii
CBF ................................................ ScaledPWI-aACPC-EpiCorr-rT1-PVC-Norm.nii
FreeSurfer ROI Statistics
First order statistics per ROI ................................................ ROIperfusion.log
7
Processing Steps Flow Diagram
8
Appendix: Simulated T2-weighted MRI
A framework to simulate subject-specific T2-weighted MR images was engineered by Dr Duygu Tosun-Turgut.
The framework is based on the work by Benoit-Cattin et al.[12] To mimic clinical neuroimaging practice, we
chose the following 2D Turbo Spin Echo (TSE) sequence parameters for simulated T2-MRI.
Parameter Value
TR 3210 ms
TE 101 ms
slice thickness 3 mm
resolution 1 × 1 mm
flip angle 150◦
bandwidth 185 Hz
GRAPPA 2
T2-MRI simulation steps are as follows:
In brief, the steps to make a simulated T2 are:
• Create a binary brain tissue mask from FreeSurfer ’aparc+aseg’ anatomical annotation.
• Apply a morphological closing operator followed by a morphological dilation to eliminate holes in brain
mask and to include sulcal CSF.
• Apply resulting brain mask to T1-MRI, yielding skull-stripped T1 image.
• Downsample skull-stripped T1 image to 1 × 1 × 3 mm3 image resolution to mimic clinical neuro imaging
practice.
• Apply a fuzzy c-means clustering algorithm to estimate GM,WM, and CSF tissue density at each image
voxel in downsampled skull-stripped T1 image space
• Based on selected acquisition parameters and tissue density estimates, simulate a T2-MRI.
Each 2D axial slice is simulated separately and finally merged back to form a simulated 3D T2-MRI.
Data Set Information
UCSF ASL FS Uploaded on November 1st, 2012
References
1. http://www.fil.ion.ucl.ac.uk/spm/
9
2. Ran Tao, P. Thomas Fletcher, et al. (2009). ”A Variational Image-Based Approach to the Correction
of Susceptibility Artifacts in the Alignment of Diffusion Weighted and Structural MRI.” Process Med
Imaging 21: 664-675.
3. http://www.fmrib.ox.ac.uk/fsl/
4. http://surfer.nmr.mgh.harvard.edu/fswiki/FreeSurferMethodsCitation
5. T.S. Yoo, M. J. Ackerman, W. E. Lorensen, W. Schroeder, V. Chalana, S. Aylward, D. Metaxes, R.
Whitaker. Engineering and Algorithm Design for an Image Processing API: A Technical Report on ITK -
The Insight Toolkit. In Proc. of Medicine Meets Virtual Reality, J. Westwood, ed., IOS Press Amsterdam
pp 586-592 (2002).
6. Luh et al., Magn. Reson. Med. 41:1246-1254 (1999)
7. S.M. Smith, Fast robust automated brain extraction; Human Brain Mapping, 17(3):143-155, November
2002.
8. Lu at al., Magn. Reson. Med. 52(3):679-82;(2004)
9. Donahue et al., Magn. Reson. Med. 56:1261-73;(2006)
10. Zhao et al.Magn. Reson. Med. 58:592-97;(2007)
11. Kanetaka, H., Matsuda, H., Asada, T., Ohnishi, T., Yamashita, F., Imabayashi, E., Tanaka, F., Nakano, S.,
Takasaki, M., 2004. Effects of partial volume correction on discrimination between very early Alzheimer’s
dementia and controls using brain perfusion SPECT. Eur. J. Nucl. Med. Mol. Imaging 31, 975-980.
12. H. Benoit-Cattin, G. Collewet, B. Belaroussi, H. Saint-Jalmes, C. Odet, The SIMRI project: a versatile
and interactive MRI simulator, Journal of Magnetic Resonance, Volume 173, Issue 1, March 2005, Pages
97-115, ISSN 1090-7807, 10.1016/j.jmr.2004.09.027.
Contact Information
This document was prepared by Daniel Cuneo, UCSF/SF VA Medical Center. For more information please
contact Alix Simonson at alix.simonson@va.gov or Diana Truran-Sacrey at diana.truran@ucsf.edu.
10

More Related Content

What's hot

International Journal of Engineering Research and Development (IJERD)
International Journal of Engineering Research and Development (IJERD)International Journal of Engineering Research and Development (IJERD)
International Journal of Engineering Research and Development (IJERD)
IJERD Editor
 
Adaptive lifting based image compression scheme using interactive artificial ...
Adaptive lifting based image compression scheme using interactive artificial ...Adaptive lifting based image compression scheme using interactive artificial ...
Adaptive lifting based image compression scheme using interactive artificial ...
csandit
 
Image Registration using NSCT and Invariant Moment
Image Registration using NSCT and Invariant MomentImage Registration using NSCT and Invariant Moment
Image Registration using NSCT and Invariant Moment
CSCJournals
 
Analysis of Cholesterol Quantity Detection and ANN Classification
Analysis of Cholesterol Quantity Detection and ANN ClassificationAnalysis of Cholesterol Quantity Detection and ANN Classification
Analysis of Cholesterol Quantity Detection and ANN Classification
IJCSIS Research Publications
 
Jl2516751681
Jl2516751681Jl2516751681
Jl2516751681
IJERA Editor
 
Ijetcas14 504
Ijetcas14 504Ijetcas14 504
Ijetcas14 504
Iasir Journals
 
H017416670
H017416670H017416670
H017416670
IOSR Journals
 
PIPELINED ARCHITECTURE OF 2D-DCT, QUANTIZATION AND ZIGZAG PROCESS FOR JPEG IM...
PIPELINED ARCHITECTURE OF 2D-DCT, QUANTIZATION AND ZIGZAG PROCESS FOR JPEG IM...PIPELINED ARCHITECTURE OF 2D-DCT, QUANTIZATION AND ZIGZAG PROCESS FOR JPEG IM...
PIPELINED ARCHITECTURE OF 2D-DCT, QUANTIZATION AND ZIGZAG PROCESS FOR JPEG IM...
VLSICS Design
 
Compressed Medical Image Transfer in Frequency Domain
Compressed Medical Image Transfer in Frequency DomainCompressed Medical Image Transfer in Frequency Domain
Compressed Medical Image Transfer in Frequency Domain
CSCJournals
 
Digital image processing
Digital image processingDigital image processing
Digital image processing
Astha Jain
 
11.0003www.iiste.org call for paper_d_discrete cosine transform for image com...
11.0003www.iiste.org call for paper_d_discrete cosine transform for image com...11.0003www.iiste.org call for paper_d_discrete cosine transform for image com...
11.0003www.iiste.org call for paper_d_discrete cosine transform for image com...Alexander Decker
 

What's hot (13)

International Journal of Engineering Research and Development (IJERD)
International Journal of Engineering Research and Development (IJERD)International Journal of Engineering Research and Development (IJERD)
International Journal of Engineering Research and Development (IJERD)
 
Adaptive lifting based image compression scheme using interactive artificial ...
Adaptive lifting based image compression scheme using interactive artificial ...Adaptive lifting based image compression scheme using interactive artificial ...
Adaptive lifting based image compression scheme using interactive artificial ...
 
Image Registration using NSCT and Invariant Moment
Image Registration using NSCT and Invariant MomentImage Registration using NSCT and Invariant Moment
Image Registration using NSCT and Invariant Moment
 
Analysis of Cholesterol Quantity Detection and ANN Classification
Analysis of Cholesterol Quantity Detection and ANN ClassificationAnalysis of Cholesterol Quantity Detection and ANN Classification
Analysis of Cholesterol Quantity Detection and ANN Classification
 
Jl2516751681
Jl2516751681Jl2516751681
Jl2516751681
 
Ijetcas14 504
Ijetcas14 504Ijetcas14 504
Ijetcas14 504
 
H017416670
H017416670H017416670
H017416670
 
MTP paper
MTP paperMTP paper
MTP paper
 
PIPELINED ARCHITECTURE OF 2D-DCT, QUANTIZATION AND ZIGZAG PROCESS FOR JPEG IM...
PIPELINED ARCHITECTURE OF 2D-DCT, QUANTIZATION AND ZIGZAG PROCESS FOR JPEG IM...PIPELINED ARCHITECTURE OF 2D-DCT, QUANTIZATION AND ZIGZAG PROCESS FOR JPEG IM...
PIPELINED ARCHITECTURE OF 2D-DCT, QUANTIZATION AND ZIGZAG PROCESS FOR JPEG IM...
 
Compressed Medical Image Transfer in Frequency Domain
Compressed Medical Image Transfer in Frequency DomainCompressed Medical Image Transfer in Frequency Domain
Compressed Medical Image Transfer in Frequency Domain
 
Digital image processing
Digital image processingDigital image processing
Digital image processing
 
By4301435440
By4301435440By4301435440
By4301435440
 
11.0003www.iiste.org call for paper_d_discrete cosine transform for image com...
11.0003www.iiste.org call for paper_d_discrete cosine transform for image com...11.0003www.iiste.org call for paper_d_discrete cosine transform for image com...
11.0003www.iiste.org call for paper_d_discrete cosine transform for image com...
 

Viewers also liked

Neurology advanced asl jy gauvrit
Neurology advanced asl jy gauvritNeurology advanced asl jy gauvrit
Neurology advanced asl jy gauvritJFIM
 
Alzforum Corriveau
Alzforum CorriveauAlzforum Corriveau
Alzforum Corriveau
Alzforum
 
Alzforum Benzinger
Alzforum Benzinger Alzforum Benzinger
Alzforum Benzinger
Alzforum
 
Neurovascular Regulation in Health and Disease
Neurovascular Regulation in Health and DiseaseNeurovascular Regulation in Health and Disease
Neurovascular Regulation in Health and Disease
Alzforum
 
Alzforum Berislav Zlokovic
Alzforum Berislav ZlokovicAlzforum Berislav Zlokovic
Alzforum Berislav Zlokovic
Alzforum
 
The Glymphatic System – A New Player in Alzheimer Disease?
The Glymphatic System – A New Player  in Alzheimer Disease?The Glymphatic System – A New Player  in Alzheimer Disease?
The Glymphatic System – A New Player in Alzheimer Disease?
Alzforum
 
Vascular Dementia and Mixed Dementia
Vascular Dementia and Mixed DementiaVascular Dementia and Mixed Dementia
Vascular Dementia and Mixed Dementia
wef
 
Presentation1.pptx, perfusiona and specroscopy imaging in brain tumour.
Presentation1.pptx, perfusiona and specroscopy imaging in brain tumour.Presentation1.pptx, perfusiona and specroscopy imaging in brain tumour.
Presentation1.pptx, perfusiona and specroscopy imaging in brain tumour.Abdellah Nazeer
 
imaging and anatomy of blood supply of brain
imaging and anatomy of blood supply of brainimaging and anatomy of blood supply of brain
imaging and anatomy of blood supply of brain
Sunil Kumar
 
Perfusion and dynamic contrast enhanced mri
Perfusion and dynamic contrast enhanced mriPerfusion and dynamic contrast enhanced mri
Perfusion and dynamic contrast enhanced mri
fahad shafi
 
Diffusion-weighted and Perfusion MR Imaging for Brain Tumor Characterization ...
Diffusion-weighted and Perfusion MR Imaging for Brain Tumor Characterization ...Diffusion-weighted and Perfusion MR Imaging for Brain Tumor Characterization ...
Diffusion-weighted and Perfusion MR Imaging for Brain Tumor Characterization ...
Arif S
 
DWI/ ADC MRI principles/ applications in veterinary medicine
DWI/ ADC MRI principles/ applications  in veterinary medicineDWI/ ADC MRI principles/ applications  in veterinary medicine
DWI/ ADC MRI principles/ applications in veterinary medicine
Robert Cruz
 
Diffusion Weighted MRI (2011-09-29 이정원)
Diffusion Weighted MRI (2011-09-29 이정원)Diffusion Weighted MRI (2011-09-29 이정원)
Diffusion Weighted MRI (2011-09-29 이정원)
이정원 JeongwonLee
 

Viewers also liked (15)

Neurology advanced asl jy gauvrit
Neurology advanced asl jy gauvritNeurology advanced asl jy gauvrit
Neurology advanced asl jy gauvrit
 
Alzforum Corriveau
Alzforum CorriveauAlzforum Corriveau
Alzforum Corriveau
 
CVRPresentation2016
CVRPresentation2016CVRPresentation2016
CVRPresentation2016
 
Alzforum Benzinger
Alzforum Benzinger Alzforum Benzinger
Alzforum Benzinger
 
Neurovascular Regulation in Health and Disease
Neurovascular Regulation in Health and DiseaseNeurovascular Regulation in Health and Disease
Neurovascular Regulation in Health and Disease
 
Alzforum Berislav Zlokovic
Alzforum Berislav ZlokovicAlzforum Berislav Zlokovic
Alzforum Berislav Zlokovic
 
The Glymphatic System – A New Player in Alzheimer Disease?
The Glymphatic System – A New Player  in Alzheimer Disease?The Glymphatic System – A New Player  in Alzheimer Disease?
The Glymphatic System – A New Player in Alzheimer Disease?
 
Vascular Dementia and Mixed Dementia
Vascular Dementia and Mixed DementiaVascular Dementia and Mixed Dementia
Vascular Dementia and Mixed Dementia
 
Presentation1.pptx, perfusiona and specroscopy imaging in brain tumour.
Presentation1.pptx, perfusiona and specroscopy imaging in brain tumour.Presentation1.pptx, perfusiona and specroscopy imaging in brain tumour.
Presentation1.pptx, perfusiona and specroscopy imaging in brain tumour.
 
imaging and anatomy of blood supply of brain
imaging and anatomy of blood supply of brainimaging and anatomy of blood supply of brain
imaging and anatomy of blood supply of brain
 
Perfusion and dynamic contrast enhanced mri
Perfusion and dynamic contrast enhanced mriPerfusion and dynamic contrast enhanced mri
Perfusion and dynamic contrast enhanced mri
 
Dementia
DementiaDementia
Dementia
 
Diffusion-weighted and Perfusion MR Imaging for Brain Tumor Characterization ...
Diffusion-weighted and Perfusion MR Imaging for Brain Tumor Characterization ...Diffusion-weighted and Perfusion MR Imaging for Brain Tumor Characterization ...
Diffusion-weighted and Perfusion MR Imaging for Brain Tumor Characterization ...
 
DWI/ ADC MRI principles/ applications in veterinary medicine
DWI/ ADC MRI principles/ applications  in veterinary medicineDWI/ ADC MRI principles/ applications  in veterinary medicine
DWI/ ADC MRI principles/ applications in veterinary medicine
 
Diffusion Weighted MRI (2011-09-29 이정원)
Diffusion Weighted MRI (2011-09-29 이정원)Diffusion Weighted MRI (2011-09-29 이정원)
Diffusion Weighted MRI (2011-09-29 이정원)
 

Similar to LONI_ASL_DOC

Myocardial triglyceride Cardiac Amyloidosis MR Spectroscopy
Myocardial triglyceride Cardiac Amyloidosis MR SpectroscopyMyocardial triglyceride Cardiac Amyloidosis MR Spectroscopy
Myocardial triglyceride Cardiac Amyloidosis MR Spectroscopy
PRAMOD KUMAR
 
Advances in neuro-imaging
Advances in neuro-imaging Advances in neuro-imaging
Advances in neuro-imaging
Osama Ragab
 
Perfusion MRI (DSC and DCE perfusion techniques) for radiology residents
Perfusion MRI (DSC and DCE perfusion techniques) for radiology residentsPerfusion MRI (DSC and DCE perfusion techniques) for radiology residents
Perfusion MRI (DSC and DCE perfusion techniques) for radiology residents
Riham Dessouky
 
Image compression based on
Image compression based onImage compression based on
Image compression based on
ijma
 
1804.06812
1804.068121804.06812
1804.06812
maicu1
 
Medical image fusion based on NSCT and wavelet transform
Medical image fusion based on NSCT and wavelet transformMedical image fusion based on NSCT and wavelet transform
Medical image fusion based on NSCT and wavelet transform
Anju Anjujosepj
 
Dsp review
Dsp reviewDsp review
Dsp review
ChetanShahukari
 
AN EFFICIENT WAVELET BASED FEATURE REDUCTION AND CLASSIFICATION TECHNIQUE FOR...
AN EFFICIENT WAVELET BASED FEATURE REDUCTION AND CLASSIFICATION TECHNIQUE FOR...AN EFFICIENT WAVELET BASED FEATURE REDUCTION AND CLASSIFICATION TECHNIQUE FOR...
AN EFFICIENT WAVELET BASED FEATURE REDUCTION AND CLASSIFICATION TECHNIQUE FOR...
ijcseit
 
AN EFFICIENT WAVELET BASED FEATURE REDUCTION AND CLASSIFICATION TECHNIQUE FOR...
AN EFFICIENT WAVELET BASED FEATURE REDUCTION AND CLASSIFICATION TECHNIQUE FOR...AN EFFICIENT WAVELET BASED FEATURE REDUCTION AND CLASSIFICATION TECHNIQUE FOR...
AN EFFICIENT WAVELET BASED FEATURE REDUCTION AND CLASSIFICATION TECHNIQUE FOR...
ijcseit
 
Dsp review 1,2,3
Dsp review 1,2,3Dsp review 1,2,3
Dsp review 1,2,3
ChetanShahukari
 
Performance Evaluation of Percent Root Mean Square Difference for ECG Signals...
Performance Evaluation of Percent Root Mean Square Difference for ECG Signals...Performance Evaluation of Percent Root Mean Square Difference for ECG Signals...
Performance Evaluation of Percent Root Mean Square Difference for ECG Signals...
CSCJournals
 
Poster RITS motion_correction
Poster RITS motion_correctionPoster RITS motion_correction
Poster RITS motion_correction
Rania BERRADA
 
Compressed sensing of excitatory
Compressed sensing of excitatoryCompressed sensing of excitatory
Compressed sensing of excitatory
csandit
 
COMPRESSED SENSING OF EXCITATORY POSTSYNAPTIC POTENTIAL BIO-SIGNALS
COMPRESSED SENSING OF EXCITATORY POSTSYNAPTIC POTENTIAL BIO-SIGNALSCOMPRESSED SENSING OF EXCITATORY POSTSYNAPTIC POTENTIAL BIO-SIGNALS
COMPRESSED SENSING OF EXCITATORY POSTSYNAPTIC POTENTIAL BIO-SIGNALS
cscpconf
 
COMPRESSED SENSING OF EXCITATORY POSTSYNAPTIC POTENTIAL BIO-SIGNALS
COMPRESSED SENSING OF EXCITATORY POSTSYNAPTIC POTENTIAL BIO-SIGNALSCOMPRESSED SENSING OF EXCITATORY POSTSYNAPTIC POTENTIAL BIO-SIGNALS
COMPRESSED SENSING OF EXCITATORY POSTSYNAPTIC POTENTIAL BIO-SIGNALS
cscpconf
 
Introduction to compressed sensing MRI
Introduction to compressed sensing MRIIntroduction to compressed sensing MRI
Introduction to compressed sensing MRI
Sairam Geethanath
 
IGRT APP.pdf
IGRT APP.pdfIGRT APP.pdf
IGRT APP.pdf
Kanhu Charan
 
Lung Nodule Segmentation in CT Images using Rotation Invariant Local Binary P...
Lung Nodule Segmentation in CT Images using Rotation Invariant Local Binary P...Lung Nodule Segmentation in CT Images using Rotation Invariant Local Binary P...
Lung Nodule Segmentation in CT Images using Rotation Invariant Local Binary P...
IDES Editor
 

Similar to LONI_ASL_DOC (20)

4D Flow MRI
4D Flow MRI4D Flow MRI
4D Flow MRI
 
Myocardial triglyceride Cardiac Amyloidosis MR Spectroscopy
Myocardial triglyceride Cardiac Amyloidosis MR SpectroscopyMyocardial triglyceride Cardiac Amyloidosis MR Spectroscopy
Myocardial triglyceride Cardiac Amyloidosis MR Spectroscopy
 
Advances in neuro-imaging
Advances in neuro-imaging Advances in neuro-imaging
Advances in neuro-imaging
 
Perfusion MRI (DSC and DCE perfusion techniques) for radiology residents
Perfusion MRI (DSC and DCE perfusion techniques) for radiology residentsPerfusion MRI (DSC and DCE perfusion techniques) for radiology residents
Perfusion MRI (DSC and DCE perfusion techniques) for radiology residents
 
Image compression based on
Image compression based onImage compression based on
Image compression based on
 
1804.06812
1804.068121804.06812
1804.06812
 
Medical image fusion based on NSCT and wavelet transform
Medical image fusion based on NSCT and wavelet transformMedical image fusion based on NSCT and wavelet transform
Medical image fusion based on NSCT and wavelet transform
 
Dsp review
Dsp reviewDsp review
Dsp review
 
AN EFFICIENT WAVELET BASED FEATURE REDUCTION AND CLASSIFICATION TECHNIQUE FOR...
AN EFFICIENT WAVELET BASED FEATURE REDUCTION AND CLASSIFICATION TECHNIQUE FOR...AN EFFICIENT WAVELET BASED FEATURE REDUCTION AND CLASSIFICATION TECHNIQUE FOR...
AN EFFICIENT WAVELET BASED FEATURE REDUCTION AND CLASSIFICATION TECHNIQUE FOR...
 
AN EFFICIENT WAVELET BASED FEATURE REDUCTION AND CLASSIFICATION TECHNIQUE FOR...
AN EFFICIENT WAVELET BASED FEATURE REDUCTION AND CLASSIFICATION TECHNIQUE FOR...AN EFFICIENT WAVELET BASED FEATURE REDUCTION AND CLASSIFICATION TECHNIQUE FOR...
AN EFFICIENT WAVELET BASED FEATURE REDUCTION AND CLASSIFICATION TECHNIQUE FOR...
 
Dsp review 1,2,3
Dsp review 1,2,3Dsp review 1,2,3
Dsp review 1,2,3
 
Performance Evaluation of Percent Root Mean Square Difference for ECG Signals...
Performance Evaluation of Percent Root Mean Square Difference for ECG Signals...Performance Evaluation of Percent Root Mean Square Difference for ECG Signals...
Performance Evaluation of Percent Root Mean Square Difference for ECG Signals...
 
PosterRexChinHaoChen2016
PosterRexChinHaoChen2016PosterRexChinHaoChen2016
PosterRexChinHaoChen2016
 
Poster RITS motion_correction
Poster RITS motion_correctionPoster RITS motion_correction
Poster RITS motion_correction
 
Compressed sensing of excitatory
Compressed sensing of excitatoryCompressed sensing of excitatory
Compressed sensing of excitatory
 
COMPRESSED SENSING OF EXCITATORY POSTSYNAPTIC POTENTIAL BIO-SIGNALS
COMPRESSED SENSING OF EXCITATORY POSTSYNAPTIC POTENTIAL BIO-SIGNALSCOMPRESSED SENSING OF EXCITATORY POSTSYNAPTIC POTENTIAL BIO-SIGNALS
COMPRESSED SENSING OF EXCITATORY POSTSYNAPTIC POTENTIAL BIO-SIGNALS
 
COMPRESSED SENSING OF EXCITATORY POSTSYNAPTIC POTENTIAL BIO-SIGNALS
COMPRESSED SENSING OF EXCITATORY POSTSYNAPTIC POTENTIAL BIO-SIGNALSCOMPRESSED SENSING OF EXCITATORY POSTSYNAPTIC POTENTIAL BIO-SIGNALS
COMPRESSED SENSING OF EXCITATORY POSTSYNAPTIC POTENTIAL BIO-SIGNALS
 
Introduction to compressed sensing MRI
Introduction to compressed sensing MRIIntroduction to compressed sensing MRI
Introduction to compressed sensing MRI
 
IGRT APP.pdf
IGRT APP.pdfIGRT APP.pdf
IGRT APP.pdf
 
Lung Nodule Segmentation in CT Images using Rotation Invariant Local Binary P...
Lung Nodule Segmentation in CT Images using Rotation Invariant Local Binary P...Lung Nodule Segmentation in CT Images using Rotation Invariant Local Binary P...
Lung Nodule Segmentation in CT Images using Rotation Invariant Local Binary P...
 

LONI_ASL_DOC

  • 1. UCSF ASL Perfusion Processing Methods Daniel Cuneo, Derek Flenniken, Duygu Tosun-Turgut, PhD, Norbert Schuff, PhD November 6, 2012
  • 2. Contents Overview 1 Brief Description of ASL 1 ASL-MRI Pre-Processing Steps 2 Structural-to-ASL coregistration and nonlinear geometric distortion correction 3 Partial Volume Correction 4 Computation of CBF in T1 Space 5 Free Surfer ROI Statistics 5 CBF Output Quality Control (QC) Criteria and Steps 6 Limitations 7 Processing Steps Flow Diagram 8 Simulated T2-weighted MRI 9 Data Set Information 9 References 9 Contact Information 10
  • 3. Overview The Center for Imaging of Neurodegenerative Diseases (CIND) processing pipeline for Arterial Spin Label (ASL) imaging, prepares perfusion-weighted images (PWI) and computes a quantitative map of cerebral blood flow (CBF) and a regional analysis. The quantification of CBF and correspondence to high-resolution anatomical MRI data, is achieved by implementing multiple tools from the public domain such as, SPM8 [1], EPI nonlinear geometric distortion correction [2], various FSL tools [3], FreeSurfer [4], Insight Toolkit (ITK) [5] and in house MATLAB scripts. In brief, the pipeline performs 1) motion correction of the individual ASL frames, 2) computation of the PWI by subtracting the mean of tagged from untagged ASL data sets, 3) alignment of ASL and structural MRI data, 4) geometric distortion correction, 5) partial volume correction, 6) and CBF quantification in physical units by normalizing ASL to an estimated blood water density signal. The outputs include the PWI and a CBF image, both corrected for EPI distortion in two representations: a) in native perfusion MRI space and b) in the subject-specific space of the corresponding structural MRI data. Each output offers users a variety of options for further processing and analysis of the data, such as subject-specific analysis using anatomical regions of interest or group-specific analysis, such as parametric mapping.In addition, summary measures of CBF within anatomically defined brain regions are provided separately. Brief Description of ASL The concept of ASL provides a means of measuring cerebral blood flow (CBF) completely noninvasive by exploiting the endogenous spins of arterial water as a proxy for blood flow. Labeling (or tagging) is achieved by selectively inverting the magnetization of the arterial spins using MRI principles. After a short delay, allowing the arterial spins to reach the brain, conventional MRI methods are used to map the spatial distribution of the ASL signal. The signal to noise ratio of ASL signal is inherently low due to intense background signal from tissue water. Therefore, the ADNI-2 ASL acquisition protocol requires a set of 52 pairs of repeated tagged and untagged image frames which are then averaged to increase the SNR. Many variants of ASL have been developed over the years, such as continuous, pulsed, and velocity selective labeling. Here, we describe a pipeline to process a version of pulsed ASL method referred to as “QUIPSS II with thin-slice TI1 periodic saturation” or “Q2TIPS” [6], augmented by conventional echo-planar imaging (EPI), which has been used in ADNI-2. In Q2TIPS, arterial spins are labeled within a thick (≈ 10 cm) inversion slab, placed proximal to the imaging slices, as shown in the figure below. The critical timing parameters of Q2TIPS for quantifying flow are the ASL bolus duration and the transit delay from the time of inversion to the time of EPI mapping. 1
  • 4. Diagram of ASL regions http://www.birncommunity.org/wp-content/uploads/2009/08/4077_Rasmussen.pdf ASL-MRI Pre-Processing Steps 1. Motion Correction: The ASL image series is converted from DICOM to NiFTI format. Each frame is aligned to the first frame to correct for head motion, by a rigid body transformation and least squares fitting, using SPM8. 2. PWI Computations: The ASL images are arranged in groups of tagged and untagged scans and the mean of each group is computed and saved as an image. Then the difference of the mean-tagged and mean- untagged images (meantagged −meanuntagged) is taken to obtain a PWI. In addition, the very first untagged ASL image, which provides a fully relaxed MRI signal, is used as a reference of water density and termed M0. The reference image is primarily used to calibrate the ASL signal for computations of the CBF and also as an intermediate frame to estimate the transformation to co-register between images from the ASL MRI and structural MRI. In this capacity, the M0 is used as the blood-water-density proxy, Mblood, see below. 3. Intensity Scaling: The PWI image as well as the M0 image, are intensity scaled. The PWI is scaled to account for signal decay during acquisition and also to provide intensities in meaningful physical units. The M0 is scaled to become Mblood, that is, water to blood density. Description of PWI Scaling: PWI intensities are corrected for the longitudinal relaxation of the spin tracers during data acquisition, including time lags between consecutive image slices, as well as for incomplete labeling. Assuming an ascending slice order at acquisition with n = 1 indicating the first slice, the intensity correction for the nth slice is: PWIlag−corr = PWIraw 2αTI1 e[R1a(TI2+(n−1) τ)] , (1) where α is the tagging efficiency, R1a is the longitudinal relaxation rate of blood, TI1 is the inversion time of arterial spins and TI2, is the total transit time of the spins, n is the nth slice, and τ is the time lag between slices.Specific intensity correction parameters used in our implementation are reported in Table 1. R1a is a 2
  • 5. biological parameter whereas TI1, TI2, and τ are specific to ADNI-2 acquisition protocol. The resultant image in the native ASL image space is provided in units of blood flow. Intensity Scaling of M0: The control (M0) image is scaled to estimate a map of the blood magnetization, Mblood by correcting for the lower density of tissue water relative to arterial blood water, λ , and for the different relaxation characteristics of tissue and arterial blood water,as follows: Mblood = M0 λ e(R∗ 2tissue− R∗ 2blood)TE , (2) where λ is the blood/water ratio in tissue, R∗ are the two relaxation rates and TE is the blood relaxation time. See table 1 for the parameter values. Table 1 Parameter Values α 0.95 λ 0.90 τ 22.5 ms TE 12 ms or 13 ms protocol specific TI1 700 (ms) TI2 1900 (ms) R1a 1/1684 (kHz) [8] R∗2tissue 1/44 ms [9] R∗2blood 1/43 ms [10] Computing A CBF in ASL Space: A CBF map in the ASL space, can be formed with the Mblood and the PWIlag−corr, using, CBFASL = PWIlag−corr Mblood . (3) Structural-to-ASL coregistration and nonlinear geometric distortion correction EPI-based perfusion images suffer from nonlinear geometric distortion due to magnetic susceptibility variations whereas structural MR images are less susceptible to geometric distortions. This is a key challenge in achieving an accurate anatomical match between data from ASL-MRI and structural MRIs. We use a variational image- based approach to correct for these EPI-induced nonlinear geometric distortions in ASL-MRIs. The geometric distortion correction step is performed in the PWI native space. Instead of using the T2∗ image, we use a simulated T2 weighted image, made from the T1 in the acquisition series. The T2 simulation process is briefly described in the appendix. The processing steps for nonlinear geometric distortion correction areas follows: • SimT2 image is masked leaving a layer of sulcal CSF around the brain. 3
  • 6. • Mblood is skull stripped with BET [7] and coregistered to the masked T2 using the normalized mutual information metric with 9 degrees of freedom. • Masked SimT2 is down sampled to the Mblood space and named, T2rPWI. • Distortion correction performed on the Mblood using the T2rPWI and the correction field applied to the PWI. Partial Volume Correction We are interested in the blood flow of gray matter tissue (GM), which is bounded by cerebrospinal fluid (CSF) and white matter (WM) tissues. To correct for variations in both PWIlag−corr and Mblood due to variable coverage of GM, WM and CSF at each voxel, both images are corrected for the tissue partial volume effects before computation of a CBF map. Both PWIlag−corr and Mblood maps are first upsampled to the T1-weighted MR image space using trilinear interpolation and inverse affine transformation estimated to coregister simulated T2 to masked Mblood. The PWIlag−corr intensities are adjusted voxel wise, according to GM and WM tissue density distributions estimated using 4 tissue segmentation provided by SPM8, and assuming a constant ratio between GM and WM matter perfusion. The intensities are corrected according to, PWIgm = (PWIrT1) [ GM GM + 0.4WM . ] (4) Here, PWIrT1 is the PWIlag−corr resliced to T1 image space. βGM and βWM are the volume fractions of gray matter and white matter respectively. In this partial volume model of PWIrT1, we assume that signal at each voxel is a weighted linear combination of perfusion from GM and WM, with the weighting coefficients expressing perfusion in terms of the corresponding tissue densities (i.e., βi for i = GMi , WMi) and the ratio of GM to WM perfusion is spatially constant at 2.5 value (Kanetaka et al., 2004) [11]. A similar PVC is performed for the Mblood . In contrast to PWI, however, partial volume correction for the tissue water reference image needs to include CSF. Partial volume correction of the Mblood is computed according to, Mblood−PV C = (MrT1−blood) [ γGM ( γ−1 GM + γ−1 1 WM + γ−1 2 CSF )] + κ . (5) The ratios of tissues to water are, γ = GM H2O = 0.78 , γ1 = WM H2O = 0.65 , γ2 = CSF H2O = 0.97 , and κ = 1 − ∑ (GM + WM + CSF) 1 × 10100 . 4
  • 7. The κ parameter is used to regularize the CBF computation (see next section),in the limits where the voxels are entirely made up of gray matter in the CBF ( numerator ) image, or CSF. Computation of CBF in T1 Space The PWIPV C, is normalized by the Mblood−PV C to express the ASL signal in physical units of arterial water density ( ml 100g 60s ) , yielding CBF according to CBF = PWIPV C Mblood−PV C . (6) The Mblood in the denominator, is spatially smoothed using a 3D isotropic Gaussian smoothing kernel, whose FWHM is the largest voxel dimension in millimeters, of the native ASL MR image. The normalization also eliminates spatial B1-inhomogeneity by definition, since both maps are subject to the same B1-inhomogeneity distribution. The CBF image is also threshold-ed for high intensity outliers by finding the intensity, C, that corresponds to 1% of mean CBF signal. The global mean CBF is computed as the center of a the mode in a histogram of the normalized output. CBF intensities are then truncated such that intensities greater than are set to C + ϵr, where ϵr is a random number between zero and one. The CBF data type is initially double precision floating point numbers. The final output CBF is saved with a data type of INT32. To preserve the data through this change of data type, the values are scaled up by 1 × 10⁴. Therefore, all values read from a viewer must be divided by 1 × 10⁴ to obtain CBF in units of ml/100mg/min . CBF = voxel intensity 1 × 10⁴ (7) Free Surfer ROI Statistics In addition to the CBF image, ROI statistics from anatomical regions of interest are also computed, from the CBF image in T1 space. FreeSurfer is used to segment sub-cortical structures and parcellate the cortical surface into regions of interest (ROI). Because the ASL-MRI acquisition might have partial brain coverage (e.g., possible temporal and occipital cut-offs), FreeSurfer ROIs are truncated with a non-zero CBF brain mask. An Insight- Toolkit (ITK) based in house C++ program is then employed to compute the quantities listed below. The output is a space delimited text file named ‘ROIperfusion.log’ and contains only regions with a non-zero count of voxels in the ROI. • number of voxels in the ROI • minimum • maximum • mean • median • standard deviation 5
  • 8. CBF Output Quality Control (QC) Criteria and Steps 1. Image Quality QC (a) Raw Data QC: Pass/Fail i. This is the only level where we are making a judgment based on the image quality. ii. All data is run regardless of QC 2. Processing QC: Registration check to determine the success of the processing pypeline (a) Registration QC: The output image check and the only category that determines exclusion from uploads. i. This QC is performed by overlaying the Final Mblood file (“SubjectCode Mblood-EpiCorr-rT1- PVC-Smoothed.nii”) onto the raw T1 (“SubjectCode T1.nii”). ii. Pass: Mblood overlays completely onto T1. Verified by checking brain edges and, if possible, Vents. iii. Follow-up: Anything strange; brain edges not aligned, Ventricles off, or perhaps a 3D lateral shift iv. Note: We are not doing a QC on the quality of the MBlood image. So any signal loss in the extremities like inferior temps or medialorbitofrontal does not affect the rating. We are checking for a successful registration only. (b) There is no rating of Fail in the processing QCs because at the moment we are attempting to resolve all issues that require follow-up. Mblood-EpiCorr-rT1-PVC-Smoothed.nii QC Registration Pass QC Registration Follow Up 6
  • 9. Limitations 1. DEFORMATION FIELD: The method of variational matching for the distortion correction in ASL does not account for intensity variations due to pixel aliasing. Thus, ASL values from regions with prominent susceptibility distortions should be interpreted with caution. 2. INTENSITY SCALING: The current implementation of intensity scaling of PWI and M0 maps does not account for regional and subject-specific variations in the signal relaxation rates. Moreover, the scaling of PWI does not account for regional and subject-specific variations in transit delays of the ASL bolus. Therefore, a bias in scaling is introduced to the extent that signal relaxation rates and transit delays vary across regions and subjects. 3. PARTIAL VOLUME CORRECTION : The current implementation of partial volume correction does not account for regional variations in the ratio of gray matter to white matter perfusion nor is the ratio value driven by the data. Therefore, a bias in gray matter perfusion is introduced to the extent that the ratio varies across regions and subjects. OUTPUT SUMMARY EPI Corrected ASL Space Theoretical Name ................................................ Filename PWIscaled−epi−corr ................................................ ScaledPWI-aACPC-EpiCorr.nii Mblood−EpiCorr ................................................ Mblood-EpiCorr.nii T1 Space PWIscaled−EpiCorr−rT1 ................................................ ScaledPWI-aACPC-EpiCorr-rT1.nii Mblood−EpiCorr−rT1 ................................................ Mblood-EpiCorr-rT1.nii GM segmentation image ................................................ T1-GmMask.nii WM segmentation image ................................................ T1-WmMask.nii CSF segmentation image ................................................ T1-CsfMask.nii PWIscaled−EpiCorr−rT1−pvc ................................................ ScaledPWI-aACPC-EpiCorr-rT1-PVC.nii Mblood−EpiCorr−rT1−pvc ................................................ Mblood-EpiCorr-rT1-PVC.nii CBF ................................................ ScaledPWI-aACPC-EpiCorr-rT1-PVC-Norm.nii FreeSurfer ROI Statistics First order statistics per ROI ................................................ ROIperfusion.log 7
  • 11. Appendix: Simulated T2-weighted MRI A framework to simulate subject-specific T2-weighted MR images was engineered by Dr Duygu Tosun-Turgut. The framework is based on the work by Benoit-Cattin et al.[12] To mimic clinical neuroimaging practice, we chose the following 2D Turbo Spin Echo (TSE) sequence parameters for simulated T2-MRI. Parameter Value TR 3210 ms TE 101 ms slice thickness 3 mm resolution 1 × 1 mm flip angle 150◦ bandwidth 185 Hz GRAPPA 2 T2-MRI simulation steps are as follows: In brief, the steps to make a simulated T2 are: • Create a binary brain tissue mask from FreeSurfer ’aparc+aseg’ anatomical annotation. • Apply a morphological closing operator followed by a morphological dilation to eliminate holes in brain mask and to include sulcal CSF. • Apply resulting brain mask to T1-MRI, yielding skull-stripped T1 image. • Downsample skull-stripped T1 image to 1 × 1 × 3 mm3 image resolution to mimic clinical neuro imaging practice. • Apply a fuzzy c-means clustering algorithm to estimate GM,WM, and CSF tissue density at each image voxel in downsampled skull-stripped T1 image space • Based on selected acquisition parameters and tissue density estimates, simulate a T2-MRI. Each 2D axial slice is simulated separately and finally merged back to form a simulated 3D T2-MRI. Data Set Information UCSF ASL FS Uploaded on November 1st, 2012 References 1. http://www.fil.ion.ucl.ac.uk/spm/ 9
  • 12. 2. Ran Tao, P. Thomas Fletcher, et al. (2009). ”A Variational Image-Based Approach to the Correction of Susceptibility Artifacts in the Alignment of Diffusion Weighted and Structural MRI.” Process Med Imaging 21: 664-675. 3. http://www.fmrib.ox.ac.uk/fsl/ 4. http://surfer.nmr.mgh.harvard.edu/fswiki/FreeSurferMethodsCitation 5. T.S. Yoo, M. J. Ackerman, W. E. Lorensen, W. Schroeder, V. Chalana, S. Aylward, D. Metaxes, R. Whitaker. Engineering and Algorithm Design for an Image Processing API: A Technical Report on ITK - The Insight Toolkit. In Proc. of Medicine Meets Virtual Reality, J. Westwood, ed., IOS Press Amsterdam pp 586-592 (2002). 6. Luh et al., Magn. Reson. Med. 41:1246-1254 (1999) 7. S.M. Smith, Fast robust automated brain extraction; Human Brain Mapping, 17(3):143-155, November 2002. 8. Lu at al., Magn. Reson. Med. 52(3):679-82;(2004) 9. Donahue et al., Magn. Reson. Med. 56:1261-73;(2006) 10. Zhao et al.Magn. Reson. Med. 58:592-97;(2007) 11. Kanetaka, H., Matsuda, H., Asada, T., Ohnishi, T., Yamashita, F., Imabayashi, E., Tanaka, F., Nakano, S., Takasaki, M., 2004. Effects of partial volume correction on discrimination between very early Alzheimer’s dementia and controls using brain perfusion SPECT. Eur. J. Nucl. Med. Mol. Imaging 31, 975-980. 12. H. Benoit-Cattin, G. Collewet, B. Belaroussi, H. Saint-Jalmes, C. Odet, The SIMRI project: a versatile and interactive MRI simulator, Journal of Magnetic Resonance, Volume 173, Issue 1, March 2005, Pages 97-115, ISSN 1090-7807, 10.1016/j.jmr.2004.09.027. Contact Information This document was prepared by Daniel Cuneo, UCSF/SF VA Medical Center. For more information please contact Alix Simonson at alix.simonson@va.gov or Diana Truran-Sacrey at diana.truran@ucsf.edu. 10