Nanoscale metrology of line patterns on semiconductor by continuous wave tera...
PosterRexChinHaoChen2016
1. Increasing
flow rate,
Increasing
blurriness†
“Speckle Contrast 𝑲 𝒔” quantifies
degree of blurriness of a speckle
pattern
𝐾 𝑠 =
𝜎𝑠
𝐼 𝑠
Increasing
flow rate,
decreasing
contrast†
(LD-D)
(LD)
(TM)
(C&P)
(R)
LD-D
Laser Diode
Driver
C&P
Camera
and
Polarizer
LD Laser Diode R Rat
TM
Trinocular
Microscope
PC
Personal
Computer
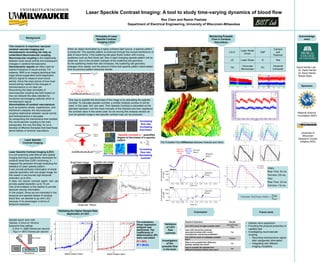
For evaluation,
linear regression
analysis was
performed. The
coefficients of
determination (R2)
were calculated
R2 = 96%
R2 = 99.6%
10
0
10
1
0
2
4
6
8
10
Relative Change in Speed
baselinec
/c
T=0.3ms
10
0
0
1
2
3
4
5
6
7
8
9
Relative Change in Speed
baselinec
/c
T=0.075ms
Laser Speckle
Contrast Imaging
Monitoring Pulsatile
Flow in Cerebral
Vasculature
Background
Conclusion Future work
This research is important, because
cerebral vascular imaging and
hemodynamic recording can help us
understand Neurovascular coupling.
Neurovascular coupling is the relationship
between local neural activity and subsequent
changes in cerebral hemodynamic.
Hemodynamic signals are often used as
indirect indicators of neural activity. For
instance, fMRI is an imaging technique that
maps blood-oxygenation-level-dependent
(BOLD) signal to measure local neural
activity. Since the clear picture of how local
neural activity related to the changes in
hemodynamics is not clear yet.
Discovering the basic principles of
neurovascular coupling has bold impact on
how we interpret the data collected by
functional neuroimaging methods which is
hemodynamic signal.
Abnormalities of cerebral vascularature
such as ischemic stroke, hypertension, and
Alzheimer's disease, the neurovascular
coupling relationship between neural activity
and hemodynamics is disrupted
So recognizing the mechanisms that mediate
this neurovascular coupling is the main
prerequisite, the very first step, for us to
develop of effective therapies that treat these
abnormalities of cerebral vasculature.
Laser Speckle Contrast Imaging (LSCI)
is a non-scanning wide field-of-view optical
imaging technique specifically developed for
cerebral blood flow (CBF) monitoring, it
measure the perfusion through analyzing the
statistics of Laser speckle pattern.
It can provide perfusion information of whole
vascular geometry with one single image, for
this reason it can provide high temporal
resolution up to 5ms.
It does not require contrast agent, and can
provide spatial resolution up to 10 μm.
One of its limitation is the inability to provide
absolute velocity information.
In this project, Since we are interested in the
temporal and spectral details of cerebral
blood flow, we decided to go with LSCI
because of its advantages in terms of
temporal resolution.
When an object illuminated by a highly coherent light source, a speckle pattern
is produced. This speckle pattern is produced through the mutual interference of
sets of wave fronts. If the scattering site goes fluidic motion with moving
scatterers such as Red blood cell, then a rapid changing speckle pattern will be
observed, due to the constant changes of the scattering site geometry.
As the scattering media flow rate increases, the scattering site geometry
changes more rapidly, and the amount of time that speckle pattern decorrelated
from its previous pattern becomes shorter.
Principles of Laser
Speckle Contrast
Imaging (LSCI)
Scale bar 100μm
Bright field image Speckle raw image
Speckle Contrast Map
48.2 48.3 48.4 48.5 48.6 48.7 48.8 48.9 49
-0.5
0
0.5
1
1.5
2
2.5
3
3.5
4
x 10
5
Seconds
ICT(CBF)forBlueandRed,BloodPressureinVoltage(x0.7e4)
Artery
Vein
BP
data4
44 46 48 50 52 54
1
2
3
x 10
5
0 50 100 150
0
1
2
3
4
x 10
5
Validating the Higher Sample Rate
Application of LSCI
𝑉𝑎𝑠𝑐𝑢𝑙𝑎𝑟 𝑆𝑡𝑖𝑓𝑓𝑛𝑒𝑠𝑠 𝐼𝑛𝑑𝑒𝑥 =
𝑎 𝑎𝑚𝑝
𝑏 𝑎𝑚𝑝
One way to quantify the blurriness of the image is by calculating the speckle
contrast. To calculate speckle contrast, a smaller analysis window of will be
used. In this case, 5x5 are used. Then Speckle Contrast is calculated as the
standard deviation over the mean intensity of this 25pixels and then registered
the contrast value in the center pixel. As we moving this analysis window all
over all speckle image a new speckle contrast map can be produced.
0 0.05 0.1 0.15 0.2 0.25
2
4
6
0
0.2
0.4
0.6
0.8
1
beat number
time (s)
Multiple Beats Velocity of Artery
rCBF(a.u.)
0 0.05 0.1 0.15 0.2 0.25
2
4
6
0
0.2
0.4
0.6
0.8
1
beat number
time (s)
Multiple Beats Velocity of Vein
rCBF(a.u.)
0 0.05 0.1 0.15 0.2 0.25
0
0.1
0.2
0.3
0.4
0.5
0.6
0.7
0.8
0.9
1
rCBF
t (s)
ensemble average Velocity of Artery
0 0.05 0.1 0.15 0.2 0.25
0
0.1
0.2
0.3
0.4
0.5
0.6
0.7
0.8
0.9
1
rCBF
t (s)
ensemble average velocity of Vein
Artery
Rise Time: 20 ms
Fall time 125 ms.
Vein
Rise Time: 33 ms
Fall time 119 ms.
0.05 0.1 0.15 0.2 0.25
0
0.1
0.2
0.3
0.4
0.5
0.6
0.7
0.8
0.9
1
rCBF
t (s)
ensemble average velocity artery vs vein, rise time difference=13 (ms), fall time difference=6 (ms)
Artery
vein
Sample liquid: skim milk
Velocity: 0 mm/s to 10mm/s.
Exposure time setting:
0.3ms => 2980 frames per second
75µs => 9072 frames per second
The Pulsatile Flow Difference Between Arteries and Veins
Research Questions Sample
Can LSCI record at higher sample rates?
Microchannel
Rat
Does LSCI blood flow estimate
associate/correlate with current
hemodynamic monitoring modalities?
Rat
Can LSCI be used to investigate pulsatile
flow?
Tadpole
What is the pulsatile flow difference
between arteries and veins?
Rat
How to quantify the pulsatile flow
difference between arteries and veins?
Rat
Investigation
of the
pulsatile flow
in the brain
Validation
of LSCI
flow
estimate
• Arteries veins separation
• Providing the physical properties of
capillary bed
• Investigating neurovascular
coupling
• Recording hemodynamic signal
after optogenetic stimulation
• Integrating with different
imaging modalities
Laser Speckle Contrast Imaging: A tool to study time-varying dynamics of blood flow
Rex Chen and Ramin Pashaie
Department of Electrical Engineering, University of Wisconsin-Milwaukee
National Science
Foundation (NSF)
David Harder Lab
Dr. David Harder
Dr. Kevin Rarick
Robert Ryan
Acknowledge
ment
Sponsors
University of
Wisconsin
Research Growth
Initiative (RGI)