Downloaded 454 times
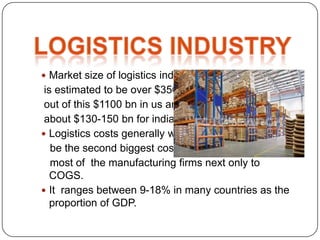
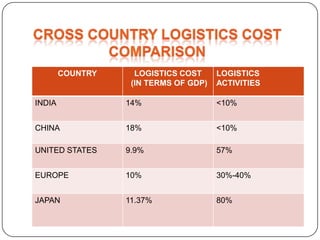
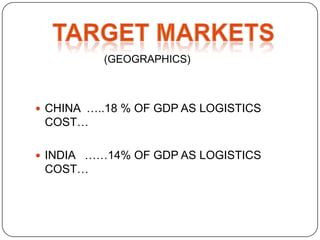

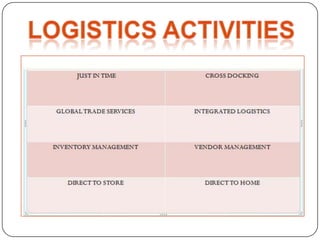
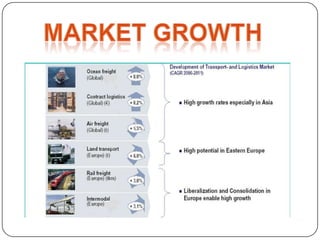
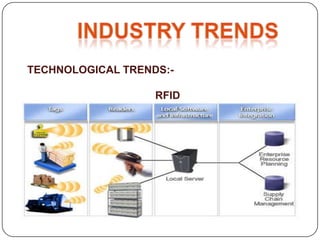
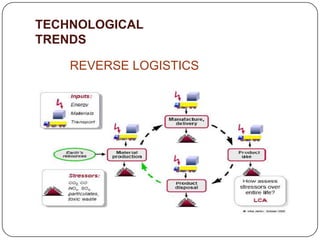


The document summarizes key information about the logistics industry globally and in India. It states that the global logistics industry size is over $3500 billion, with the US market being $1100 billion and India between $130-150 billion. It also notes that logistics costs typically represent 9-18% of GDP for most countries. Specifically, logistics costs are 14% of GDP for India and 18% of GDP for China. The top industries that rely on logistics are manufacturing, retail, and FMCG. Major players and new technological trends in the industry like RFID and reverse logistics are discussed. Challenges and opportunities for growth in the Indian market are also highlighted.


