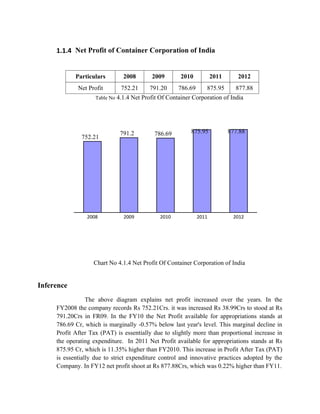
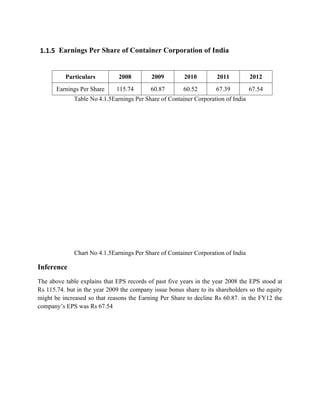
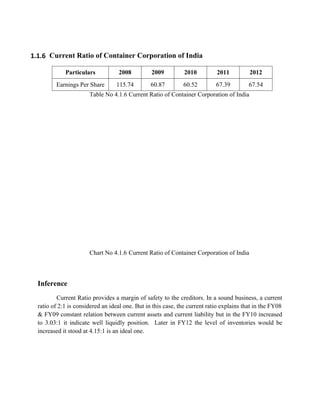
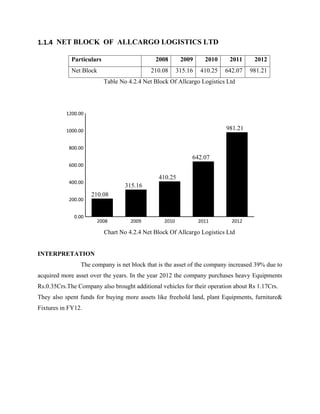
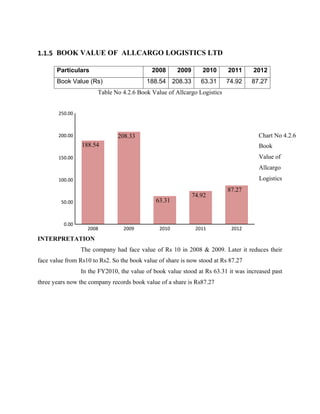
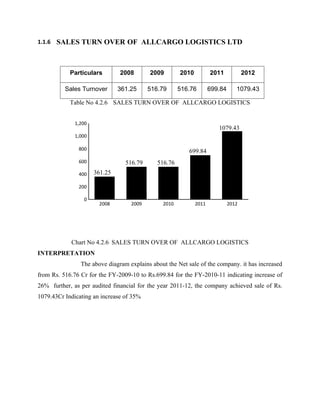
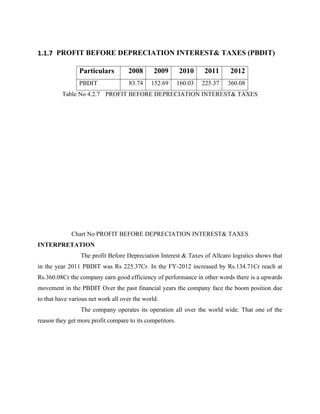
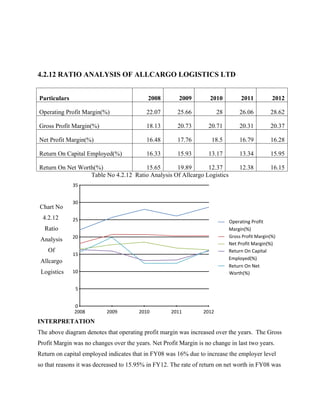
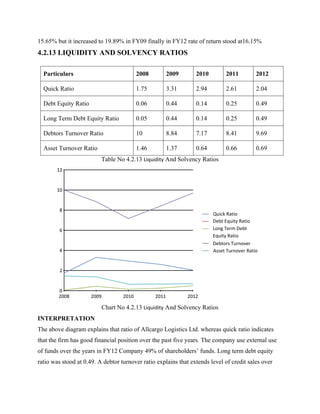
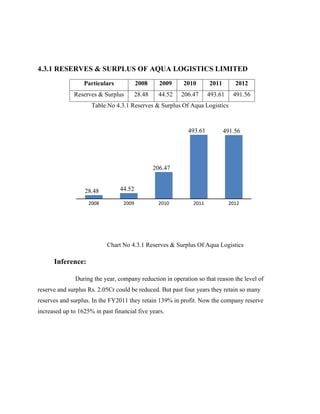
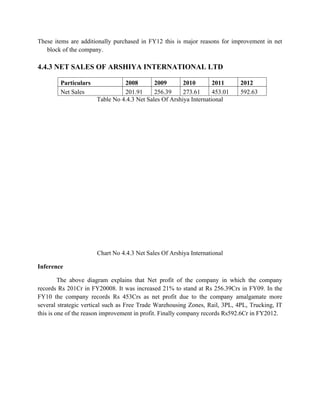
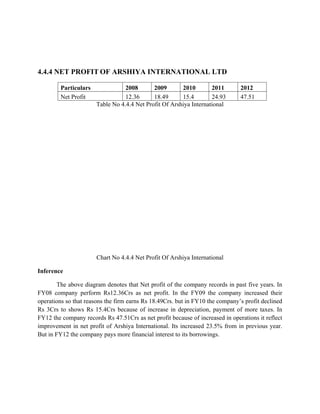
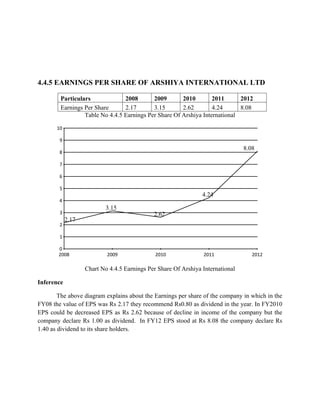
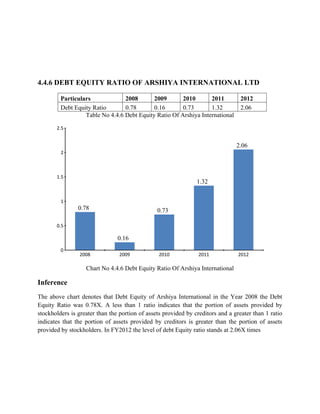
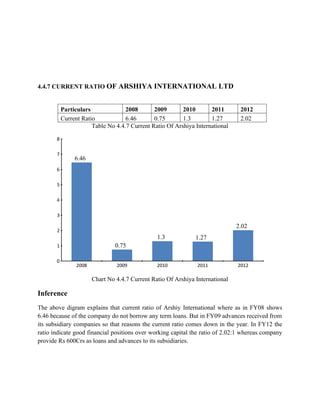
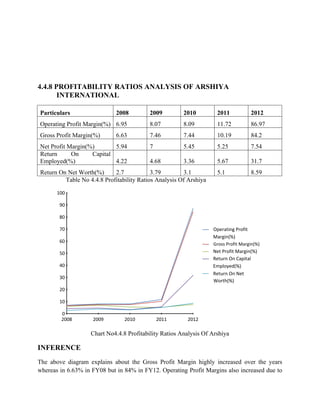
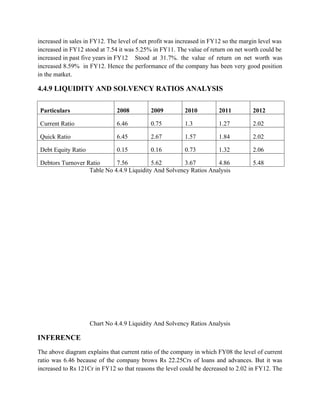
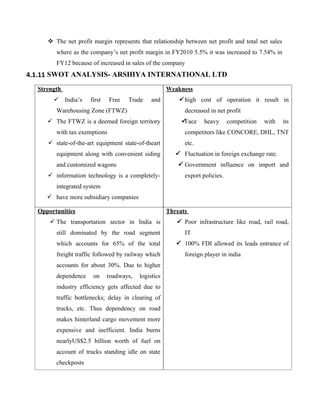
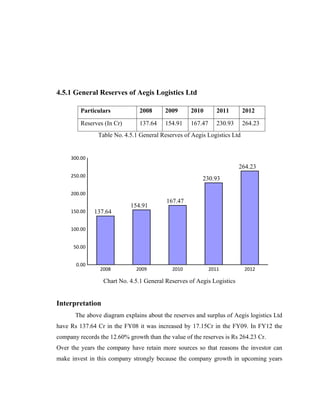
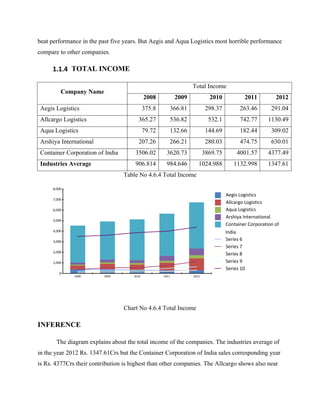
Abstract
Logistics services market India is on a growth trajectory owing to rapid globalization and
100% FDI allowance. Logistics services broadly encompass courier services, freight forwarding,
third party logistics and reverse logistics. Growth in international trade is providing huge
impetus to the demand for the logistics services. Growing competition in retail sector transcends
need of reverse logistics to handle returns and store up gradation. Third party logistics providers
need to customize their services and charge competitive rates to benefit from retail boom in India.
The report begins with an introduction section, classifying the logistics sector into
transportation, storage and logistics services, Government Initiatives and regulations, future
prospective of the industry. The next section briefly illustrates the evolution of the logistics
industry in India, literature review reports.
Market overview section provides a brief snapshot of the logistics services market in India. To
begin with, the share of logistics services in overall logistics market is shown, followed by the
market size and growth in logistics services market in India.
Company profile section briefly explains about the top five companies in logistics
industry in India namely Container Corporation of India, Arshiya international, Aegis logistics,
Aqua logistics, Allcargo logistics SWOT analysis of each company. SWOT analysis helps to
find out the weak points of the companies and to find out the way to overcome this problem.
The Competitive Landscape section profiles the major players in logistics services
market in India in details within the report which enables readers to get a clear picture of the
current competitive scenario. The section lists the basic details of the players such as corporate
information, business highlights and key members. The section also features financial analysis of
key vendors which in turn provides us with the financial health of players.
GE matrix used for analyzing the market attractiveness and business strategic Unit. In
which to give strategic decisions for attains the market position.
The report concludes with a strategic recommendations section that provides suggestions and
strategies for the existing and new players in the logistics services market in India.
ACKNOWLEDGEMENT
In a special way, I submit my whole hearted thanks to my parents for their
continuous motivation and the trust on me. It is my pleasure to reveal my thanks
to all my friends who offered me a great support for collecting the data from the
respondents.
I am extremely thankful and indebted to Dr. S.SARAVANASANKER,
VICE-CHANCELLOR, KALASALINGAM UNIVERSITY who has given me
the prestigious opportunity to do my project successfully.
I am extremely thankful and indebted to Dr. M.SATHIVEL RANI MBA,
PH.D. HEAD OF THE DEPARTMENT, BUSINESS ADMINISTRATION,
KALASALINGAM UNIVERSITY who has given me the prestigious
opportunity to do my project successfully.
I acknowledge with a sense of gratitude of sincere thanks to my Project
Guide Ms .M.SELVARANI, Assistant professor of the Department of Business
Administration, Kalasalingam University who provided a great Opportunity
for doing this project. Who enlightened me ‘What research is & how it can
be performed’, His active motivation provided me an invaluable guidance &
Encouragement towards Research that made me to perform this project.
I hearty thank Mr. SETHURAMAN “AKARA RESEARCH &
TECHNOLOGY CHENNAI” for showing tremendous patience and giving full
freedom in guiding me towards the successful completion of my project.
In a special way, I submit my grateful thanks to my parents who provided
me all the supports throughout the period of project development. I also render
my deep thanks to my friends and well wishers who had been a source of
encouragement throughout the period of training.
Last but not least my prayers and thanks to the “almighty” without whom the
work would not have materialized.
I also extend my thanks to all the other faculty members for extending
their helping hands to complete this project effectively. Finally, I would like to
profoundly thank all the respondents who helped me in collecting the necessary
information for completing this project.
Mr.T.AMULRAJ
CHAPTER-I
1. LOGISTICS INDUSTRY IN INDIA
1.1.1 INTRODUCTION
India has become the prime destination for logistics service providers all over the world.
The demand for logistics services in India has been largely driven by the remarkable growth of
the economy. The growth is being projected at 9-10 per cent in next few years, with the CAGR
(compounded annual growth rate) expected to grow at a rate of 7-8 per cent. This growth is
expected to gain greater momentum due to the exponential growth of the Indian economy. India
is also experiencing a big retail boom as the buying capacity of the middle and upper middle
segment of the population has scaled new heights. Many large multinationals from the retail
industry are planning to set up operation in India and large local retailers are also planning to
expand their operations. But with the infrastructure largely under-developed and incapable of
catering to a growing economy, logistics management in India becomes too complex. The poor
condition of infrastructure directly translates to higher turnover, pushing up the operating costs
and reducing efficiency. There are other problems such as complex regulatory compliance and
limited adoption and utilization of technology, which has resulted in increased paperwork and
inability to communicate effectively with customers.
In spite of dismal infrastructural scenario, the hopes of the logistics sector are kept up by the
various upcoming infrastructural projects like logistics parks and hubs and other initiatives by
public and private sector. The future of the logistics sector depends not only on the continued
development of infrastructure but also on the capability of the service providers in adapting
themselves and making optimal utilization of technology.
India is emerging as one of the world’s leading consumer market with the raise of middle income
group. Estimated at US$991 billion in 2020, Total consumption expenditure is expected to
grow to nearly US$ 3.6 trillion in 2020. Food, housing & consumer durable and transport &
communication are expected to be the top 3 categories, accounting for 65% of consumption in
2020. The FMCG sector alone is expected to grow at a base rate of 12 % annually to become an
INR 4000 billion industry by 2020. The logistics sector is expected to play an important role in
accessing this emerging market and enabling this growth.
1.1.2 INDUSTRY TRENDS
Transportation: Container cargo represents only about 30% (by value) of India's external trade-
much lower when compared with the global containerized cargo average of 70-75%. At a growth
rate of 12%, India's container cargo traffic is estimated to reach 15 million TEUs by FY16E from
about 7.5 million TEUs now (at 12 major ports). In comparison, China has created capacity at
its ports to handle more than 100 million TEUs a year. Out of the 15 mn TEUs of total container
traffic, we estimate Exim rail container traffic to be 5 mn TEUs by FY16E. This would be a huge
opportunity and will significantly benefit container rail operators.
Rising investment in the rail and port spaces also fuels growth in allied industries like wagon
manufacturing, port handling equipment, railway electrification systems and construction
companies.
To reduce the transportation cost and for quicker movement of cargo Multimodal transport
operation is introduced (MTO). MTO helps exporters with less documentation for instance single
document for all modes of transport.
Third Party Logistics (3PL): Outsourcing is everywhere. Logistics industry is no exception.
Logistics services like transportation, warehousing, cross docking, Inventory management,
packaging and freight forwarding all are part of third party logistic services. Companies in India
currently outsource an estimated of 52% of logistics. And 3PL industry is estimated to be US$
1.5bn in FY14. 3PL represents only 1% of logistics cost emphasis its significance in the industry.
Future is no doubt lying in outsourcing. As the growth in the 3PL market is expected to be in
the range of 25-30% CAGR over FY11-14E. As of now, the 3PL activity is limited to only few
industries like automotive, IT hardware, telecom and infrastructure equipment.
The organised 3PL market in India can be categorised into three major segments – public
sector, private sector and foreign entrants. Some of the major players in each category are: TVS
logistics, DIESL (TATA), Panalpina, TCI, Gati, Allcargo, V Trans, Total, VRL and Reliance etc.
Private Participation: The industry is becoming more competent with the entry of global
giants like Gazeley Broekmen (Wal-Mart's logistics partner), CH Robinson and Kerry logistics
and large Indian corporate houses like Tata, Reliance and Bharti group. A series of mergers
and acquisition like DHL acquired Blue Dart, TNT acquired Speedage Express Cargo Service
and Fedex bought over Pafex, are also leading to consolidation industry at various levels and
segments. Many of these companies are planning to broaden their areas of operation and are also
planning to develop their own logistic parks across the country. If the trend continues as per the
estimates, the market share of the organized logistics players is expected to double from 6% in
2013 to approx. 12% by 2020.
Express logistics: Organised players have monopoly over the express logistics industry. 65%
of express business is in the hands of organized players, while semi-organised and unorganised
players accounts for 25% and the remaining 10% of the market by EMS Speed Post. But
altogether different picture can be witnessed in the domestic segment. In domestic front,
unorganised players hold 41% of the market share based on price advantage. While organised
players accounts for 45% and EMS Speed Post the remaining 14%.
Warehouses: Recently, warehouses have become key growth drivers in the logistics industry.
Apart from conventional storing services, warehouses now providing value-added services like
consolidation and breaking up of cargo, packaging, labelling, bar coding and reverse logistics
etc. warehousing and related activities account for approx. 20% of the total logistics industry.
Most of the warehousing space in India lies with unorganised players in domestic front, which
is causing wide supply and demand gap in storage space. According to KPMG, an additional
120million square feet of warehousing space is needed by 2013 to bridge this gap.
Currently, the organised warehousing industry in India has a capacity of approx. 80million
metric tonnes and is growing at 35 to 40 per cent per annum. An investment of approximately
US$ 500million is being planned by various logistics companies for the development of about
45million square feet of warehouse space by 2013.Many players in this segment such as Multi
Modal Logistics Park, Mega Food Parks and Free Trade Warehousing Zones have planned next
generation storage models.
Logistic parks: About 110 logistics parks spread over approximately 3,500 acres at an estimated
cost of $1 bn are expected to be operational and an estimated 45 mn ft2 of warehousing space
with an investment of $ 500 mn is expected to be developed by various logistics companies by
2020.
Majority of these logistics parks are planned in close proximity to state capitals. However,
availability of large land parcels at relatively low cost, connectivity to multiple markets across
states and industrial clusters has led to the emergence of some tier-2 and tier-3 cities as favoured
destinations for the development of logistics parks and warehouses.
1.1.3 Government Initiatives and regulations
Initiatives:
To emphasis the significance of transportation in logistics industry and to increase the
competence in the sector government introduced private participation, especially in port sector.
The major initiative in transport infrastructure is introduction of National Maritime Development
Program (NMDP) with an investment of Rs 568bn. NMDP would be addressing the challenges
of the growing international traffic demand of the country along with developing the port
facilities at par with world standards. While liberalizing the railway services, government opened
the doors of container business to the private parties. A total of 15 players immediately entered
the market.
FDI regulations
• In general 100% FDI under the automatic route is permitted for all logistic services
• FDI up to 100% subject to FIPB approval is permitted for courier services.
• FDI up to 49% under the automatic route is permitted for air transport services, including
air cargo services.
• 100% FDI is permitted in Ports and Harbours under automatic route
• 100% FDI is permitted under the automatic route for storage and warehousing including
warehousing of agricultural products with cold storage.
• 100% FDI is permitted in transport and transport support services through automatic
route.
1.1.4 Indian Logistics Industry- Future Trends
There have been several key indicators to the future trend in the Indian logistics
sector. The demand for logistics services has been largely driven by the remarkable
growth of the Indian economy. Logistics spend in India is estimated to be around 13% of
the GDP, which is comparatively higher than other developed countries.
The air transport sector’s contribution has been around 0.2 per cent of the country’s
GDP, while the transport sector’s contribution to the GDP has been growing over the last
couple of years. India’s air cargo is predicted to grow at over CAGR of 11.5 per cent in
the next few years.
The contribution of the marine transport sector has also been around 0.2% to the
country’s GDP. The sector’s contribution to the GDP has been increasing mostly because
of the growing economic developments in the country. The role of the shipping industry
in the growth of Indian economy has been very significant. Major ports in India together
have handled around 500 million tonnes of cargo in the past two years and this figure is
growing significantly.
The Indian railways has realised the necessity to improve the infrastructure
provide better service. The plan to develop Logistics Parks or hubs has the potential to
streamline and optimize the supply chain and reduce the costs. Currently around 80% of
the goods in India move by road, the railways has to essentially devise plans to divert this
traffic to the rail.
India’s logistics sector attracted huge investments, leaving behind some of the
major sectors including aviation, metals, and consumer durables. The growths in the
retail and manufacturing industry, commodity markets and development of SEZs have
been key factors in the growth of Indian logistics industry. Recent studies have indicated
that the Indian logistics industry is expected to grow annually at the rate of 15 to 20%. A
number of infrastructural projects involving warehouse and logistics parks are being
undertaken are expected to be operational in the next 2-3 years.
The setting up special economic zones (SEZs) has led to increased logistics
activities around them. Several logistics parks have come up at locations like Mumbai,
Kolkata, Chennai and Hyderabad because of their excellent port, rail, and road
connectivity and are witnessing significant investment in infrastructure. Many of the
large logistics players are in the process of setting up warehouses, container freight
stations (CFS), inland container depots(ICD), logistics parks, distribution centers and
other facilities to leverage the abundant opportunities. Increase in foreign trade is
expected to further accelerate the demand for logistics services.
The future of the Industry is very bright and is sure to witness exponential growth
in the coming years. The increased participation of both public and private sector is
crucial for developing logistics and improving supply chain management. Not only do
the logistics companies need to create efficient business to thrive in the logistics sector,
but they also need to explore ways for investing energy, costs and time to grow a strong
logistics system
1.2 OBJECTIVES
• To analyze the company performance of selected logistics companies
• To find the strength, weakness, opportunities, threads of the selected logistics companies
and industry
• To compare the financial performance of selected companies to decide its position in the
industry
• To study the company strength and attractive of the industry by using GE matrix.
1.3 SCOPE OF THE REPORT
- The report covers the overview of Indian logistics industry, market size,
cost components, overview of air transport system in India,
- Air cargo traffic trends, growth drivers, demand- supply scenario,
technology and innovation, and future outlook of the global as well as Indian
air cargo industry.
- In addition, the report also includes profiles of four major players in the
sector.
- Detailed analysis of Component & Cost structure of Global Logistics and
Indian logistics market. This report talks about growth drivers and their
effected factors.
1.4 PROBLEM OF THE STUDY
1. The problems of getting data on the market share and market rate.
2. This study takes only the domestic players in India. It ignores foreign players like DHL,
UPS, TNT etc.
3. This study considers top five companies in India.
4. There is no clear definition of what constitutes a market.
5. A high market share need not necessarily lead to profitability all the time.
6. Low share businesses can be profitable too.
Chapter- II
2. Literature Survey
2.1.1 Logistics
Logistics is the management of the flow of resources between the point of origin and the point of
destination in order to meet some requirements, for example, of customers or corporations. The
resources managed in logistics can Include physical items, such as food, materials, equipment,
liquids, and staff, as well as abstract items, such as Information, particles, and energy. The
logistics of physical items usually involves the integration of information flow, material
handling, production, packaging, inventory, transportation, warehousing, and often security. The
complexity of logistics can be modeled, analyzed, visualized, and optimized by dedicated
simulation software. The minimization of the use of resources and time are common motives.
2.1.2 Origins and definition
The term logistics comes from the late 19th century: from French logistique, from
loger 'to lodge' Logistics is considered to have originated in the military's need to supply itself
with arms, ammunition, and rations as it moved from a base to a forward position. In the ancient
Greek, Roman, and Byzantine Empires, military officers with the title Logistikas were
responsible for financial and supply distribution matters.
The Oxford English Dictionary defines logistics as "the branch of military science
relating to procuring, maintaining and transporting material, personnel and facilities."
However, the New Oxford American Dictionary defines logistics as "the detailed
coordination of a complex operation involving many people, facilities, or supplies", and the
Oxford Dictionary online defines it as "the detailed organization and implementation of a
complex operation".
Another dictionary definition is "the time-related positioning of resources." As such,
logistics is commonly seen as a branch of engineering that creates "people systems" rather
than "machine systems".
According to the Council of Logistics Management, logistics includes the integrated
planning, control, realization, and monitoring of all internal and network-wide material, part, and
product flow, including the necessary information flow, in industrial and trading companies
along the complete value-added chain (and product life cycle) for the purpose of conforming to
customer requirements.
Logistics is the process of planning, implementing, and controlling the effective and
efficient flow of goods and services from the point of origin to the point of consumption.
Main logistics targets
Logistics is one of the main functions within a company. The main targets of logistics
can be divided into performance-related and cost-related targets. A few examples are high due
date reliability, short delivery times, low inventory level, and high utilization of capacity. When
decisions are made, there is a trade-off between targets.
Logistics viewpoints
Inbound logistics is one of the primary processes of logistics, concentrating on
purchasing and arranging the inbound movement of materials, parts, and/or finished inventory
from suppliers to manufacturing or assembly plants, warehouses, or retail stores. Outbound
logistics is the process related to the storage and movement of the final product and the related
information flows from the end of the production line to the end user.
Logistics fields
Given the services performed by logisticians, the main fields of logistics can be broken
down as follows:
• Procurement logistics
• Production logistics
• Distribution logistics
• After sales logistics
• Disposal logistics
• Reverse logistics
• Global logistics
• Domestics logistics
Procurement logistics consists of activities such as market research, requirements planning,
make-or-buy decisions, supplier management, ordering, and order controlling. The targets in
procurement logistics might be contradictory: maximizing efficiency by concentrating on core
competences, outsourcing while maintaining the autonomy of the company, or minimizing
procurement costs while maximizing security within the supply process.
Production logistics connects procurement to distribution logistics. Its main function is
to use available production capacities to produce the products needed in distribution logistics.
Production logistics activities are related to organizational concepts, layout planning, production
planning, and control.
Distribution logistics has, as main tasks, the delivery of the finished products to the
customer. It consists of order
processing, warehousing, and transportation. Distribution logistics is necessary because the time,
place, and quantity
of production differs with the time, place, and quantity of consumption.
Disposal logistics has as its main function to reduce logistics cost(s) and enhance service(s)
related to the disposal of waste produced during the operation of a business.
Reverse logistics denotes all those operations related to the reuse of products and materials.
The reverse logistics process includes the management and the sale of surpluses, as well as
products being returned to vendors from buyers.
Business logistics
One definition of business logistics speaks of "having the right item in the right quantity
at the right time at the right place for the right price in the right condition to the right customer".
As the science of process, business logistics incorporates all industry sectors. Logistics work
aims to manage the fruition of project life cycles, supply chains, and resultant efficiencies.
Logistics as a business concept evolved in the 1950s due to the increasing complexity of
supplying businesses with materials and shipping out products in an increasingly globalized
supply chain, leading to a call for experts called "supply chain logisticians". In business, logistics
may have either an internal focus (inbound logistics) or an external focus (outbound logistics),
covering the flow and storage of materials from point of origin to point of consumption (see
supply-chain management). The main functions of a qualified logistician include inventory
management, purchasing, transportation, warehousing, consultation, and the organizing and
planning of these activities. Logisticians combine a professional knowledge of each of these
functions to coordinate resources in an organization. There are two fundamentally different
forms of logistics: one optimizes a steady flow of material through a network of transport links
and storage nodes, while the other coordinates a sequence of resources to carry out some project.
Production logistics
The term production logistics describes logistic processes within an industry. Production
logistics aims to ensure that each machine and workstation receives the right product in the right
quantity and quality at the right time. The concern is not the transportation itself, but to
streamline and control the flow through value-adding processes and to eliminate non–value-
adding processes. Production logistics can operate in existing as well as new plants.
Manufacturing in an existing plant is a constantly changing process. Machines are
exchanged and new ones added, which gives the opportunity to improve the production logistics
system accordingly. Production logistics provides the means to achieve customer response and
capital efficiency. Production logistics becomes more important with decreasing batch sizes. In
many industries (e.g., mobile phones), the short-term goal is a batch size of one, allowing even a
single customer's demand to be fulfilled efficiently.
Track and tracing, which is an essential part of production logistics due to product safety
and reliability issues, is also gaining importance, especially in the automotive and medical
industries.
2.2 Review of literature
The Indian economy has been growing at an average rate of more than 8 per cent over the
last four years (Srinivas, 2006) putting enormous demands on its productive infrastructure.
Whether it is the physical infrastructure of road, ports, water, power etc. or the digital
infrastructure of broadband networks, telecommunication etc. or the service infrastructure of
logistics – all are being stretched to perform beyond their capabilities. Interestingly, this is
leading to an emergence of innovative practices to allow business and public service to operate
at a higher growth rate in an environment where the support systems are getting augmented
concurrently. In this paper, we present the status of the evolving logistics sector in India,
innovations therein through interesting business models and the challenges that it faces in years
to come.
Broadly speaking, the Indian logistics sector, as elsewhere, comprises the entire inbound
and outbound segments of the manufacturing and service supply chains. Of late, the logistics
infrastructure has received lot of attention both from business and industry as well as policy
makers. However, the role of managing this infrastructure (or the logistics management regimen)
to effectively compete has been slightly under-emphasized. Inadequate logistics infrastructure
has an effect of creating bottlenecks in the growth of an economy, the logistics management
regimen has the capability of overcoming the disadvantages of the infrastructure in the short run
while providing cutting edge competitiveness in the long term. It is here that exist several
challenges as well as opportunities for the Indian economy. There are several models that seem
to be emerging based on the critical needs of the Indian economy that can stand as viable models
for other global economies as well.
Chandra and Sastry (2004) have pointed towards two key areas that require attention in
managing the logistics chains across the Indian business sectors – cost and reliable value add
services. Logistics costs (i.e., inventory holding, transportation, warehousing, packaging, losses
and related administration costs) have been estimated at 13-14 per cent of Indian GDP which is
higher than the 8 per cent of USA’s and lower than the 21 per cent of China’s GDP (Sanyal,
2006a). Service reliability of the logistics industry in emerging markets, like India, has been
referred to as slow and requiring high engagement time of the customers, thereby, incurring high
indirect variable costs (Dobberstein et. al, 2005).
However, the Indian logistics story is one with islands of excellence though there has
been a general improvement on almost all parameters. It is this aspect that we explore further in
this paper. The paper is organized as follows: the next section gives a brief introduction of some
of the peculiarities of the Indian logistics sector.
Chapter III
3.Research Methodology
Research methodology is a way to systematically solve the research problem.
The research methodology using for find out the solution of the research problem
is analytical research methodology and some extend descriptive research
methodology.
Basis of selection of companies
The companies are selected on the basis of Earning per Share of top five
companies in logistics industry. This is listed in BSE, NSE Index in India.
List of selected companies for study
♦ Container Corporation of India
♦ Allcargo Logistics
♦ Aqua Logistics
♦ Aegis Logistics
♦ Arshiya International
Period of study
The period of the study is five years that is 2008 to 2012 because of
understand the growth of the industry to find out competitive position in market.
Nature of data
This study takes secondary data for the purpose of analysis of industry,
SWOT analysis, and competitive position.
Sources of data
ü Company website, RBI website, Moneycontrol.com, National stock
Exchange, Bombay Stock Exchange, CII, World Bank data.
Secondary data
ü Balance sheet of companies
ü Profit and loss accounts
ü Directors reports
ü News papers
ü NSE, BSE data
Tools and Techniques
These are the most popular tools of industry analysis. They focus on
earnings, growth and value of the companies in the market.
ü SWOT
ü BCG matrix
ü General Electrical Matrix
ü Financial ratio
ü Graphs and tables
4.1. Container Corporation of India Limited (CONCOR)
Container Corporation of India Limited (CONCOR) was set up in March of the year
1988 and commenced operation from November of the year 1989 taking over the existing
network of 7 Inland Container Depots (ICDs) from the Indian Railways to profitably satisfy the
customer's needs for high- quality, cost-effective logistics services. From its humble beginning,
it is now an undisputed market leader having the largest network of 57 ICDs/CFSs in India
offering scheduled and on demand rapid rail and road services between the hinderland and ports,
and between major metros.
In addition to providing inland transport by rail for containers, it has also expanded to
cover management of Ports, air cargo complexes and establishing cold-chain. It has and will
continue to play the role of promoting containerization of India by virtue of its modern rail
wagon fleet, customer friendly commercial practices and extensively used Information
Technology.
The company developed multimodal logistics support for India's International and
Domestic containerization and trade. CONCOR's core business is characterised by three distinct
activities, that of
• Carrier,
• Terminal operator
• Warehouse operator
CONCOR had been certified to ISO/IEC 27001: 2005 standard for establishing and
maintaining Information Security Management System (ISMS) for its IT functionality.
CONCOR had commissioned seven container transfer/handling facilities during the year 1990.
In addition to three ICDs at Ahmedabad, Pune & Hyderabad, two full-fledged Container Freight
Stations (CFSs) were commissioned at Moradabad and Panipat as cargo consolidation and
clearance centres with linkage to the OCD at New Delhi.
The Company had commissioned Port Side Container Terminal (PSCT) at Todiarpet in
March of the year 1991, situated in the vicinity of Chennai Harbor. A similar terminal was
commissioned at Wadi Bunder in close proximity of Mumbai Port in April of the year 1991. In
1992-93, the company achieved the first ever movement of refrigerated cargo containers by rail.
CONCOR had introduced this service to give a boost to export frozen and chilled
products. CONCOR commissioned Inland Containers Depots at Tughalakabad in Delhi and
Whitefield in Bangalore during the year 1993. In addition, the first phase of expansion and
upgradation of ICD a Tondiarpet in Chennai was commissioned and completed during the same
period. During the year 1994, the company made a small footstep as a Multi modal transport
operator and also as a consultancy organization for multi-modalism.
The Government of India disinvested 20% of its equity shares in the company. A new
CFS was commissioned in 1995 at New Mulund (Mumbai) and a new export warehouse of the
company also started at ICD, Sabarmati. In the same year CONCOR obtained approval from
World Bank to increase the quantity of wagons to be procured in the second Tranche from 750 to
1500. Scheduled reefer services between ICD Thughlakabad during the year 1996 and also in the
same period the Muboni Port was introduced.
The new ICDs were commissioned at Agra in November of the year 1996, linked with
ports directly by road ICD Tughlakabad by rail and another ICDs were commissioned at Nagpur
in January of the year1997, a rail linked with the twin ports of Mumbai and SNPT. In January of
the year 1997, the 'CONTRACK' services were launched by the company offering movement of
piecemeal domestic cargo in containers through specialized, scheduled and reliable container-rail
services.
Two new ICDs of the company were commissioned, one at Moradabad in February of
the year 1998 and the other at Malanpur/Gwalior in June of the year 1998. Second bonded
warehouse was commissioned at ICD/Whitefield. The Company had launched a daily service
between Chennai port and Whitefield ICD, Bangalore in the year 1999. During the year 2000,
CONCOR had fashioned a separate domestic division to give a major heighten to the company's
growing interest in domestic container movement.
The Company had introduced an express parcel service vans between Chennai and
Delhi. Private sector warehousing company, Continental Warehousing Corporation had entered
into a strategic alliance with CONCOR in the identical year 2000 for handling domestic cargo.
The Company had launched a fixed-day fixed-time weekly freight service between Shalimar
(Howrah)& Mumbai and Shalimar & Ahmedabad with transshipment at Nagpur during the year
2001.
CONCOR had introduced Asia's biggest ICD at Dadri in the year 2003. In the same year
the company made a tie up with Kolkata Port Trust to provide services to shippers to transport
containers using sea rail-mode between Nepal and Kolkata Dock Systems (KDS). During the
year 2004, CONCOR inked pact with Transworld to set up CFS at Dadri, forged alliance with
APL for box freight station at Dadri complex and also inked pact with APEDA for movement of
perishable goods.
A joint venture for Management and operations of Rail Container Terminal in Birgunj
(Nepal) was also finalized in form of M/s Himalayan Terminals and its was commissioned
during July of the year 2004. During the year 2004-05, the company had commissioned four
Rubber Tyred Gantry Cranes (RTG's), two at ICD/Dadri and other two at ICD/ Dandharikalan
(Ludhiana). Gateway Terminal India (Pvt) Ltd, a joint venture company of Maersk and the
company formed an arm for the construction of 3rd container terminal at JN Port, it was
commenced construction work during the year 2005-06.
CONCOR & GDL had collectively signed agreement during the year 2005 for providing
train services to transport EXIM container traffic. The Company had inked a MoU with Baxi
Group in the year 2006. During October of the year 2007, CONCOR develop an inland container
depot (ICD) at Baddi in Himachal Pradesh to facilitate the exporters of the Baddi-Barotiwala-
Nalagarh region. It will help industrialists of the region in saving the freight charges.
The Company has diversified into back-end retail in January of the year 2008 and is in
close final negotiation with Bharti-Wal-Mart to procure and supply fruit to the retailer.
CONCOR will add eight new rail-linked inland container depots (ICDs) with an investment of
Rs 3.2 billion by the end of next fiscal. The Company will have 65 depots, up from 57 at present.
The new depots were announced at Railway Budget 2008. The Company is expanding
the presence of the company in all the segments of the transport value chain in the Exim as well
as Domestic segment. Possibilities are to be explored for strategic alliances, both for optimal
utilization of infrastructure as well as expansion into other segments of the value chain.
1.1.1 Reserve and Surplus Container Corporation of India
Particulars 2008 2009 2010 2011 2012
Reserves 3118.93 3632.23 4206.42 4847.83 5476.45
Table No 4.1.1Reserve and Surplus Container Corporation of India
Char No 4.1.1 Reserve and Surplus Container Corporation of India
Inference
The above diagram explains about the general reserves of Container Corporation of India
where as in the FY 2008 had Rs 3118.93Crs it was increased to Rs3632.23Crs in FY 2009. In the
FY11 the company has Rs 4847.83Crs it was increased from15.25% in previous year. Finally in
FY12 the company records 12.97% increased to Rs 5476.45Crs. Its shows that company have
good performance over the past five years. As an investor point of view, its performance is high
compare to other companies in this industry.
2008 2009 2010 2011 2012
0.00
1000.00
2000.00
3000.00
4000.00
5000.00
6000.00
3118.93
3632.23
4206.42
4847.83
5476.45
1.1.2 Net Block of Container Corporation of India
Particulars 2008 2009 2010 2011 2012
Net Block 1665.15 1925.59 2140.48 2306.98 2393.75
Table No 4.1.2 Net Block of Container Corporation of India
Chart No 4.1.2 Net Block of Container Corporation of India
Inference
The above diagram denotes that net block of the company in which the company’s net
block continually increased over the past five years. In the FY12 the value of net block increased
to 76% to Rs 2393.75cr from Rs 1665.15Cr in FY08. They increase their containers, software,
leased lands its covers vast area of operation allover the India.
2008 2009 2010 2011 2012
0.00
500.00
1000.00
1500.00
2000.00
2500.00
1665.15
1925.59
2140.48
2306.98 2393.75
1.1.3 Net Sales of Container Corporation of India
Particulars 2008 2009 2010 2011 2012
Net Sales 3347.30 3417.16 3705.68 3828.12 4060.95
Table No 4.1.3 Net Sales of Container Corporation of India
Chart No 4.1.3 Net Sales of Container Corporation of India
Inference
The above diagram explains about the net sales of the company it indicate the good
performance over the years. In the FY08 sales stood at Rs3347.30Crs it was increased to 2% in
FY09. In the FY11, net sales were Rs3828.12Crs it was increased from 3.30% in previous year
2010. The company improves its operation its shows increased in sales to Rs 4060.95Crs i.e 6%
increased.
2008 2009 2010 2011 2012
0.00
500.00
1000.00
1500.00
2000.00
2500.00
3000.00
3500.00
4000.00
4500.00
3347.3 3417.16
3705.68
3828.12
4060.95
1.1.4 Net Profit of Container Corporation of India
Particulars 2008 2009 2010 2011 2012
Net Profit 752.21 791.20 786.69 875.95 877.88
Table No 4.1.4 Net Profit Of Container Corporation of India
Chart No 4.1.4 Net Profit Of Container Corporation of India
Inference
The above diagram explains net profit increased over the years. In the
FY2008 the company records Rs 752.21Crs. it was increased Rs 38.99Crs to stood at Rs
791.20Crs in FR09. In the FY10 the Net Profit available for appropriations stands at
786.69 Cr, which is marginally -0.57% below last year's level. This marginal decline in
Profit After Tax (PAT) is essentially due to slightly more than proportional increase in
the operating expenditure. In 2011 Net Profit available for appropriations stands at Rs
875.95 Cr, which is 11.35% higher than FY2010. This increase in Profit After Tax (PAT)
is essentially due to strict expenditure control and innovative practices adopted by the
Company. In FY12 net profit shoot at Rs 877.88Crs, which was 0.22% higher than FY11.
2008 2009 2010 2011 2012
752.21
791.2 786.69 875.95 877.88
1.1.5 Earnings Per Share of Container Corporation of India
Particulars 2008 2009 2010 2011 2012
Earnings Per Share 115.74 60.87 60.52 67.39 67.54
Table No 4.1.5Earnings Per Share of Container Corporation of India
Chart No 4.1.5Earnings Per Share of Container Corporation of India
Inference
The above table explains that EPS records of past five years in the year 2008 the EPS stood at
Rs 115.74. but in the year 2009 the company issue bonus share to its shareholders so the equity
might be increased so that reasons the Earning Per Share to decline Rs 60.87. in the FY12 the
company’s EPS was Rs 67.54
1.1.6 Current Ratio of Container Corporation of India
Particulars 2008 2009 2010 2011 2012
Earnings Per Share 115.74 60.87 60.52 67.39 67.54
Table No 4.1.6 Current Ratio of Container Corporation of India
Chart No 4.1.6 Current Ratio of Container Corporation of India
Inference
Current Ratio provides a margin of safety to the creditors. In a sound business, a current
ratio of 2:1 is considered an ideal one. But in this case, the current ratio explains that in the FY08
& FY09 constant relation between current assets and current liability but in the FY10 increased
to 3.03:1 it indicate well liquidly position. Later in FY12 the level of inventories would be
increased it stood at 4.15:1 is an ideal one.
4.1.7 Financial Highlights of Container Corporation of India
• In the FY09 the company issue 1:1 bonus share to its shareholders. 6,49,91,397 equity
shares issued as fully paid up Bonus Shares by Capitalizing General Reserves. The total
share capital stood at Rs.129.98Crs in 2009. Then it was remain same up to current
financial year.
• The company had strong resources and surplus because this is has more operation
compare to other companies it generate more revenue in past five years. The company
had Rs.3118.93Crs in 2008 it was increased to Rs.3632.23Crs in 2009. Finally in the
FY12 its was increased to 75% stood at Rs.5476.45Crs
• The net worth of the CONCOR could be increased past five years. Now it stands at Rs
5606.43Crs. it was increased 12.6% in previous year
• Net Block of the company continuously increased due to the company had more
leased land, purchase more plant and machinery now stood at Rs.2177Crs, they spent
Rs33.16Crs for buying containers now the value of the container stood at Rs124.55Crs
• The company’s investment could be increased over the years because in the FY12 the
company invest about Rs.50Crs IRFC Secured, Tax Free, Redeemable, Non-convertible,
Non-Cumulative Railway Bonds in the nature of promissory notes-79th Series of
1,00,000/- each now the total investment amount stood at Rs 293Crs in FY12
• The company follows just in time inventory. Stores and spare parts are valued at cost on
weighted average basis so the value of the inventory now stands at Rs 8Crs in FY12
• The sundry debtors were slightly increased over the years. In FY08 it was Rs 13.73Crs
which increased to Rs 19.59Crs in FY12
• CONCORE Bank Deposits with maturity upto 12 months Rs 2540.82Crs in FY12 so that
reasons the company’s current ratio was increased
• The sales of the company was increased over the years due to company covers vast area
for its operations in FY12 the company records Rs 4060Cr it was higher in these industry
• The company earns more other income by way of getting more interest and dividend
for its investments. In FY12 the company get Rs 316Cr as additional income which was
higher than Rs 143Crs in previous year.
• Hence the total income of the company could be increased in FY12 to stood at Rs
4377.49Crs
• Operating profit of FY2008 was Rs890.73Crs it was increased to Rs 1002.69Cr in FY’11.
In FY12 the operating profit stood at Rs 1023.73Cr
• The company records Rs 1181.78Crs of Profit Before Tax (PBT) which was 13% higher
than FY08.
• The book value of share now stood at Rs 431.32 the original face value is Rs 10.
• The company recommended 165% of dividend in FY12. In the FY08 provide 260% of
dividend due to increase in equity share capital.
4.1.8 SWOT ANALYSIS OF CONTAINER CORPORATION OF INDIA
(CONCOR)
Strength
v Market leader in logistics sector in India
v 20 years of presence in rail movement of
containers/terminal management/operation
of ICDs
v Government undertaking company
v High level of resources and surplus
v They currently hold 10988 wagons
v The Company has constituted a Core
Risk management Committee (RMC)
for managing the integrated risks of the
company
v The company has Strong financials and
highly committed team of experienced and
skilled manpower with in-depth knowledge
of multi modal logistics business.
Weakness
v This focus only railways, containers
operations
v Follow old information technology,
equipments
v It handle bulk quantities only
v The company utilize its equity funds
Opportunities
v Customer delights by way of
efficient response and integrated
multi modal services.
v Increase in revenue by
diversification and product
differentiation.
v Management of costs by
technological innovation
Threats
v High cost of operations
v Government polices over import and
export in India
v Lack of infrastructure
v 100% FDI in India
Table No 4.1.8 SWOT analysis of CONCORE
4.2 Allcargo Logistics
Allcargo Global Logistics Ltd is also known as Allcargo Logistics Ltd the leading LCL
(Less than Container Load) consolidator in India offering direct outbound and inbound LCL
groupage services to and from major cargo destinations worldwide. Their present operations are
in seven key areas of the logistics business. They are Multi-modal Transport Operations,
Container Freight Stations, Project and ODC Cargo Handling, Airfreight, Transport Logistics,
Equipment Hiring and Oil Rig & Supply Vessels Management.
The company was incorporated on August 18, 1993 as a private limited company in the
name Allcargo Movers (India) Pvt Ltd. The company commenced their operations as a shipping
agency and also provided freight forwarding services. In the year 1995, they formed association
with Ecu Line NV, Belgium to serve as their agents in Mumbai and New Delhi. From June 1998,
they became a Multimodal Transport Operator by obtaining the licence from the Ministry of
Shipping, Government of India.
v In the year 2001, the company made strategic investments in Ecu Line Mauritius and Ecu
Line Middle East (Dubai). They acquired 50% stake in ACM Lines (Pty) Ltd in the year
2002. In the year 2003, they entered into a JV with Transworld Logistics & Shipping
Services Inc.
v In the year 2003, they commissioned Container Freight Stations at Koproli in Maharashtra.
In the next year, they commissioned the second phasse and in the year 2005, they
commissioned the third phase.
v On December 8, 2005 the company name was changed into Allcargo Global Logistics Pvt
Ltd. They company became a public limited company in the year 2006.
v In January 2007, the company acquired Hindustan Cargo Ltd from Thomas Cook India Ltd
and thus they became the subsidiary of the company.
v On April 24, 2007 the company commenced their commercial operations in the Container
Freight Stations at Chennai in Tamil Nadu and Mudra in Gujarat.
v The company acquired the Project and Equipment Division of Transindia Freight Services
Pvt Ltd on May 2008.
4.2.1 ALLCARGO LOGISTICS LTD- FINANCIAL PERFORMANCE
1.1.2 NET WORTH OF ALLCARGO LOGISTICS LTD
Particulars 2008 2009 2010 2011 2012
Net worth 385.51 496.87 791.79 979.01 1140.14
Table No. 4.2.2 net worth of Allcargo Logistics
Chart No. 4.2.2 net worth of Allcargo Logistics
INTERPRETATION
The net worth of Allcargo Logistics has continuously increased compare to past
financial years. It retains abundance of reserves and surplus. 14% to be increased its value over
the previous year. In FY2008 the company had Rs 385.51Cr. But in FY10 the company spilt
share capital so the value stood at Rs 791.79crs. The company records good sales records over
the years this one of the reasons increased in General reserve so the net worth was increased in
FY12
Dec '07 Dec '08 Dec '09 Dec '10 Mar '12
0.00
200.00
400.00
600.00
800.00
1000.00
1200.00
1400.00
385.51
496.87
791.79
979.01
1140.14
1.1.3 GENERAL RESERVE OF ALLCARGO LOGISTICS LTD
Particulars 2008 2009 2010 2011 2012
Reserves 361.65 443.53 765.18 951.68 1113.16
Table No 4.2.3 General reserve of Allcargo Logistics
Chart No 4.2.3 General reserve of Allcargo Logistics
INTERPRETATION
The diagram explain about the level of reserve is increased Up to 14% the
company has spent more money for acquisition of firms it shows that increase in value of share
in future. Even the company has the high level of reserve and surplus in expect more return in
the future. The company records high level of sales compare to past years this is one of the
reasons increase in General Reserves.
2008 2009 2010 2011 2012
0.00
200.00
400.00
600.00
800.00
1000.00
1200.00
1400.00
Reserves
Series 2
1.1.4 NET BLOCK OF ALLCARGO LOGISTICS LTD
Particulars 2008 2009 2010 2011 2012
Net Block 210.08 315.16 410.25 642.07 981.21
Table No 4.2.4 Net Block Of Allcargo Logistics Ltd
Chart No 4.2.4 Net Block Of Allcargo Logistics Ltd
INTERPRETATION
The company is net block that is the asset of the company increased 39% due to
acquired more asset over the years. In the year 2012 the company purchases heavy Equipments
Rs.0.35Crs.The Company also brought additional vehicles for their operation about Rs 1.17Crs.
They also spent funds for buying more assets like freehold land, plant Equipments, furniture&
Fixtures in FY12.
2008 2009 2010 2011 2012
0.00
200.00
400.00
600.00
800.00
1000.00
1200.00
210.08
315.16
410.25
642.07
981.21
1.1.5 BOOK VALUE OF ALLCARGO LOGISTICS LTD
Particulars 2008 2009 2010 2011 2012
Book Value (Rs) 188.54 208.33 63.31 74.92 87.27
Table No 4.2.6 Book Value of Allcargo Logistics
Chart No 4.2.6
Book
Value of
Allcargo
Logistics
INTERPRETATION
The company had face value of Rs 10 in 2008 & 2009. Later it reduces their
face value from Rs10 to Rs2. So the book value of share is now stood at Rs 87.27
In the FY2010, the value of book value stood at Rs 63.31 it was increased past
three years now the company records book value of a share is Rs87.27
2008 2009 2010 2011 2012
0.00
50.00
100.00
150.00
200.00
250.00
188.54
208.33
63.31
74.92
87.27
1.1.6 SALES TURN OVER OF ALLCARGO LOGISTICS LTD
Particulars 2008 2009 2010 2011 2012
Sales Turnover 361.25 516.79 516.76 699.84 1079.43
Table No 4.2.6 SALES TURN OVER OF ALLCARGO LOGISTICS
Chart No 4.2.6 SALES TURN OVER OF ALLCARGO LOGISTICS
INTERPRETATION
The above diagram explains about the Net sale of the company. it has increased
from Rs. 516.76 Cr for the FY-2009-10 to Rs.699.84 for the FY-2010-11 indicating increase of
26% further, as per audited financial for the year 2011-12, the company achieved sale of Rs.
1079.43Cr Indicating an increase of 35%
2008 2009 2010 2011 2012
0
200
400
600
800
1,000
1,200
361.25
516.79 516.76
699.84
1079.43
1.1.7 PROFIT BEFORE DEPRECIATION INTEREST& TAXES (PBDIT)
Particulars 2008 2009 2010 2011 2012
PBDIT 83.74 152.69 160.03 225.37 360.08
Table No 4.2.7 PROFIT BEFORE DEPRECIATION INTEREST& TAXES
Chart No PROFIT BEFORE DEPRECIATION INTEREST& TAXES
INTERPRETATION
The profit Before Depreciation Interest & Taxes of Allcaro logistics shows that
in the year 2011 PBDIT was Rs 225.37Cr. In the FY-2012 increased by Rs.134.71Cr reach at
Rs.360.08Cr the company earn good efficiency of performance in other words there is a upwards
movement in the PBDIT Over the past financial years the company face the boom position due
to that have various net work all over the world.
The company operates its operation all over the world wide. That one of the
reason they get more profit compare to its competitors.
1.1.8 NET PROFIT OF ALLCARGO LOGISTICS LTD
Particulars 2008 2009 2010 2011 2012
Reported Net Profit 59.78 92.67 97.81 121.13 184.07
Table No. 4.2.8 NET PROFIT OF ALLCARGO LOGISTICS
Chart No 4.2.8 NET PROFIT OF ALLCARGO LOGISTICS
INTERPRETATION
The net profit of the company had a very good performance over past five
years. The company achieved Rs.184.07Cr Net Profit in FY-12 it was increased from 34% in
previous years. in the year 2008 the company records Rs 59.78Cr but in next year the company
records Rs 93.67Cr.
59.78
92.67 97.81
121.13
184.07
2008
2009
2010
2011
2012
1.1.9 EARNINGS PER SHARE (RS) OF ALLCARGO LOGISTICS LTD
Particulars 2008 2009 2010 2011 2012
Earning Per Share
(Rs) 29.51 41.44 7.84 9.28 14.1
Table No 4.2.9 EARNINGS PER SHARE (RS) OF ALLCARGO LOGISTICS
Chart No EARNINGS PER SHARE (RS) OF ALLCARGO LOGISTICS
INTERPRETATION
The above diagram explain about the EPS of Allcargo Logistics Ltd .The
company had face value of Rs 10 in 2008 & 2009. Later it reduces their face value from Rs10 to
Rs2. So that reason in FY12 stood at Rs14.1
2008 2009 2010 2011 2012
29.51
41.44
7.84 9.28
14.1
Earning Per Share (Rs)
1.1.10 DEBT – EQUITY RATIO OF ALLCARGO LOGISTICS LTD
Particulars 2008 2009 2010 2011 2012
Debt Equity Ratio 0.06 0.44 0.14 0.25 0.49
Table No 4.2.10 Debt – Equity Ratio Of Allcargo Logistics
Chart No 4.2.10 Debt – Equity Ratio Of Allcargo Logistics
INTERPRETATION
The above chart explains that the debt- equity ratio of the Allcargo Logistics Ltd in the FY2008
they have only 0.06. It was increased to 0.44 in the year 2009 due to company brows more
funds from external sources. But in FY2010 it was reduced because the company refunds their
borrowing later it was increased to 0.49 in the FY12 due to increase their operation towards
worldwide.
2008 2009 2010 2011 2012
0
0.1
0.2
0.3
0.4
0.5
0.6
0.06
0.44
0.14
0.25
0.49
1.1.11 Current Ratio Allcargo Logistics Ltd
Particulars 2008 2009 2010 2011 2012
Current Ratio 1.55 3.33 2.98 2.65 2.08
Table No 4.2.11 Current Ratio Allcargo Logistics
INTERPRETATION
The current ratio’s normal range between .05 to 2.0 is acceptable but the above diagram denotes
that continuously decrease over four years but ratio cloud be remain same position that is safe
liquidity. The company spent more resource for expands its operation over the upcoming years.
2008 2009 2010 2011 2012
0
0.5
1
1.5
2
2.5
3
3.5
4
1.55
3.33
2.98
2.65
2.08
Current Ratio
4.2.12 RATIO ANALYSIS OF ALLCARGO LOGISTICS LTD
Particulars 2008 2009 2010 2011 2012
Operating Profit Margin(%) 22.07 25.66 28 26.06 28.62
Gross Profit Margin(%) 18.13 20.73 20.71 20.31 20.37
Net Profit Margin(%) 16.48 17.76 18.5 16.79 16.28
Return On Capital Employed(%) 16.33 15.93 13.17 13.34 15.95
Return On Net Worth(%) 15.65 19.89 12.37 12.38 16.15
Table No 4.2.12 Ratio Analysis Of Allcargo Logistics
Chart No
4.2.12
Ratio
Analysis
Of
Allcargo
Logistics
INTERPRETATION
The above diagram denotes that operating profit margin was increased over the years. The Gross
Profit Margin was no changes over the years. Net Profit Margin is no change in last two years.
Return on capital employed indicates that in FY08 was 16% due to increase the employer level
so that reasons it was decreased to 15.95% in FY12. The rate of return on net worth in FY08 was
2008 2009 2010 2011 2012
0
5
10
15
20
25
30
35
Operating Profit
Margin(%)
Gross Profit Margin(%)
Net Profit Margin(%)
Return On Capital
Employed(%)
Return On Net
Worth(%)
15.65% but it increased to 19.89% in FY09 finally in FY12 rate of return stood at16.15%
4.2.13 LIQUIDITY AND SOLVENCY RATIOS
Particulars 2008 2009 2010 2011 2012
Quick Ratio 1.75 3.31 2.94 2.61 2.04
Debt Equity Ratio 0.06 0.44 0.14 0.25 0.49
Long Term Debt Equity Ratio 0.05 0.44 0.14 0.25 0.49
Debtors Turnover Ratio 10 8.84 7.17 8.41 9.69
Asset Turnover Ratio 1.46 1.37 0.64 0.66 0.69
Table No 4.2.13 Liquidity And Solvency Ratios
Chart No 4.2.13 Liquidity And Solvency Ratios
INTERPRETATION
The above diagram explains that ratio of Allcargo Logistics Ltd. whereas quick ratio indicates
that the firm has good financial position over the past five years. The company use external use
of funds over the years in FY12 Company 49% of shareholders’ funds. Long term debt equity
ratio was stood at 0.49. A debtor turnover ratio explains that extends level of credit sales over
2008 2009 2010 2011 2012
0
2
4
6
8
10
12
Quick Ratio
Debt Equity Ratio
Long Term Debt
Equity Ratio
Debtors Turnover
Asset Turnover Ratio
the years here the company in FY12 was 9.69times. Asset turnover ratio indicates that company
utilizes the assets use effectively over the years.
4.2.14 SWOT Analysis of Allcargo Logistics Ltd
Strength
• MTO business showed growth of 13%
• 2nd rank in the industry in India.
• Scale of operation across 62 countries
and over 4000 ports.
• LCL consolidation market with a
strong network across 62 countries and
142 own offices covering over 4,000
port pairs with nearly 200 agents and
franchisees
• Robust distribution network
• Superior performance and innovative
ideas
Weakness
• Strong dependency on weak infrastructure
• Taxes policies in India
• lack of adoption of new technology compare
to foreign companies
Opportunities
• Diversify new product portfolio to enter in
to new service provided
• Company utilizes their fund for further
expansion.
• To start 3PL it will give more strong to the
company
• CFS/ICDs that run their own container
terminal, freight forwarder or shipping line
are likely to gain from the surge in ocean
freight
Threats
• Competitor like DHL, TNT,UPS, Blue Dart
• Government rules and regulations
• India have poor infrastructure facilities like
road, port, information technology
• Restriction on import and export procedure.
Table No 4.2.14 SWOT Analysis Of Allcargo Logistics Ltd
4.3 AQUA LOGISTICS LIMITED
Aqua Logistics Limited is India's foremost global logistics and supply chain partner,
delivering excellence across industries, through an integration of empowered people, processes
and technology. The Company is a full-scope 3 PL (third-party logistics service provider),
delivering end-to-end solutions in the logistics and supply chain domain to customers.
The company capabilities include supply chain consulting, logistics execution and project
logistics. The company operations and consulting teams, deliver logistics solutions, to client's by
aligning the strategic and the operational perspectives.
The company is global supply chain management involves planning, implementing and
controlling a series of complex tasks performed by persons of different nationalities and cultures
and with varying language capabilities. The company integrates these multinational capabilities
by combining years of expertise with the latest in technology.
The company's operations in consulting, and client development teams deliver logistics,
operations strategy, sourcing and procurement planning, fulfillment operations, customer service
and after sales support.
The company was established in 1999 and headquartered in Mumbai and has presence in
major locations such as New Delhi, Chennai, Bangalore, Ludhiana, Baroda, Cochin and Pune. In
1999, the company started as freight forwarding and consistently increased capabilities and
scope of services. As an external service provider ambit of services covers critical services
which are required to execute end-to- end logistic needs.
These include Multimodal Transportation, Contract Logistics, Regulatory Compliance,
Warehousing, Value Added Services and Project Logistics. The company international logistics
operations are supported by a network of 3PL partners and vendors that enables us to service
client requirements across India and abroad as well. The company delivers international logistic
services by using air, sea and surface, as modes of transportation.
The company regulatory compliance services include customs and industry-specific
regulations. The company had a Multi-Modal Transport Operator's License, an IATA
Accreditation and a Custom House Agent's License for servicing customers' requirements
4.3.1 RESERVES & SURPLUS OF AQUA LOGISTICS LIMITED
Particulars 2008 2009 2010 2011 2012
Reserves & Surplus 28.48 44.52 206.47 493.61 491.56
Table No 4.3.1 Reserves & Surplus Of Aqua Logistics
Chart No 4.3.1 Reserves & Surplus Of Aqua Logistics
Inference:
During the year, company reduction in operation so that reason the level of
reserve and surplus Rs. 2.05Cr could be reduced. But past four years they retain so many
reserves and surplus. In the FY2011 they retain 139% in profit. Now the company reserve
increased up to 1625% in past financial five years.
2008 2009 2010 2011 2012
28.48 44.52
206.47
493.61 491.56
4.3.2 NET BLOCK/NET ASSETS OF AQUA LOGISTICS LIMITED
Particulars 2008 2009 2010 2011 2012
Net Block 9.13 12.75 43.09 44.36 44.93
Table No 4.3.2 Net Block/Net Assets Of Aqua Logistics
Chart No 4.3.2 Net Block/Net Assets Of Aqua Logistics
Inference
In the FY2010 the company brought Plant & machinery about Rs 31Cr. So the value of
asset could be increased over the years. Later the value of net block could be increased. In the
Year 2012 the value of assets shows that Rs44.93Cr. the followings are explains about the the
company brought asset over the FY2010
• Plant & Machinery-Rs 31.2Cr
• Computer & Software- Rs 0.08Cr
• Furniture & Fixtures-Rs 0.22Cr
• Vehicles-Rs 0.22Cr
Therefore, the company spent their resources for buying new vehicles currently the
company buy the worth of Rs4.46Cr
4.3.3 NET SALES OF AQUA LOGISTICS LIMITED
Particulars 2008 2009 2010 2011 2012
Net Sales 108.99 213.4 322.01 380.88 310.35
Table No 4.3.3 Net Sales Of Aqua Logistics
Chart No 4.3.3 Net Sales Of Aqua Logistics
Inference
The company records the continuous improvement in the year between FY2008 to
FY2011. But in the year 2012 the sales could be down up to 18.52% the level of sales stand at Rs
310.35Cr in FY12.eventhouh the sales growth for past five years is 184%
2008 2009 2010 2011 2012
108.99
213.4
322.01
380.88
310.35
Net Sales (Cr)
4.3.4 NET PROFIT OF AQUA LOGISTICS LIMITED
Particulars 2008 2009 2010 2011 2012
Net Profit 5.61 11.15 20.54 22.39 1.15
Table No 4.3.4 Net Profit Of Aqua Logistics
Chart No 4.3.4 Net Profit Of Aqua Logistics
Inference
The diagram explains about the net profit of the company could reduced due to payment of more
interest and taxes in FY12. In the FY10 the company recorded Rs 22.39Crs which was 1.85Crs
increased from previous years.
4.3.5 DEBT-EQUITY RATIO OF AQUA LOGISTICS LIMITED
Particulars 2008 2009 2010 2011 2012
Debt – Equity ratio 0.20 0.69 0.13 0.13 0.16
Table No 4.3.5 Debt-Equity Ratio of Aqua Logistics
Chart No 4.3.5 Debt-Equity Ratio of Aqua Logistics
Inference
The Debt- Equity ratio explains about the business concern is done by owner’s equity as
well as outside debts. In other words, the relationship between borrowed funds and owner’s
capital it used for measure the long – term solvency of a firm. Aqua logistics shows that in the
FY2009 could be increased from 0.20times to 0.69 times later it reduced to 0.13 times but in the
audited FY12 the company borrowings more short term loans so that reason the level could be
increased over the year. Now it stands at 0.16 times.
4.3.6 Profitability Ratios analysis of Aqua Logistics
Particulares 2008 2009 2010 2011 2012
Operating Profit Margin(%) 11.7 10.47 10.21 9.38 5.08
Gross Profit Margin(%) 11.19 9.93 9.75 8.36 3.83
Net Profit Margin(%) 5.14 5.22 6.37 5.85 0.36
Return On Capital Employed(%) 25.66 21.98 12.38 5.58 2.4
Return On Net Worth(%) 14.05 19.89 9.2 4.3 0.22
Table No 4.3.6 Profitability Ratios analysis of Aqua Logistics
Chart No 4.3.6 Profitability Ratios analysis of Aqua Logistics
INFERENCE
The diagram explains that Gross profit margin ratio explains that in FY08 records that 11.19%
due to decreased in sales now 3.83% in FY12. Net profit margin indicates that diminishing over
the years reasons was reduced in sales over the years.
2008 2009 2010 2011 2012
0
10
20
30
40
50
60
70
80
90
Operating Profit
Margin(%)
Gross Profit Margin(%)
Net Profit Margin(%)
Return On Capital
Employed(%)
Return On Net
Worth(%)
Financial Highlights
v Face Value of the Equity Share of the Company was splitted from 2010 to Rs.1.00 With
Respect of 4th October, 2010
v During the year, the Company allotted 4.1Cr Global Depository Receipt (GDR) (on pari-
passu basis) representing 9.46 Equity Shares of Re.1/- each with each GDR representing
23 Equity Shares at US$ 15.17 per GDR on February 10, 2011
v In order to conserve the profit of the business of the company, to meet the growing
funding requirements, it has not recommended any dividend for the last 5 years.
v The Value of the Net Assets of the company has increased in past 5 years it shows that it
brought many assets by way of utilizing the reserves & surplus of the company.
v It provide services, so it need not maintain any inventories
v The company spent more funds on its subsidiaries so the level of investment could be
increased in past few years
v The value of Debtors collection could be decreased. Up to 5.6% has been reduced.
v The performance of the current assets shows very good financial results up to 53%
increased its helps to investors can invest their fund in this company share for short term
period.
v Aqua Logistics company barrows fund from external sources in the previous year Rs
65.35Cr it’s increased to 329% stood at Rs 280.62Cr in FY12.
v Face Value of the Equity Share of the Company was splitted from 2010 to Rs.1.00 due
to that reason the book value of share was FY11 stood at Rs 17.45 in FY12 profit level
could be turn down so the book value per share is Rs.17.39
v During the year the company has registered income from operation of Rs. 331.93 Cr. as
compared to Rs. 381.73Cr in the previous year.
v Profit before Depreciation Interest and Tax (PBDIT) has decreased from Rs 17.36Cr. For
the year ended March 31, 2011 to Rs.36.61 Cr. showing the decrease of 52.6 %. During
FY2012, the company has recorded PBDIT of 5.55% of the income from operation as
against 9.58% during FY2011. The reduction in operation in operating margin is due to
decrease in income from operation.
vDuring the year, Profit after tax (PAT) has decreased from Rs.21.24Cr. for the
FY2011 to Rs.1.15Cr. in FY2012 due to decrease in income from operation.
v The company pays more funds for interest payment due to that reason the level of profit
could be decreased over the year. Interest has increased from Rs. 4.53Cr. for the FY2011
to Rs.11.78Cr. in FY2012
v The gross Profit Margin reflects the efficiency with which Management Produces
each unit of product. This ratio indicates the average spread between the cost of goods
sold and the sales revenues. A high gross profit margin shows that a sign of good
management and vice. Versa in Aqua Logistics company past five year gross profit
margin continuously inability to purchase raw material at favorable terms. It result in
decreased from 9.38% to 5.08% in FY2012.
v Net Profit Margin ratio establishes a relationship between net profit and sales and
indicates management’s efficiency in manufacturing, administration and selling the
products/service. While in this case the company performance shows that fluctuation in
past five years. In FY2008 5.14% but the company effort of the could be abridged now
the ratio shows that 0.36% the economic condition also one of the reasons for slope in net
profit margin ratio.
v There is no constant changes in the ROE it indicate that the relationship between the Net
Profit to Net worth of the company but the company shows up-down movement in past
performance like in FY2011 the ROE was 4.3% it reduced to 0.22% in FY2012.
v Current Ratio provides a margin of safety to the creditors. In a sound business, a current
ratio of 2:1 is considered an ideal one. But in this case, the current ratio explains that in
the FY08 & FY09 constant relation between current assets and current liability but in the
FY10 increased in sundry creditors for supplier upto Rs. 2.29 Cr. later in FY12 the level
of short term borrowings would be increased it stood at 3.26:1 is an ideal one.
v The working capital cycle level could be increased continuously over the past five years.
In FY12 the Number of Days in Working Capital was 1.5yrs.
4.3.7 SWOT ANALYSIS OF AQUA LOGISTICS LIMITED
Strength
Ø Good quality and reliability
Ø Robust distribution network
Ø Superior performance and innovative
idea to implement
Weakness
ØPoor infrastructure in India so
that reasons could not able to
earn profit effeictively
ØGovernment rules and
regulations
ØLack of financial position in
companies
Opportunities
ØReduction in warehousing space
requirement
ØImprovement in efficiency due to
better inventory management
Ø Reduction in transportation cost due to
higher capacity utilization
Threats
Ø Low margin business
Ø International competitors
ØAcquisitions of other business
unit
Table No 4.3.7 SWOT Analysis Of Aqua Logistics Limited
4.4 Arshiya International
Arshiya International Ltd is a fast emerging end-to-end service and solution provider in
logistics and supply chain management. The company is an amalgamation of several strategic
verticals such as Free Trade Warehousing Zones, Rail, 3PL, 4PL, Trucking, Warehousing & IT
enabling unparalleled operational expertise & solution capability across the entire supply chain
spectrum. Arshiya is rapidly expanding their business capabilities through continuous internal
development and aggressive acquisitions in complimentary space.
The headquarter is at Mumbai with offices spanning across India, Singapore, Australia,
Dubai, Qatar, Oman and USA. Arshiya International Ltd was incorporated in the year 1981 as
IID Forgings Ltd.
Ø In the year 2006, the company name was changed into Arshhiya Technologies
International Ltd and the name was further changed into Arshiya International Ltd with
effect from September 28, 2007.
Ø In April 2006, the company acquired 100% of the share in two companies namely
Cyberlog Technologies Pte Ltd, Singapore, a company engaged in the business of
development and marketing of software products and Park Investments Ltd, Hongkong, a
company engaged in the business of supply chain logistics.
Ø In January 2006, BDP (India) Pvt Ltd was amalgamated with the company. In october
2006, the company had a joint venture agreement with the BDP International Inc USA
and Genco I Inc USA for foray into retail distribution activities.
During the year 2007-08, the company incorporated Arshiya Logistics Infrastructure Ltd,
Arshiya Western Logistic Infrastructure Ltd, Arshiya Distripark Ltd and Flat World Processes
Ltd. Thus, they became the subsidiary of the company. The company is in the process of setting
up a Free Trade Warehousing Zone, a special category SEZ at Sai Village in Raigad,
Maharashtra with a project outlay of Rs 1200 crores.
The company has made substantial acquistion of land for the Free Trade Warehousing
Zone proposed at Uttar Pradesh and Nagpur at an estimated cost of Rs 1100 crore and Rs 900
crore respectively. The company incorporated a subsidiary namely Arshiya Rail Infrastructure
Ltd for containerised rail operations services to the customer for both domestic and exim cargo
movement across the the country.
The company estimated the project outlay of Rs 1600 crore for the acquisition of 75
Rakes, break vans, building of rail siding and other necessary infrastructure across the country.
4.4.1 GENERAL RESERVES OF ARSHIYA INTERNATIONAL LTD
Particulars 2008 2009 2010 2011 2012
Reserves 445.23 475.36 483.91 502.62 540.81
Table No 4.4.1 General Reserves of Arshiya International
Chart No 4.4.1 General Reserves of Arshiya International
Inference
The above diagram explains that General Reserve of Arshiya International where as the
company earn more profit in FY12 due to company earn more profit. They allocate Rs 540.81Cr
as general Reserves. It was increased from 7% in previous Year. The growth of the company is
moderately increased. So it indicates that definite growth in future because 100% FDI is allowed
in India. The company was an amalgamation of several strategic vertical such as Free Trade
Warehousing Zones, Rail, 3PL, 4PL, Trucking, IT in future.
2008 2009 2010 2011 2012
445.23
475.36 483.91
502.62
540.81
4.4. 2 NET BLOCK OF ARSHIYA INTERNATIONAL LTD
Particulars 2008 2009 2010 2011 2012
Net Block 3.41 9.65 17.59 330.86 602.35
Table no 4.4. 2 net block of arshiya international
Chart no 4.4. 2 net block of arshiya international
Inference
The above diagram explains about the Net block of the Arshiya International Ltd where
as in the FY2008 the company has Rs3.41Crs. but it was increased to Rs 9.65Crs they brows
some plant and machineries. In FY11 in company’s net block abnormal increased to
Rs330.86Crs company additionally purchase freehold lands, buildings, computers and other
equipments. In the financial year 2012 the company shows Rs 602.35Crs reasons, the
company purchase additional assets in the years details are,
1. Freehold land-Rs 120Cr
2. Buildings – Rs 134Cr
3. Plant and machinery- Rs 3Crs
4. Equipment –Rs 16Crs
2008 2009 2010 2011 2012
0
100
200
300
400
500
600
700
3.41 9.65 17.59
330.86
602.35
These items are additionally purchased in FY12 this is major reasons for improvement in net
block of the company.
4.4.3 NET SALES OF ARSHIYA INTERNATIONAL LTD
Particulars 2008 2009 2010 2011 2012
Net Sales 201.91 256.39 273.61 453.01 592.63
Table No 4.4.3 Net Sales Of Arshiya International
Chart No 4.4.3 Net Sales Of Arshiya International
Inference
The above diagram explains that Net profit of the company in which the company
records Rs 201Cr in FY20008. It was increased 21% to stand at Rs 256.39Crs in FY09. In the
FY10 the company records Rs 453Crs as net profit due to the company amalgamate more
several strategic vertical such as Free Trade Warehousing Zones, Rail, 3PL, 4PL, Trucking, IT
this is one of the reason improvement in profit. Finally company records Rs592.6Cr in FY2012.
4.4.4 NET PROFIT OF ARSHIYA INTERNATIONAL LTD
Particulars 2008 2009 2010 2011 2012
Net Profit 12.36 18.49 15.4 24.93 47.51
Table No 4.4.4 Net Profit Of Arshiya International
Chart No 4.4.4 Net Profit Of Arshiya International
Inference
The above diagram denotes that Net profit of the company records in past five years. In
FY08 company perform Rs12.36Crs as net profit. In the FY09 the company increased their
operations so that reasons the firm earns Rs 18.49Crs. but in FY10 the company’s profit declined
Rs 3Crs to shows Rs 15.4Crs because of increase in depreciation, payment of more taxes. In
FY12 the company records Rs 47.51Crs as net profit because of increased in operations it reflect
improvement in net profit of Arshiya International. Its increased 23.5% from in previous year.
But in FY12 the company pays more financial interest to its borrowings.
4.4.5 EARNINGS PER SHARE OF ARSHIYA INTERNATIONAL LTD
Particulars 2008 2009 2010 2011 2012
Earnings Per Share 2.17 3.15 2.62 4.24 8.08
Table No 4.4.5 Earnings Per Share Of Arshiya International
Chart No 4.4.5 Earnings Per Share Of Arshiya International
Inference
The above diagram explains about the Earnings per share of the company in which in the
FY08 the value of EPS was Rs 2.17 they recommend Rs0.80 as dividend in the year. In FY2010
EPS could be decreased EPS as Rs 2.62 because of decline in income of the company but the
company declare Rs 1.00 as dividend. In FY12 EPS stood at Rs 8.08 the company declare Rs
1.40 as dividend to its share holders.
2008 2009 2010 2011 2012
0
1
2
3
4
5
6
7
8
9
10
2.17
3.15
2.62
4.24
8.08
4.4.6 DEBT EQUITY RATIO OF ARSHIYA INTERNATIONAL LTD
Particulars 2008 2009 2010 2011 2012
Debt Equity Ratio 0.78 0.16 0.73 1.32 2.06
Table No 4.4.6 Debt Equity Ratio Of Arshiya International
Chart No 4.4.6 Debt Equity Ratio Of Arshiya International
Inference
The above chart denotes that Debt Equity of Arshiya International in the Year 2008 the Debt
Equity Ratio was 0.78X. A less than 1 ratio indicates that the portion of assets provided by
stockholders is greater than the portion of assets provided by creditors and a greater than 1 ratio
indicates that the portion of assets provided by creditors is greater than the portion of assets
provided by stockholders. In FY2012 the level of debt Equity ratio stands at 2.06X times
2008 2009 2010 2011 2012
0
0.5
1
1.5
2
2.5
0.78
0.16
0.73
1.32
2.06
4.4.7 CURRENT RATIO OF ARSHIYA INTERNATIONAL LTD
Particulars 2008 2009 2010 2011 2012
Current Ratio 6.46 0.75 1.3 1.27 2.02
Table No 4.4.7 Current Ratio Of Arshiya International
Chart No 4.4.7 Current Ratio Of Arshiya International
Inference
The above digram explains that current ratio of Arshiy International where as in FY08 shows
6.46 because of the company do not borrow any term loans. But in FY09 advances received from
its subsidiary companies so that reasons the current ratio comes down in the year. In FY12 the
ratio indicate good financial positions over working capital the ratio of 2.02:1 whereas company
provide Rs 600Crs as loans and advances to its subsidiaries.
2008 2009 2010 2011 2012
0
1
2
3
4
5
6
7
8
6.46
0.75
1.3 1.27
2.02
4.4.8 PROFITABILITY RATIOS ANALYSIS OF ARSHIYA
INTERNATIONAL
Particulars 2008 2009 2010 2011 2012
Operating Profit Margin(%) 6.95 8.07 8.09 11.72 86.97
Gross Profit Margin(%) 6.63 7.46 7.44 10.19 84.2
Net Profit Margin(%) 5.94 7 5.45 5.25 7.54
Return On Capital
Employed(%) 4.22 4.68 3.36 5.67 31.7
Return On Net Worth(%) 2.7 3.79 3.1 5.1 8.59
Table No 4.4.8 Profitability Ratios Analysis Of Arshiya
Chart No4.4.8 Profitability Ratios Analysis Of Arshiya
INFERENCE
The above diagram explains about the Gross Profit Margin highly increased over the years
whereas in 6.63% in FY08 but in 84% in FY12. Operating Profit Margins also increased due to
2008 2009 2010 2011 2012
0
10
20
30
40
50
60
70
80
90
100
Operating Profit
Margin(%)
Gross Profit Margin(%)
Net Profit Margin(%)
Return On Capital
Employed(%)
Return On Net
Worth(%)
increased in sales in FY12. The level of net profit was increased in FY12 so the margin level was
increased in FY12 stood at 7.54 it was 5.25% in FY11. The value of return on net worth could be
increased in past five years in FY12 Stood at 31.7%. the value of return on net worth was
increased 8.59% in FY12. Hence the performance of the company has been very good position
in the matket.
4.4.9 LIQUIDITY AND SOLVENCY RATIOS ANALYSIS
Particulars 2008 2009 2010 2011 2012
Current Ratio 6.46 0.75 1.3 1.27 2.02
Quick Ratio 6.45 2.67 1.57 1.84 2.02
Debt Equity Ratio 0.15 0.16 0.73 1.32 2.06
Debtors Turnover Ratio 7.56 5.62 3.67 4.86 5.48
Table No 4.4.9 Liquidity And Solvency Ratios Analysis
Chart No 4.4.9 Liquidity And Solvency Ratios Analysis
INFERENCE
The above diagram explains that current ratio of the company in which FY08 the level of current
ratio was 6.46 because of the company brows Rs 22.25Crs of loans and advances. But it was
increased to Rs 121Cr in FY12 so that reasons the level could be decreased to 2.02 in FY12. The
Quick ratio also decreased same reasons. Debtors turnover ratio denotes that 7.56times in FY08
but it was increased to 5.58times due to the level of sundry debtors level has been increased in
FY12.
4.4.10 FINANCIAL HIGHLIGHTS OF ARSHIYA INTERNATIONAL LTD
v In the FY2011 the company increases their capital by way of issued as bonus share to its
share holders.
v The reserve of the company shows that continuously increased over the past five years. In
the FY12 company retains their funds to 7.06% in the previous year Rs 502.62Crs. so its
value of the company could be increase in upcoming years hence an investor can invest
their money in this company strongly
v The net worth of the company also increased due to wide area of operation could be
carried over the world wide. Now the company has worth of Rs553Crs.
v During the year the company borrows short term funds from banks for the purpose
of increase their working capital position of the firm. In FY12 company borrows
Rs.1006Crs. against of FY11 Rs 655.65Crs
v In the FY2011 company brought freehold land, vehicles, plant and equipments with
worth of Rs 330Crs. It is increased to Rs602 Cr in the financial years. From this denotes
that the company have good value in market
v The company does not maintain any inventories over the last financial years
v The level of sundry debtors could be increased over the years in the FY12 records
Rs 121 Cr in the previous year Rs 95Crs
v The company also lends loan and advances for its subsidiaries for the purpose of expand
its operations
v The net current asset of the company increase over the past financial years currently the
company hold the worth of the Rs 400Cr
v The company records a best sales performance over the past financial years. in the
FY2008 the sales level was Rs201.Crs on the other hand the level of sales could be
increased up to 21% it reach at Rs. 256Crs in the FY2009. Even though the company
have good sales in the FY2012 it records Rs592Crs due to expand their business over the
years.
v The net income of the company also increased over the past financial years in the FY12
the current net income is stood at Rs630Crs
v In this accounting period the company borrows more funds from outsider it results in
payment of the more interest to creditors. In the financial years the company pay Rs
80Crs but in the previous year Rs 31Crs
v The above balance sheet explains about the tax could be paid by the company is high
compare to previous years. In the FY12 the company pay Rs. 21 Cr. as tax to Indian govt
v The Earning Per Share of the company increases over the financial years in year 2010
EPS was Rs2.64 but the next financial year 2011 the EPS could be increased to Rs 4.42
finally the value of EPS in the FY12 reach at Rs 8.08 because of the the company has
more retains their earnings
v In the year 2012 the company declares the 70% as dividend for the equity shareholders.
But in FY08 they declared 40% only the face value of Rs 2 per share.
v The book value of the share shows that continuous improvement over the years now the
company’s book value is Rs 93 the original value of share’s face value is Rs 2 only
v During the year under report / review, seven step down subsidiaries of the Company, viz.
Arshiya Southern Domestic Distripark Ltd., Arshiya Eastern Domestic Distripark Ltd.,
Arshiya Western Domestic Distripark Ltd., Arshiya Central Domestic Distripark Ltd.,
Arshiya Exim Trading Ltd., Arshiya Eastern FTWZ Ltd., Arshiya Western FTWZ Ltd.
have ceased to be step down subsidiaries of this Company.Further, another step-down
subsidiary of your Company, Cyberlog Technologies Inc., USA has been dissolved.
v The face value of the company share is Rs 2.00 there is no change in capital structure in
past five years
v The company declared Rs 0.80 in FY2008. It was increased in FY12. The company
recommended Rs1.40 in FY12
v Operating profit was continuously improved over the year. In FY12 the company had
87% contribute as operating profit.
v Gross profit margin level has been increased due to company operate wide area in India it
results in increase in gross profit level, in FY12 the company’s Gross profit margin stood
at 84.4%
v The net profit margin represents that relationship between net profit and total net sales
where as the company’s net profit margin in FY2010 5.5% it was increased to 7.54% in
FY12 because of increased in sales of the company
4.1.11 SWOT ANALYSIS- ARSHIYA INTERNATIONAL LTD
Strength
ü India’s first Free Trade and
Warehousing Zone (FTWZ)
ü The FTWZ is a deemed foreign territory
with tax exemptions
ü state-of-the-art equipment state-of-theart
equipment along with convenient siding
and customized wagons
ü information technology is a completely-
integrated system
ü have more subsidiary companies
Weakness
ühigh cost of operation it result in
decreased in net profit
üFace heavy competition with its
competitors like CONCORE, DHL, TNT
etc.
ü Fluctuation in foreign exchange rate.
ü Government influence on import and
export policies.
Opportunities
ü The transportation sector in India is
still dominated by the road segment
which accounts for 65% of the total
freight traffic followed by railway which
accounts for about 30%. Due to higher
dependence on roadways, logistics
industry efficiency gets affected due to
traffic bottlenecks; delay in clearing of
trucks, etc. Thus dependency on road
makes hinterland cargo movement more
expensive and inefficient. India burns
nearlyUS$2.5 billion worth of fuel on
account of trucks standing idle on state
checkposts
Threats
ü Poor infrastructure like road, rail road,
IT
ü 100% FDI allowed its leads entrance of
foreign player in india
Table No 4.4.10 SWOT Analysis- Arshiya International
4.5 Aegis Logistics Ltd
Aegis Logistics Ltd is a leader in Oil, Gas and Chemical Logistics. The company is
engaged in providing logistic solutions for Oil, Gas, Chemicals and Petrochemical Industries.
With their strategic locations and indispensable services, Aegis is a key supplier for total supply
chain management services to major customers including Oil PSUs. The company presently has
three operating port terminals, two in Mumbai and one in Kochi, as well as two state of the art
gas terminals at Mumbai & Pipavav through which they handle annually over 2 million MT of
Oil, Gas and Petroleum products as well as around 400,000 MT of LPG and Propane gas.
Aegis Logistics Ltd was incorporated on June 30, 1956 as a private limited company
with the name Atul Drug House Ltd. In the year 1962, the company installed their first plant for
the manufacture of formaldehyde and hexamine at Kandla. In the year 1967, they installed
another plant at Capi near Bulsar in Gujarat State for the manufacture of 14,400 tonnes of
formaldehyde and 540 tonnes of hexamine per annum.
In the year 1970, the company installed at Vapi a plant for the manufacture of
Pentaerythritol formaldehyde with a capacity of 1,200 tonnes per annum with the technical know-
how supplied by Joset Meissner of W.Germany. In September 14, 1976, the name of the
company was changed to Atul Chemical Industries Ltd. Also, they became a public limited
company. The name of the company was again changed from Atul Chemical Industries Ltd to
Aegis Logistics Ltd.
In the year 1999, the Petrochemicals Division was hived off to Perstorp Aegis Chemicals
Ltd, (PACL) a joint venture company between the company and Perstorp AB, Netherlands.
During the year 2007-08, as per the scheme of arrangement (SoA), Throughput Activity
Undertaking of Hindustan Aegis LPG Ltd was de-merged and transferred to the company with
effect from the appointed date, April 01, 2007.
During the year 2008-09, Tapi Finvest India Pvt Ltd was amalgamated with the
company. During the year 2009-10, the company entered into a strategic alliance with Essar Oil
Ltd which entails a reciprocal arrangement wherein both the companies would sell each other
fuels through their retail outlets. In April 1, 2010, the company acquired 100% shareholding in
Shell Gas (LPG) India Pvt Ltd. Consequently, SGLIPL became wholly owned subsidiary with
effect from April 1, 2010. Also, the name of SCLIPL was changed to Aegis Gas (LPG) Pvt Ltd
(AGPL).
During the year 2010-11, the company was awarded the Operations & Maintenance
(O&M) contract for the product storage and dispatch operations of Bharat Oman Refinery Ltd
(BORL) at Bina in Madhya Pradesh signifying the Aegis expertise of the company in Liquid
Logistic and Operations & Maintenance. Also, Aegis Gas (LPG) Pvt Ltd (AGPL), the wholly
owned subsidiary of the company acquired 100% equity shares of Hindustan Aegis LPG Ltd
(HAL PG), from its erstwhile shareholders. Consequently, HAL PG ceased to be an associate
and became a wholly owned subsidiary of AGPL.
In November 2010, the company entered into a major deal with APM Terminals Pipavav
to avail on sub-lease close to 100 acres of land for building a global oil and petrochemicals
storage complex. The company will invest up to Rs 400 crore ($90m) in building a 600,000 KL
oil terminal complex in Port Pipavav. With the announcement of this project, the company's
liquids capacity will rise from 300,000 KL to over 1 million KL.
The company's strategy of building a 'necklace' of port terminals around India's coastline
from Pipavav to Haldia to Kochi, inland oil terminals to service the national oil companies and
developing a retail distribution network for the LPG business is proceeding at a steady pace.
4.5.1 General Reserves of Aegis Logistics Ltd
Particulars 2008 2009 2010 2011 2012
Reserves (In Cr) 137.64 154.91 167.47 230.93 264.23
Table No. 4.5.1 General Reserves of Aegis Logistics Ltd
Chart No. 4.5.1 General Reserves of Aegis Logistics
Interpretation
The above diagram explains about the reserves and surplus of Aegis logistics Ltd
have Rs 137.64 Cr in the FY08 it was increased by 17.15Cr in the FY09. In FY12 the
company records the 12.60% growth than the value of the reserves is Rs 264.23 Cr.
Over the years the company have retain more sources so that reasons the investor can
make invest in this company strongly because the company growth in upcoming years
2008 2009 2010 2011 2012
0.00
50.00
100.00
150.00
200.00
250.00
300.00
137.64
154.91
167.47
230.93
264.23
should be increase due to the Indian government give more importance for exports &
imports.
The company also utilize the fund for further expansion their business over the
world wide from which they attain competitive position in the field.
4.5.2 Net worth of Aegis Logistics Ltd
Particulars 2008 2009 2010 2011 2012
Networth (In Crs) 157.55 174.70 186.24 264.33 297.63
Table No. 4.5.2 Net worth of Aegis Logistics
Chart No. 4.5.2 Net worth of Aegis Logistics
Interpretation
The above diagram explains about the net worth of Aegis Company in which the
company performs over the year shows good results.
Net worth includes share capital and reserve of the company. The company has
good net worth in over the years. In the year 2010 the value of net worth was Rs
186.24Cr high in FY2011 up to Rs. 264.33Cr with 42%
12.6% could be increased from in the year 2011 it stood at Rs 297.63Cr
It is clear that investors can invest their fund in this company so that way it will grow in
future.
4.5.3 Net sales of Aegis Logistics Ltd
Particulars 2008 2009 2010 2011 2012
Net Sales 373.88 368.33 284.67 258.14 283.5
Table No. 4.5.3 Net sales of Aegis Logistics
Chart No 4.5.3 Net sales of Aegis Logistics
Interpretation
2008 2009 2010 2011 2012
0
50
100
150
200
250
300
350
400
373.88 368.33
284.67
258.14
283.5
The above diagram explains about the net sales of the Aegis Company in
FY2008 it was records Rs. 373.88Crs. But in the FY2009 it comes down to Rs 368.33Crs.
In the financial year 2010 the net sale was again reduced 83%. Later the company
record good results in the FY12 is Rs 283.5 Cr in previous year was Rs 258.14cr
Meanwhile the company have face lot of challenges because of change in
government policies in supply chain and the company target only gas and oil so that
reason the sales could be variation over the past financial fiscals
4.5.4 Profit analysis of Aegis Logistics Ltd
Particulars 2008 2009 2010 2011 2012
PBDIT 63.19 52.23 67.14 65.24 70.19
PBDT 59.07 46.05 59.1 55.09 59.88
Profit Before Tax 50.11 36.88 49.43 44.35 47.95
Net Profit 39.09 30.37 38.94 31.22 41.06
Table No. 4.5.4 Profit analysis of Aegis Logistics
Chart No 4.5.4 Profit analysis of Aegis Logistics
Interpretation
The above diagram explains about the profit of the Aegis Company Ltd in the
PBDIT, PBDT, PBT, Net Profit indicates some variation in the last five years. It explains
about the poor efficiency of the firm because the company does not adopt constant
strategy.
As a researcher point of view, the company should be clearly defined its path in
order to achieve the better performance.
4.5.5 Earning per Share of Aegis Logistics Ltd
Particulars 2008 2009 2010 2011 2012
Earning Per Share (Rs) 19.61 18.43 20.71 9.35 12.29
Table No. 4.5.5 Earning per Share of Aegis Logistics
Chart No. 4.5.5 Earning per Share of Aegis Logistics
Interpretation
2008 2009 2010 2011 2012
0
5
10
15
20
25
19.61
18.43
20.71
9.35
12.29 Earning Per Share
(Rs)
The above diagram explains about the EPS of the Aegis Logistics Ltd in year
2008 it have Rs 19.61 it plunged to 20.71 in FY2010. Due to variation in the sale, reflect
in the EPS of the company could be down to Rs 9.35. currently the company has the EPS
of Rs 12.29.
Hence the upcoming years the company has to plan to expands their business all
over the nation so value of the company will be increased in future
4.5.6 Book value (In Rs) of Aegis Logistics Ltd
Particulars 2008 2009 2010 2011 2012
Book Value (Rs) 79.01 103.99 99.05 79.14 89.11
Table No. 4.5.6 Book value (In Rs) of Aegis Logistics
Chart No. 4.5.6 Book value (In Rs) of Aegis Logistics
Interpretation
The book value of the company share in FY12 stood at Rs. 89.11. But in FY2009
the company had Rs 104 because of they have more reserves later the company utilize its fund
for expand their operation so that reason the book value could be down in the year 2010 and
2011.
4.5.8 PROFITABILITY RATIOS
Particulars 2008 2009 2010 2011 2012
Operating Profit Margin(%) 16.38 12.78 20.49 22.2 21.99
Gross Profit Margin(%) 13.98 10.29 17.09 18.04 17.99
Net Profit Margin(%) 10.39 8.09 13.38 11.73 13.96
Return On Capital
Employed(%) 27.7 21.94 20.88 16.58 16.15
Return On Net Worth(%) 24.81 17.72 20.9 11.8 13.79
Return on Long Term Funds(%) 27.7 22.31 22.14 17.29 18.06
Table No 4.5.8 Profitability Ratios
Chart No 4.5.8 Profitability Ratios
INFERENCE
The operating profit margin of the aegis logistics continuously increased over the past five years
currently the company records 21.99%. Gross Profit Margin increased due to increase in total
sales. Net Profit Margin was stood at 13.96% it was increased from 11.73% in previous year.
4.5.9 Liquidity And Solvency Ratios
Particulars 2008 2009 2010 2011 2012
Current Ratio 1.66 1.3 1.59 1.81 1.21
Quick Ratio 1.5 1.22 2.18 2.41 2.28
Debt Equity Ratio 0.25 0.17 0.41 0.24 0.27
Long Term Debt Equity Ratio 0.25 0.17 0.33 0.19 0.13
Table No 4.5.9 Liquidity And Solvency Ratios
2008 2009 2010 2011 2012
0
5
10
15
20
25
30
Operating Profit
Margin(%)
Gross Profit Margin(%)
Net Profit Margin(%)
Return On Capital
Employed(%)
Return On Net
Worth(%)
Return on Long Term
Funds(%)
Chart No4.5.9 Liquidity And Solvency Ratios
INFERENCE
The above diagram explains about the Liquidity ratio and solvency ratio of Aegis Logistics Ltd
where as there is slight variation on current ratio over five years. Quick ratio increased over
the years but in FY12 the company has 2.28:1 of quick ratio. Debt Equity Ratio denotes the
company use only owner’s funds over the years. Long term debt Equity ratio was 0.13X in 2012.
It was in 0.13 times in 2011
4.5.10 Financial highlights of Aegis Logistics Ltd
• In the FY2009, the company had buy back total of 10,20,473 equity shares at price not
exceeding Rs.143 per share through open market transactions for an aggregate amount
of Rs. 3.47Cr consequently the issue and paid up equity shares capital of the company
stands reduced to Rs. 16.44Cr.
• In the FY2010, the company had issued and allotted 12506710 equity shares at Rs.10 per
share as bonus share in the proportions of two share for every existing 3 fully paid up
2008 2009 2010 2011 2012
0
0.5
1
1.5
2
2.5
3
Series 1
Series 2
Current Ratio
Quick Ratio
shares so that reasons the company shares value stood at Rs.33.40 till current financial
year 2012.
• The reserves and surplus of the company shows that an excellent performance over the
past five years. In the FY2011 shows that abnormal growth up to 37.89% increased, in
FY2012 the reserves and surplus could be stood at 14% in past five years the company
shows 91% they retain their earnings for future expansions.
• The company spent their resources for buying more plant & equipments in FY12 spent
up to Rs.464Crs and vehicles brought about 45.43Crs. But also intangible assets like
computer software it acquires up to Rs. 81Crs. From this point of view, the company
adopts new technologies
• Aegis logistics ltd’s investment parameters shows that there is an up down movements in
FY2011 Rs 94.53Cr its was increased from 122% in the previous year. But in FY2012,
the level could be increased up to 27% about Rs27.23Crs
• Inventories are valued at cost or net realizable Value whichever is less. Cost is
determined by using the first in first out formula. Cost comprises all costs of purchase,
cost of conversion and cost incurred to bring inventories to their present location and
condition other than those subsequently recoverable by company form tax authorities.
• The level of sundry debtors value could be increased over the past five years in FY12 is
shows that Rs.31.41Crs
• Aegis company adopts just in time inventory concept in which they would not focus
on inventories because all material in movements. So the inventory level continuously
decreased.
• Aegis Company they deposit level could be increased over the past performance in this
way the firm deposit their amount in banks for increase the current ratio position in the
markets.
• The firm lends loans and advances to their subsidiaries and other government deposit in
FY12 they provide Rs.81.14Crs.
• Meanwhile the total current asset could be increased up to Rs 30.63crs. Due to increased
interest accrued on fixed deposits, unamortized interest on buyers’ credit & premium on
Option contracts, unamortized premium on share and Debentures increased to Rs 5crs.
• The company short term borrowings could be increased still it stood at Rs.12.99Crs
• The current liabilities of aegis shows that fluctuation over the past five years in the FY12
the company increased about Rs 14.27 Crs
• The company had a continuous poor performance on sales over the past four years. In
FY12 that records 10% slight growth in sales.
• Due to low production that one reason for reduction in decline in sales in past four years.
•During the year the company has registered income from operation of Rs. 62.36Crs.as
compared to Rs. 57.32Crs In FY2011.
• Profit before Depreciation Interest and Tax (PBDIT) has increased Rs 4.95Cr. For the year
ended March 31, 2011 PBDIT was Rs.65.24 Cr. It showing an increase of 7.5%. During
FY2012, the company has recorded PBDIT of Rs 70.19Crs of the income from operation
as against -2% during FY2011.
•In the year 2008, the company performs Rs39.09Cr level of net profit in FY09 it was
decreased of Rs. 8Crs then stood at Rs.30.37Crs. in the FY10 the level of profit could
be increased 28%. Finally in the FY12 the company records the Rs41.06Crs. It was
increased from 31% in the past FY11.
•The book value of the company shows that there is a fluctuation in over past financial
years. Now it stand at Rs 89.00
•EPS calculation made over the years indicate whether or not the firm’s earnings on per
share basis has changed over the period under this case the company EPS shows that
some variation over the past five financial years. In FY12, Aegis company EPS stood at
Rs. 12.29 the face value is Rs 10 only.
• The company recommends the dividend of Rs 6.68 in FY12. It was 20
% low compare to previous financial year 2011.
• The gross profit ratio reflects the efficiency with which management produce each unit
of product. This is explaining about the relative to sales after the deduction of production
costs, and indicates the relation between production costs, and selling price. Under this
case aegis record over the past financial years it shows good results it increase to 22% in
FY12
• The ratio of return of net worth was in FY2008 was 13.79% it was increased in FY12 was
stood at 27.70%
• The company recommends Rs 2.50 in FY12. Due to retains their resources as general
reserves.
• Net profit margin ratio means a relationship between net profit and sales and indicates
management’s efficiency in manufacturing, administering and selling products. In aegis
company’s net profit margin indicate that some variations in past five years. In FY12 it
stands at 13.96% it was increased from pervious financial years 11.73%.
• The current ratio of aegis’s company shows that there is constant position over the years.
• Number of days in working capital in the FY12 is increased because of the lot of
completion in the markets. So the working capital cycle now in 144 days.
4.5.11 SWOT Analysis of Aegis Logistics Ltd
Strength
ü Strong brand image.
ü Quality and reliability.
ü A leader in Oil, Gas and Chemical
Logistics
ü Direct delivery capability
ü Strength market position in west India
segment like Karnataka, Maharashtra,
Gujarat.
Weakness
ü Government influence over price of oil,
gas and chemical
ü Bad infrastructure in India like road,
communication, port
Opportunities
ü Could seek better supplier deals
üLarge, potential domestic and
international
ü to utilize their general reserve for future
expansion
ü company can enter in to east India
segment
Threats
ü Competition from low quality from local
terminals
ü LPG domestic sector subsides continue
to eat into margins and sales as domestic
cooking gas gets illegally diverted into
other market segment such as autogas
and commercial cylinder.
ü Bad infrastructure facilities in India.
Table No 4.5.11 SWOT Analysis of Aegis Logistics
1.6 COMPETITIVE ADVANTAGES ANALYSIS
4.6.1 RESERVE AND SURPLUS OF INDUSTRY
Company Name
Reserve and Surplus
2008 2009 2010 2011 2012
Aegis Logistics 137.64 154.91 167.47 230.93 264.23
Allcargo Logistics 361.65 443.53 765.18 951.68 1113.16
Aqua Logistics 28.48 44.52 206.47 493.61 491.56
Arshiya International 445.23 475.36 483.91 502.62 540.81
Container Corporation of India 3118.93 3632.23 4206.42 4847.83 5476.45
Industries Average 818.39 950.11 1165.89 1405.33 1577.24
Table No 4.6.1 Reserve and Surplus of Industry
Chart No 4.6.1 Reserve and Surplus of Industry
Inference
The above diagram explain about the reserve and surplus of the logistics industry in which the
Container Corporation of India has more resources compare to its competitors
1.1.2 NET WORTH OF INDUSTRY
Company Name
Networth
2008 2009 2010 2011 2012
Aegis Logistics 157.55 174.70 186.24 264.33 297.63
Allcargo Logistics 385.51 496.87 791.79 979.01 1140.14
Aqua Logistics 39.94 57.44 227.01 523.61 521.56
Arshiya International 458.97 490.1 496.84 514.89 552.58
Container Corporation of India 3183.92 3762.21 4336.40 4977.81 5606.43
Industries Average 845.178 996.264 1207.656 1451.93 1623.668
Table No 4.6.2 Net Worth Of Industry
Chart No 4.6.2 Net Worth Of Industry
Inference
The diagram explain about the net worth of industries where as the average of industries
could be increased over the past five years. In which the Container Corporation of India has
greater than the average. The remaining companies have the below the average. Allcargo
Logistics have the chance to prosperity in future. But Aegis performs similar result over the
2008 2009 2010 2011 2012
0.00
1000.00
2000.00
3000.00
4000.00
5000.00
6000.00
7000.00
Aegis Logistics
Allcargo Logistics
Aqua Logistics
Arshiya International
Container Corporation of
India
Series 6
Series 7
Series 8
Series 9
Series 10
years.
1.1.3 SALES
Company Name
Net Sales
2008 2009 2010 2011 2012
Aegis Logistics 373.88 368.33 284.67 258.14 283.5
Allcargo Logistics 361.25 516.79 516.76 699.84 1,079.43
Aqua Logistics 108.99 213.4 322.01 380.88 310.35
Arshiya International 201.91 256.39 273.61 453.01 592.63
Container Corporation of India 3347.30 3417.16 3705.68 3828.12 4060.95
Industries Average 878.666 954.414 1020.546 1123.998 1265.372
Table No 4.6.3SALES
Chart No 4.6.3SALES
INFERENCE
The diagram denotes that Net Sales of the overall industries the Container Corporation of India
have good performance over the years it had more sales compare to the industries averages.
Allcargo Logistics nearly touch the average in the FY12 then Arshiya International shows that
2008 2009 2010 2011 2012
0
500
1,000
1,500
2,000
2,500
3,000
3,500
4,000
4,500
5,000
Aegis Logistics
Allcargo Logistics
Aqua Logistics
Arshiya International
Container Corporation of
India
Industries Average
beat performance in the past five years. But Aegis and Aqua Logistics most horrible performance
compare to other companies.
1.1.4 TOTAL INCOME
Company Name
Total Income
2008 2009 2010 2011 2012
Aegis Logistics 375.8 366.81 298.37 263.46 291.04
Allcargo Logistics 365.27 536.82 532.1 742.77 1130.49
Aqua Logistics 79.72 132.66 144.69 182.44 309.02
Arshiya International 207.26 266.21 280.03 474.75 630.01
Container Corporation of India 3506.02 3620.73 3869.75 4001.57 4377.49
Industries Average 906.814 984.646 1024.988 1132.998 1347.61
Table No 4.6.4 Total Income
Chart No 4.6.4 Total Income
INFERENCE
The diagram explains about the total income of the companies. The industries average of
in the year 2012 Rs. 1347.61Crs but the Container Corporation of India sales corresponding year
is Rs. 4377Crs their contribution is highest than other companies. The Allcargo shows also near
2008 2009 2010 2011 2012
0
1,000
2,000
3,000
4,000
5,000
6,000
7,000
8,000
Aegis Logistics
Allcargo Logistics
Aqua Logistics
Arshiya International
Container Corporation of
India
Series 6
Series 7
Series 8
Series 9
Series 10
to the average. But Aegis company performance has the variation over the five years even its
below the average. While compare to total income of the industry. The Container Corporation of
India has the competitive advantage in the industries.
1.1.5 Operating Profit
Company Name
Operating Profit
2008 2009 2010 2011 2012
Aegis Logistics 61.27 47.09 58.34 57.32 62.36
Allcargo Logistics 79.72 132.66 144.69 182.44 309.02
Aqua Logistics 12.77 22.35 32.91 35.76 15.78
Arshiya International 14.03 20.7 22.16 53.13 128.65
Container Corporation of India 890.73 931.12 961.97 1002.69 1023.73
Industries Average 211.704 230.784 244.014 266.268 307.908
Table No 4.6.5Operating Profit
Chart No 4.6.5Operating Profit
INFERENCE
2008 2009 2010 2011 2012
0
200
400
600
800
1,000
1,200
1,400
1,600
1,800
Aegis Logistics
Allcargo Logistics
Aqua Logistics
Arshiya International
Container Corporation of India
Industries Average
The above diagram explains the operating profit of the industries. This ratio used to discuss the
general profitability of the concern. The Container Corporation of India more than the industry
average it shows that more efficiency firm. Allcargo Company is near to the average in the year
2012. But the balance three companies much could be improves its performance because it
denotes lower efficiency.
1.1.6 PBIDT
Company Name
PBDIT
2008 2009 2010 2011 2012
Aegis Logistics 63.19 52.23 67.14 65.24 70.19
Allcargo Logistics 83.74 152.69 160.03 225.37 360.08
Aqua Logistics 13.19 23 32.8 36.61 17.36
Arshiya International 19.38 30.52 28.58 74.87 166.03
Container Corporation of India 1049.45 1134.69 1126.04 1176.14 1340.27
Industries Average 245.79 278.626 282.918 315.646 390.786
Table No 4.6.6 PBIDT
Chart No 4.6.6 PBIDT
2008 2009 2010 2011 2012
0
200
400
600
800
1,000
1,200
1,400
1,600
Aegis Logistics
Allcargo Logistics
Aqua Logistics
Arshiya International
Container Corporation of
India
Industries Average
INFERENCE
The diagram denotes the Profit Before Depreciation Interest and Taxes of the companies
where as Container Corporation of India is more than the company average. Other companies are
below the average in which Allcargo is in the year 2012 near to the average.
1.1.7 PROFIT BEFORE TAX
Company Name
Profit Before Tax
2008 2009 2010 2011 2012
Aegis Logistics 50.11 36.88 49.43 44.35 47.95
Allcargo Logistics 66.96 109.11 106.19 157.26 220.49
Aqua Logistics 8.8 17.11 26.14 25.48 1.71
Arshiya International 18.02 28.14 22.26 36.35 69.19
Container Corporation of India 942.87 1018.72 990.85 1030.61 1181.78
Industries Average 217.352 241.992 238.974 258.81 304.224
Table No 4.6.7 Profit Before Tax
2008 2009 2010 2011 2012
0
200
400
600
800
1,000
1,200
Aegis Logistics
Allcargo Logistics
Aqua Logistics
Arshiya International
Container Corporation of
India
Series 6
Series 7
Series 8
Series 9
Series 10
Chart No 4.6.7 Profit Before Tax
INFERENCE
The Profit Before Taxes is the difference between profit before interest and taxes and
interest charge (PBT=PBIT-INT). PBT may also include non-operating profit. Whereas the
above diagram explains that the Container Corporation of India earns more PBT. The other
companies never touch the companies’ averages.
1.1.8 NET PROFIT
Company Name
Net Profit
2008 2009 2010 2011 2012
Aegis Logistics 39.09 30.37 38.94 31.22 41.06
Allcargo Logistics 59.78 92.67 97.81 121.13 184.07
Aqua Logistics 5.61 11.15 20.54 22.39 1.15
Arshiya International 12.36 18.49 15.4 24.93 47.51
Container Corporation of India 752.21 791.2 786.69 875.95 877.88
Industries Average 173.81 188.776 191.876 215.124 230.334
Table No 4.6.7 Profit Before Tax
2008 2009 2010 2011 2012
0
100
200
300
400
500
600
700
800
900
Aegis Logistics
Allcargo Logistics
Aqua Logistics
Arshiya International
Container Corporation of
India
Series 6
Series 7
Series 8
Series 9
Series 10
4.6.7 Profit Before Tax
INFERENCE
The diagram explains about Net Profit of the company in which Container Corporation of
India is earn more profit compare to its overall companies. It have the competitive advantage in
the market. All cargo in the year 2012 near to industries average so it have superior growth
upcoming years
1.1.9 EARNING PER SHARE
Company Name
Earning Per Share (Rs)
2008 2009 2010 2011 2012
Aegis Logistics 19.61 18.43 20.71 9.35 12.29
Allcargo Logistics 29.51 41.44 7.84 9.28 14.1
Aqua Logistics 4.9 8.63 10 0.75 0.04
Arshiya International 2.17 3.15 2.62 4.24 8.08
Container Corporation of India 115.74 60.87 60.52 67.39 67.54
Industries Average 34.386 26.504 20.338 18.202 20.41
Table No 4.6.9 Earning Per Share
Chart No 4.6.9 Earning Per Share
INFERENCE
The profitability of the shareholders’ investments can also be measured in this way like
EPS. It indicate whether or not the firm’s earning power on per share basis has changed over the
period. The diagram shows that the Container Corporation of India has more earning per share
compare to its companies. The others are below the companies’ average
1.1.10 NET PROFIT MARGIN (%)
Company Name
Net Profit Margin(%)
2008 2009 2010 2011 2012
Aegis Logistics 10.39 8.09 13.38 11.73 13.96
Allcargo Logistics 16.48 17.76 18.5 16.79 16.28
Aqua Logistics 5.14 5.22 6.37 5.85 0.36
Arshiya International 5.94 7 5.45 5.25 7.54
Container Corporation of India 21.45 21.92 20.32 21.88 20.05
Industries Average 11.88 11.998 12.804 12.3 11.638
Table No 4.6.10 Net Profit Margin
2008 2009 2010 2011 2012
115.74
60.87 60.52
67.39 67.54
Aegis Logistics
Allcargo Logistics
Aqua Logistics
Arshiya International
Container Corporation of India
Chart No4.6.10 Net Profit Margin
INFERENCE
Net Profit Margin ratio establishes a relationship between net profit and sales and indicates
management’s efficiency in manufacturing, administering and selling products. This ratio is the
overall measure of the firm’s ability to turn each rupee sales into profit. If the net margin is
inadequate, the firm will fail to achieve satisfactory return on shareholder’s funds. Whereas the
diagram explains that Container Corporation of India have more efficiency compare to other
companies. The other companies’ performances are below the average of the industries.
1.1.11Current Ratio
Company Name Current Ratio
Company Name 2008 2009 2010 2011 2012
Aegis Logistics 1.66 1.3 1.59 1.81 1.21
Allcargo Logistics 1.55 3.33 2.98 2.65 2.08
Aqua Logistics 5.06 5.95 2.75 5.89 3.26
Arshiya International 6.46 0.75 1.3 1.27 2.02
Container Corporation of India 2.65 2.66 3.03 3.63 4.15
Industries Average 3.476 2.798 2.33 3.05 2.544
Table No 4.6.11 Current Ratio
2008 2009 2010 2011 2012
21.45 21.92 20.32 21.88 20.05
Aegis Logistics
Allcargo Logistics
Aqua Logistics
Arshiya International
Container Corporation of India
Series 6
Series 7
Series 8
Series 9
Series 10
Chart No 4.6.11 Current Ratio
INFERENCE
The current ratio is a measure of the firms’ short term solvency. As conventional rules, a
current ratio of 2:1 or more is considered satisfactory. Whereas the diagram explains about the
current ratio of the companies in which the Container Corporation of India have the grater the
margin of safety. But Aegis Logistics company ratio indicates that inadequate margin of safety
for creditors. Arshiya International have the variation over the past five years later in the FY12
company has good performance. Allcargo has also records good performance over the years
4.7 BRIEF HISTORY OF BOSTON CONSULTANCY GROUP
The Boston Consulting Group was started up in 1963 by Bruce Henderson and from its
inception sought to establish itself in the planning and was considered the pioneer of Business
Strategy analysis. Boston Consulting Group was founded as the Management and Consulting
Division of the Boston Safe Deposit and Trust Company - a subsidiary of The Boston Company.
In 1968, The Boston Company spinned off BCG as a separate subsidiary.
In 1965 Henderson thought that to survive, much less grow, in a competitive landscape occupied
by hundreds of larger and better-known consulting firms, a distinctive identity was needed,
2008 2009 2010 2011 2012
0
1
2
3
4
5
6
Aegis Logistics
Allcargo Logistics
Aqua Logistics
Arshiya International
Container Corporation of
India
Series 6
Series 7
Series 8
Series 9
Series 10
and pioneered "Business Strategy" as a special area of expertise for BCG.As his client list
grew, Henderson targeted the nation's best business schools. At some point he was said to
have eclipsed McKinsey as the top recruiter at Harvard, aggressively wooing its best students
with high salaries and the chance to make a difference in a cutting-edge firm. He encouraged
the brilliant young minds he hired to come up with innovative ideas that were meant to dazzle
hardened corporate veterans.
In 1973 Bill Bain and others left BCG to form Bain & Company, and two years later Henderson
arranged an employee stock ownership plan (ESOP), so that the employees could take the
company independent from The Boston Safe Deposit and Trust Company. The buyout of all
shares was completed in 1979.
In 1998 BCG created The Strategy Institute. Its purpose is to enrich the firm's strategic thinking
by applying insights from a variety of academic disciplines to the strategic challenges facing
both business and society.
The Boston Consulting Group (BCG) ranked 8th overall and first among smaller companies
in Fortune Magazine's 2007 "100 Best US Companies to Work For" survey, based on strong
employee development, a supportive culture, and progressive benefits.
4.7.1 BCG Growth-Share Matrix
In the late 1960’s a consultant for the Boston Consulting Group presented his ideas about ‘cash
deficient’ and ‘growth deficient’ businesses and the need for a balance between cash generators
and cash users.
In the late 1960’s the Boston Consulting Group developed a portfolio business model based
on this thinking. The model, the BCG matrix or growth/share matrix, was based on the Boston
Consulting Group’s knowledge and work in the area of the experience curve and of the product
life cycle and how they relate to cash generation and cash requirements.
The growth-share matrix was intended to analyse a portfolio from a corporate perspective
because it is only at that level that cash balance is meaningful. A business may, however, be
segmented further using this diagnostic tool to understand the positions of its various product
lines or market segments. This portfolio can therefore be made up of products in a multi-product
company, divisions in a multidivisional company and companies in a conglomerate.
The BCG Growth-Share Matrix is based on the observation that a company's business units can
be classified into four categories based on combinations of market growth and market share
relative to the largest competitor, hence the name "growth-share". Market growth serves as a
proxy for industry attractiveness, and relative market share serves as a proxy for competitive
advantage. The growth-share matrix thus maps the business unit positions within these two
important determinants of profitability The BCG Growth-Share Matrix positions the various
SBUs/product lines on the basis of Market Growth Rate and Market Share relative to the most
important competitor as shown below;
Relative market share
This indicates likely cash generation, because the higher the share the more cash will be
generated. As a result of 'economies of scale' (a basic assumption of the BCG Matrix), it is
assumed that these earnings will grow faster the higher the share. The exact measure is the
brand's share relative to its largest competitor. Thus, if the brand had a share of 20 percent, and
the largest competitor had the same, the ratio would be 1:1. If the largest competitor had a share
of 60 per cent, however, the ratio would be 1:3, implying that the organization's brand was in
a relatively weak position. If the largest competitor only had a share of 5 per cent, the ratio
would be 4:1, implying that the brand owned was in a relatively strong position, which might be
reflected in profits and cash flows. If this technique is used in practice, this scale is logarithmic,
not linear.
On the other hand, exactly what is a high relative share is a matter of some debate. The best
evidence is that the most stable position (at least in FMCG markets) is for the brand leader to
have a share double that of the second brand, and triple that of the third. Brand leaders in this
position tend to be very stable - and profitable.
The reason for choosing relative market share, rather than just profits, is that it carries more
information than just cash flows. It shows where the brand is positioned against its main
competitors, and indicates where it might be likely to go in the future. It can also show what type
of marketing activities might be expected to be effective.
Market growth rate
Rapidly growing brands, in rapidly growing markets, are what organizations strive for; but the
penalty is that they are usually net cash users - they require investment. The reason for this is
often because the growth is being 'bought' by the high investment, in the reasonable expectation
that a high market share will eventually turn into a sound investment in future profits. The theory
behind the matrix assumes, therefore, that a higher growth rate is indicative of accompanying
demands on investment. The cut-off point is usually chosen as 10 per cent per annum.
Determining this cut-off point, the rate above which the growth is deemed to be significant (and
likely to lead to extra demands on cash) is a critical requirement of the technique; and one that,
again, makes the use of the BCG Matrix problematical in some product areas. What is more, the
evidence, from FMCG markets at least, is that the most typical pattern is of very low growth, less
than 1 per cent per annum. This is outside the range normally considered in BCG Matrix work,
which may make application of this form of analysis unworkable in many markets.
Where it can be applied, however, the market growth rate says more about the brand position
than just its cash flow. It is a good indicator of that market's strength, of its future potential
(of its 'maturity' in terms of the market life-cycle), and also of its attractiveness to future
competitors. It can also be used in growth analysis.
Resources are allocated to business units according to where they are situated on the grid
as follows:
Dog - a business unit that has a small market share in a mature industry. A dog may not
require substantial cash because dogs have low market share and a low growth rate and thus
neither generate nor consume a large amount of cash, and dogs are cash traps because of the
money tied up in a business that has little potential and the capital that could better be deployed
elsewhere. Unless a dog has some other strategic purpose, such businesses are candidates for
divestiture, and it should be liquidated if there is little prospect for it to gain market share.
Question Mark (or Problem Child) - a business unit that has a small market share in a high
growth market. Question marks are growing rapidly and thus consume large amounts of cash,
but because they have low market shares they do not generate much cash. The result is large net
cash consumption. A question mark (also known as a "problem child") has the potential to gain
market share and become a star, and eventually a cash cow when the market growth slows. If
the question mark does not succeed in becoming the market leader, then after perhaps years of
cash consumption it will degenerate into a dog when the market growth declines. Question marks
must be analyzed carefully in order to determine whether they are worth the investment required
to grow market share.
Star - a business unit that has a large market share in a fast growing industry. Stars generate
large amounts of cash because of their strong relative market share, but also consume large
amounts of cash because of their high growth rate; therefore the cash in each direction
approximately nets out. If a star can maintain its large market share, it will become a cash cow
when the market growth rate declines. The portfolio of a diversified company always should
have stars that will become the next cash cows and ensure future cash generation. If successful, a
star will become a cash cow when its industry matures.
Cash Cow - a business unit that has a large market share in a mature, slow growing industry.
As leaders in a mature market, cash cows exhibit a return on assets that is greater than the
market growth rate, and thus generate more cash than they consume. Such business units should
be "milked", extracting the profits and investing as little cash as possible. Cash cows provide the
cash required to turn question marks into market leaders, to cover the administrative costs of the
company, to fund research and development, to service the corporate debt, and to pay dividends
to shareholders. Because the cash cow generates a relatively stable cash flow, its value can be
determined with reasonable accuracy by calculating the present value of its cash stream using a
discounted cash flow analysis. Cash cows require little investment and generate cash that can be
used to invest in other business units.
Chart No 4.7.1 BCG MATRIX
4.7.3 BCG ANALYSIS FOR LOGISTICS INDUSTRY IN INDIA
MARKET SHARE & GROWTH OF SELECTED LOGISTICS
COMPANIES IN 2012
Company Name Company Growth Market share in 2012
Aegis Logistics -24.17 4.48
Allcargo Logistics 198.80 17.06
Aqua Logistics 184.75 4.91
Arshiya International 193.51 9.37
Container Corporation of India 21.32 64.19
Table No 4.7.1 Market Share and Growth of companies
Market shares and market growth are calculated from net sales of the companies. It covers five
years periods.
Chart No 4.7.2 Market Share of logistics companies in India
Relative market share
R
el
at
iv
e
M
a
r
k
et
G
r
o
w
t
h
HIGH LOW
H
I
G
H
Stars Question Marks
L
O
W
Cash Cows Dogs
Table No 4.7.3 BCG Matrix for Logistics Industry in India
1. Stars
The stars though generate funds but need to be constantly invested into because their prospectus
of becoming cash cows depends on the pre-requisite of them being the market leader. Container
Corporation of India, Arshiya International comes this position in which the company take
following strategic decision
Market Development
• The Allcrgo Logistics Company can develop new product to capture market share in the
industry. Currently company hold high in growth due to earn more profit over the five
years
Market penetration
• CONCORE can penetrate in to develop rail road to connect new cities, implement
developed technologies
• Arshiya International can improve their warehousing facilities to speed up the delivery
time
2. Question marks
Since they are the new entrants or strugglers in the market for major share where the
market is changing at a high pace, efforts are being made to make sure that the gain on their
market share. Arshiya International comes under this position
Product development
• To develop wide range of product in order to catch the new market in India also in
aboard
• To improve the 3PL segment it leads to increase the market growth
3. Cash cows
Since the cows needed to be milked now and then, and efforts are to be made to ensure that they
maintain the largest share in the market the following strategies are being adopted by Aegis
Logistics Ltd
Product development
• CONCORE can develop their market into air cargo, to cover new market to increase its
operation in order to maintain this position in this industry
• CONCORE can develop market in pipe line logistics segment
• The company can come in to cargo handling segment, warehousing, container etc
• The company may enter in to 3PL in segment
Concentric diversification
The COCORE Company may add extra value to its existing product like new pipe line
between new markets. Focus to India market segment like road segment, airways
4. Dogs
They are run on breakeven point and in the eyes of an accountant they are not even viable. But
can be important for synergies
Aegis Logistics and Aqua Logistics comes under dog criteria in which the company deal with
single segment so the company can diversify their business into various segment it increase their
value in the marget.
Divestments
• The company can come in to cargo handling segment, warehousing, container etc
• The company may enter in to 3PL in segment
• The company can improve their operation by way of increase the market segment.
4.8 GE MATRIX FOR LOGISTICS INDUSTRY
GE / McKinsey Matrix are strategic and marketing management tool used for portfolio
analysis. Most of the time, this tool is used for analyzing the portfolio of products, services, and
strategic business units. GE Matrix is similar to BCG Matrix and it is an extension of the BCG
Matrix approach - multifactor portfolio analysis tool. The GE Matrix compares different
businesses on "Business Strength" and "Market Attractiveness" variables, plus the size of the
bubbles in the matrix represents the market size instead of business sales used in the BCG
Matrix. The share of the market or business sales vs. market size is represented as pie chart
inside the bubbles in the matrix. This allows business users to compare business strength, market
attractiveness, market size, and market share for different strategic business units (SBUs) or
different product offerings on one matrix or chart.
4.8.1 GE MATRIX - ALTERNATIVE POSITIONS & STRATEGIES
The GE / McKinsey Matrix is divided into nine cells - nine alternatives for positioning of
any SBU or product offering. Based on the strength of the business and its market attractiveness
each SBU will have a different position in the matrix. Further, the market size and the current
sales will distinguish each SBU. Based on clear understanding of all of these factors decision
makers are able to develop effective strategies.
The nine cells in the matrix can be grouped into three major segments:
Segment 1: This is the best segment. The business is strong and the market is attractive. The
company should allocate resources in this business and focus on growing the business and
increase market share.
Segment 1
Segment 2: The business is either strong but the market is not attractive or the market is strong
and the business is not strong enough to pursue potential opportunities. Decision makers should
make judgment on how to further deal with these SBUs. Some of them may consume to much
resources and are not promising while others may need additional resources and better strategy
for growth.
Segment 2
Segment 3: This is the worst segment. Businesses in this segment are weak and their market is
not attractive. Decision makers should consider either repositioning these SBUs into a different
market segment, develop better cost-effective offering, or get rid of these SBUs and invest the
resources into more promising and attractive SBUs.
Segment 3
4.8.2 MARKET SHARE & GROWTH OF SELECTED LOGISTICS
COMPANIES IN 2012
Company Name Company Growth Market share in 2012
Aegis Logistics -24.17 4.48
Allcargo Logistics 198.80 17.06
Aqua Logistics 184.75 4.91
Arshiya International 193.51 9.37
Container Corporation of India 21.32 64.19
Table No Market share & Market Growth
4.8.3 GE MATRIX FOR LOGISTICS INDUSTRY
High Medium Low
H
ig
h
M
e
di
u
m
L
o
w
MARKETATTRACTIVENESS
Business Unit Strength
Allcargo
AegisCCI
Aqua
Arshiya
INFERENCE
• In India the industry attractiveness is highly increased over a decades. India
allowed FDI 100% though the performance of logistics company shows
excellent performance
• by using GE matrix, the Allcargo have more market attractiveness and
market growth and market share in among companies
• Arshiya International having good growth in market so it below the market
shares. So the company can increase their market shares by increasing the
operation in up coming periods
• The Container Corporation of India had competitive position in Indian
market but the growth of the company is less than the Allcargo. The
company can increase their capacity over the market
• Aegis Logistics company leader in Oil, Gas and Chemical segment but its
performance was comes under negative points because of it focus particular
segment so the company can set up new plants. To cover the all over the
India
• The performance of Aqua logistics company denotes that company having
good financial records over the years so the growth of the company goes
double digits even the market share remain in constants its face the lot of
competitions in the market
4.9 SWOT ANALYSIS OF INDIAN LOGISTICS INDUSTRY
4.9.1 Strength and weakness
• Logistics industry contribute 10-13 % in GDP in India
• Ranked at 46th position in world in 2012
• Vital role in import and export business
• Cheap labour available in India
• Improve infrastructure like development of new roads, rail road, ports
• 100% in FDI in India
• Quality and reliability
• Direct delivery capability
• Currently industry use latest technology
4.9.2 Weakness
• Poor performance in infrastructure facilities in india
• Lack of experienced people while taking strategic decisions
• Poor physical facilities like road, port, rail road, IT etc
• State and central government policies over its industry like import restriction over certain
products and export for certain scare products
• Competitors from international players like DHL, UPS, TNT, FEDEX, Blue Dart etc
• Indian logistics company adopt inadequate technology compare to foreign competitors
4.9.3 Opportunities and Threats
Opportunities - Growth and future of 3PL Market in India
CRISIL Research has estimated the 3PL market in India at Rs 47-50 billion in 2008-09, which is
expected to grow at a CAGR of 27% to Rs162-165 billion by 2013-14.
3PL penetration has been the highest in sectors such as cars and organized retail. The segment is
also gaining importance in other sectors such as IT hardware and FMCG. The share of 3PL in the
overall logistics market is expected to increase from around 1.5 - 2.0% in 2008-09 to around
3.5 – 4% by 2013-14. The benefits would accrue in the form of:
• Reduction in warehousing space requirement
• Improvement in efficiency due to better inventory management
• Reduction in transportation cost due to higher capacity utilisation
The segment is also gaining importance in other sectors such as Power, Infrastructure,IT
hardware and FMCG.
Threats - Key Challenges faced by the Indian Logistics Sector
1. Logistics has historically been a high-cost, low-margin business. The problem of organized
players is compounded by unfair competition with unorganized players, who can get away
without paying taxes and following operating norms stipulated in the Motor Vehicles Act such as
quality of drivers and vehicles, volume and weight restrictions, etc.
2. Economies of scale are absent in the Indian logistics industry. Even the organized sector
that contributes slightly more than 1% of the logistics cost, is highly fragmented. Existences of
the differential sales tax structure have brought in diseconomies of scale. Though VAT (Value
Added Tax) has been implemented since April 1, 2005, failure in implementation of a uniform
VAT structure across different states has let the problem persist even today.
3. Apart from the non-uniform tax structure, Indian LSPs have to pay numerous other taxes,
octopi, and face multiple check posts and harassment from authorities. High costs of operation
and delays involved in compliance with varying documentation requirements of different states
make the business unattractive. It is assumed that on an average, a vehicle on Indian roads loses
24-48 hours in complying with paperwork and formalities at different check posts en route to a
destination and also precious fuel is spent waiting at check posts.
4. There is lack of trust and awareness among Indian shippers with regard to outsourcing
logistics. The volume of outsourcing by Indian shippers is presently very low (~ 10%) compared
to the same for the developed countries (> 50%, sometimes as high as 80%). The unwillingness
to outsource logistics on part of Indian shippers may be attributed to scepticism about the
possible benefits, perceived risk, and losing control, of sensitive organizational information, and
vested interests in keeping logistics activities in-house.
5. Indian shippers expect LSPs to own quality assets, provide more value-added services and
act as an integrated service provider, and institute world-class information systems for more
visibility and real-time tracking of shipments. However, they are unwilling to match the same
with increased billings; even pay little attention to timely payments that leave LSPs short of
adequate working capital.
6. Indian freight forwarders face stiff competition from multi-national freight forwarders for
international freight movement. MNCs, because of their size and operations in many countries,
are able to offer low freight rates and extend credit for long periods. Indian freight forwarders, on
the other hand, because of their smaller size and lack of access to cheap capital, are not able to
match the same.
7. Poor physical and communications infrastructure is another deterrent to attracting investments
in the logistics sector. Road transportation accounts for more than 60% of inland transportation
of goods, and highways that constitute 1.4% of the total road network, carry 40% of the freight
movement by roadways. Slow movement of cargo due to bad road conditions, multiple check
posts and documentation requirements, congestion at seaports due to inadequate infrastructure,
bureaucracy, red-tapism and delay in government clearances, coupled with unreliable power
supply and slow banking transactions, make it difficult for exporters to meet the deadlines for
their international customers. To expedite shipments, they have to book as air freight, rather than
sea freight, which adds to the costs of shipments making them uncompetitive in international
markets.
8. Low penetration of IT and lack of proper communications infrastructure also result in delays,
and lack of visibility and real-time tracking ability. Unavailability and absence of a seamless
flow of information among the constituents of LSPs creates a lot of uncertainty, unnecessary
paperwork and delays, and lack of transparency in terms of cost structures and service delivery.
9. Shippers would like LSPs to offer more value-added services and a single-stop solution to
all their logistical problems. The inability of service providers to go beyond basic services and
provide value-added services such as small repair work, kitting/de-kitting, packaging/labeling,
order processing, distribution, customer support, etc. has not been able to motivate shippers to go
for outsourcing in a big way.
10. There is lack of skilled and knowledgeable manpower in the logistics sector. Management
graduates do not consider logistics as a prime job. To improve the status of the industry, service
providers have to move beyond the level of brokers and truckers to attract and retain talent.
CHAPTER IV
FINDINGS AND CONCLUSION
5.1 FINDINGS
• The Container Corporation of India records good financial performance in past five
years. In which the company have more reserves compare to its company with in
industry. So the company enjoyed competitive position in the market.
• CONCORE was leader in rail road segment. Because the company has major player in
rail way cargo handling followed by Arshiya International, Allcargo Logistics.
• Even the Allcargo Logistics Company had good performance in both market growth and
market shares in past five years. Because the company operates worldwide level up to 65
countries.
• Aegis Logistics enjoy as leader in Oil, Gas, Chemical handing the company had
poor financial performance over five years because of poor infrastructure facilities in
prevailing in India. But the company only target east India segment only. Hence the
company had strong financial resources compare to its company in industry.
• Strength of CONCORE, Arshiya in railway cargo handling, CFS, MOT. Allcargo, Aqua
is strength in third party logistics and warehousing and information technology, Aegis
Logistics company strength in Oil, Gas field.
• The weakness of all of the company is to face tough competition towards world level due
to change in government policies, fluctuation in foreign currency, poor physical facilities
in India.
• India ranked at 46th position in Logistics performance Index all over the world
• The overall industry strength is the level of GDP increased by its industry. The industry
contributed 13-14% as GDP in 2012.
• Industry analysis explains that the CONCORE attains competitive position in the market
followed by Allcargo, Arshiya International
• Aegis Logistics company attained competitive position in Oil, Gas, and Chemical
segment.
• The overall industry average income was increased continuously over the period. In
FY12 the industry average income stood at Rs1347Cr.
• The operating profit explains that CONCORE got more profit followed by Allcargo,
Arshiya Int.
• The Earning Per Share (EPS) of CONCORE in FY12 Rs67.54
• The all companies are followed acceptable level of current ratio. In which the working
capital level is better in CONCORE and followed by Aqua
• By using BCG matrix the Allcargo company get star position, Arshiya Int. stand at
question mark position, CONCORE comes under cash cow area, the other two companies
like Aqua, Aegis comes in dog position.
• By using GE matrix
5.2 SUGGESTION
• India should develop infrastructure facilities improve road structure like extension the road,
to improve the capacity of ports and develop new ports in India.
• Railroad must be developed because it leads to reliability in supply of goods and services
quickly.
• The Air port should be improve their capacity level and create more air port in India so the
level of cargo handling can be increased
• To adopt latest information technology like GPS, inventory control, material handling
equipments, it helps to decrease the cost of operation in order to utilize the resource
effectively
• CONCORE may enter into airways, 3PL it provide more revenue to company.
• CONCORE can acquisition of other company in which it may enter into new segment like
Free Trade Warehousing Zones.
• Allcargo company may enter into CFS in which improve its capacities
• Aegis Company may expand their operation throughout the India. So it can cover all over
the India
• Arshiya International company have financially strong position in market so the company
have estimated the project outlay of Rs 1600 crore for the acquisition of 75 Rakes, break
vans, building of rail siding and other necessary infrastructure across the country. Its helps
to investors interest over the company shares in market
• Arshiya International can develop their Free Trade Warehousing Zones in other major
cities like Chennai port, Tuticorin ports and others majors ports in India
• Aqua Logistics company can improve their operation by way of increasing its contracts
Logistics and The company had a Multi-Modal Transport Operator's License, an IATA
Accreditation and a Custom House Agent's License for servicing customers' requirement
could be match accordingly
• Aqua Logistics may enter into FTWZ, MTO its create increase their performance in the
markets
5.3 CONCLUSION
The project titled “A Study on Logistics Industry in India” in which the selected logistics
companies’ performance in financial position, market growth, and market share in industry
was discussed. The purpose of this research was to find out the competitive position in the
logistics market in India by using BCG matrix and GE matrix.
In this research, the author considered the political, economical, socio-demographical and
technological changes that can influence the company and its industry.
Finally the industry analysis finds out how to attain competitive position in the market
and what are the strategic decisions to be taken for improving in this industry.
REFERENCE WEBSITES
• http://www.transportintelligence.com/assets/files/
Global_Transport_and_Logistics_Financial_Ratio_Analysis_2012_Brochure.pdf
• http://www.gati.com/html/investors-desk_financial-reports_annual-report.html
• http://www.allcargologistics.com/investor-relations/overview.aspx
• http://english.eazel.com/lv/software/download/kl670736.htm
• https://docs.google.com/viewer?a=v&q=cache:WpcaszttO0AJ:www.researchersworld.com/
vol2/issue2/
Paper_16.pdf+various+companies+capital+structure&hl=en&gl=in&pid
=bl&srcid=ADGEESiq4wBaUEzYk6fgYddtVoSwOfz3yb_MYjrB_YW-
a02TpOdTZ_7iwr10MmX5qYp8uvrso28iTucxnauYQv4msB67NnN8Ucu8EHSk0KEHIMSP81gEuMk
Kmevdb_xW8NG7DheowiQf&sig=AHIEtbSSSxGb2Tqi5krf-7oXDHnjrQoHgg
• http://www.scribd.com/doc/37138080/Capital-Structure-Analysis-of-Triveni
• http://www.ukessays.com/dissertation/literature-review/literature-review-on-capital-structure-
theory.php
• http://www.docstoc.com/docs/44243747/MBA-PROJECT-IN-CEMENT-INDUSTRY
• http://www.scribd.com/doc/54495972/Capital-Structure-Analysis-of-Indian-Automobile-
Industry
• http://www.managementparadise.com/buggu1/documents/1884/amul-bcg-matrix/
• http://siteresources.worldbank.org/TRADE/Resources/239070-1336654966193/
LPI_2012_rankings.pdf
• http://siteresources.worldbank.org/TRADE/Resources/239070-1336654966193/
LPI_2012_final.pdf
• http://siteresources.worldbank.org/TRADE/Resources/239070-1336654966193/
LPI_Survey_2011.pdf
• http://india.smetoolkit.org/india/en/file/content/43677/en/
Indian_Logistics_Industry_Snippet.pdf
• http://www.deloitte.com/assets/Dcom-India/Local%20Assets/Documents/Thoughtware/
Logistics%20Sector-Present%20situation%20and%20way%20forward.pdf
• http://www3.weforum.org/docs/
WEF_SCT_GAC_OutlookLogisticsSupplyChainIndustry_IndustryAgenda_2012.pdf
• http://www.softlinkglobal.com/resources/Expert%20Opinion/Amit_TTalkJan10.aspx?
Type=resources
• http://www.ilfsindia.com/downloads/bus_concept/Logistics.pdf
• http://research.fh-ooe.at/files/publications/912_Futurescenarios.pdf
• http://www.google.co.in/url?
sa=t&rct=j&q=&esrc=s&source=web&cd=1&sqi=2&ved=0CDAQFjAA&url=http%3A%2F%2Fwww
.iun.edu%2F~bnwcls%2Fj401%2Fbcg.doc&ei=m4xuUbekOcGNrgeMjoCYBg&usg=AFQjCNFk8xG7
G_D3T2PdpGq242Jr8Z-Zsw&sig2=G0c4ZhqHtBoLGZDB5n-sfw&bvm=bv.45368065,d.bmk
• https://docs.google.com/viewer?url=http://www.iseindia.com/ResearchPDF/
BCG_Matrix_SWOT_and_Porter_Model-April_2011.pdf
• http://www.google.co.in/url?
sa=t&rct=j&q=&esrc=s&source=web&cd=6&ved=0CEUQFjAF&url=http%
3A%2F%2Fwww.upb.pitt.edu%2FuploadedFiles%2FPeople_and_Offices
%2FOffices%2FRegistrar_and_Student_Accounts%2FMatrix%2520GE-4-
09%2520v2_5.10most%2520recent.docx&ei=gI5uUYWQE8THrQeSjoDYDA&usg=AFQjCNHePBf9
RHlPwtj62yE2SBhIcWMmfw&sig2=0PiYWfNwkuUnWgRg-E0D2w&bvm=bv.45368065,d.bmk
• http://www.quickmba.com/strategy/matrix/ge-mckinsey/
1. Balance Sheet of Container Corporation of India
------------------- in Rs. Cr. -------------------
Particulars Mar '08 Mar '09 Mar '10 Mar '11 Mar '12
Sources Of Funds
Total Share Capital 64.99 129.98 129.98 129.98 129.98
Equity Share Capital 64.99 129.98 129.98 129.98 129.98
Reserves 3,118.93 3,632.23 4,206.42 4,847.83 5,476.45
Networth 3,183.92 3,762.21 4,336.40 4,977.81 5,606.43
Total Liabilities 3,183.92 3,762.21 4,336.40 4,977.81 5,606.43
Mar '08 Mar '09 Mar '10 Mar '11 Mar '12
Application Of Funds
Gross Block 2,244.24 2,617.57 2,965.48 3,266.11 3,472.61
Less: Accum. Depreciation 579.09 691.98 825 959.13 1,078.86
Net Block 1,665.15 1,925.59 2,140.48 2,306.98 2,393.75
Capital Work in Progress 172.08 269.07 222.44 339.18 115.12
Investments 155.36 203.08 240.54 243.96 293.1
Inventories 4.81 5.08 6.99 6.26 8.17
Sundry Debtors 13.73 15.72 17.64 17.27 19.59
Cash and Bank Balance 64.47 58.77 49.44 56.34 2,761.50
Total Current Assets 83.01 79.57 74.07 79.87 2,789.26
Loans and Advances 373.07 403.94 571.56 561.77 906.35
Fixed Deposits 1,457.03 1,704.74 1,940.07 2,239.34 0
Total CA, Loans & Advances 1,913.11 2,188.25 2,585.70 2,880.98 3,695.61
Current Liabilities 599.05 684.24 707.79 639.22 714.37
Provisions 122.73 139.54 144.97 154.07 176.78
Total CL & Provisions 721.78 823.78 852.76 793.29 891.15
Net Current Assets 1,191.33 1,364.47 1,732.94 2,087.69 2,804.46
Total Assets 3,183.92 3,762.21 4,336.40 4,977.81 5,606.43
2. Profit & Loss account of Container Corporation of India
------------------- in Rs. Cr. -------------------
Mar '08 Mar '09 Mar '10 Mar '11 Mar '12
Income
Sales Turnover
3,347.3
0
3,417.1
6
3,705.6
8
3,828.1
2
4,060.9
5
Excise Duty 0 0 0 0 0
Net Sales
3,347.3
0
3,417.1
6
3,705.6
8
3,828.1
2
4,060.9
5
Other Income 158.72 203.57 164.07 173.45 316.54
Total Income
3,506.0
2
3,620.7
3
3,869.7
5
4,001.5
7
4,377.4
9
Expenditure
Raw Materials 1.71 2.14 2.29 2.67 5.04
Power & Fuel Cost 0 0 14.99 14.03 28.05
Employee Cost 54.82 80.39 83.61 86.9 99.91
Other Manuf.Expenses
2,294.1
2
2,254.0
0
2,506.3
2
2,598.3
2 78.86
Selling and Admin Expenses 62.42 95.96 94.7 75.43 0
Miscellaneous Expenses 43.5 53.55 41.8 48.08
2,825.3
6
Preoperative Exp Capitalised 0 0 0 0 0
Total Expenses
2,456.5
7
2,486.0
4
2,743.7
1
2,825.4
3
3,037.2
2
Mar '08 Mar '09 Mar '10 Mar '11 Mar '12
Operating Profit 890.73 931.12 961.97
1,002.6
9
1,023.7
3
PBDIT
1,049.4
5
1,134.6
9
1,126.0
4
1,176.1
4
1,340.2
7
Interest 0.24 0.06 0.09 0.3 0
PBDT
1,049.2
1
1,134.6
3
1,125.9
5
1,175.8
4
1,340.2
7
Depreciation 106.34 115.91 135.1 145.23 158.49
Other Written Off 0 0 0 0 0
Profit Before Tax 942.87
1,018.7
2 990.85
1,030.6
1
1,181.7
8
Extra-ordinary items 7.38 7.21 15.76 25.11 -52.16
PBT (Post Extra-ord Items) 950.25
1,025.9
3
1,006.6
1
1,055.7
2
1,129.6
2
Tax 197.98 234.73 219.92 179.77 251.74
Reported Net Profit 752.21 791.2 786.69 875.95 877.88
Total Value Addition
2,454.8
6
2,483.9
0
2,741.4
2
2,822.7
6
3,032.1
8
Equity Dividend 168.98 181.98 181.98 201.48 249.26
Corporate Dividend Tax 28.72 30.93 30.52 33.06 0
Per share data (annualised)
Shares in issue (lakhs) 649.91
1,299.8
3
1,299.8
3
1,299.8
3
1,299.8
3
Earning Per Share (Rs) 115.74 60.87 60.52 67.39 67.54
Equity Dividend (%) 260 140 140 155 165
Book Value (Rs) 489.9 289.44 333.61 382.96 431.32
3. Balance Sheet of Aqua Logistics
Particulars
------------------- in Rs. Cr. -------------------
2008 2009 2010 2011 2012
Sources Of Funds
Total Share Capital
11.4
6 12.92 20.54 30.00 30.00
Equity Share Capital
11.4
6 12.92 20.54 30.00 30.00
Share Application Money 0.00 0.00 0.00 0.00 0.00
Preference Share Capital 0.00 0.00 0.00 0.00 0.00
Reserves
28.4
8 44.52 206.47 493.61 491.56
Revaluation Reserves 0.00 0.00 0.00 0.00 0.00
Networth
39.9
4 57.44 227.01 523.61 521.56
Secured Loans 7.46 39.73 29.70 39.71 53.18
Unsecured Loans 0.70 0.06 0.01 30.37 31.23
Total Debt 8.16 39.79 29.71 70.08 84.41
Total Liabilities
48.1
0 97.23 256.72 593.69 605.97
2008 2009 2010 2011 2012
Application Of Funds
Gross Block 9.91 14.67 46.50 51.50 55.89
Less: Accum. Depreciation 0.78 1.92 3.41 7.14 10.96
Net Block 9.13 12.75 43.09 44.36 44.93
Capital Work in Progress 0.00 0.00 2.30 7.31 13.45
Investments 0.01 10.85 9.89 45.61 54.41
Inventories 0.00 0.00 0.00 0.00 0.00
Sundry Debtors
32.8
6 59.73 103.24 155.63 146.80
Cash and Bank Balance 8.19 1.04 5.46 2.28 94.37
Total Current Assets
41.0
5 60.77 108.70 157.91 241.17
Loans and Advances 7.40 15.59 33.82 65.35 280.62
Fixed Deposits 0.10 10.45 75.91 292.81 0.00
Total CA, Loans & Advances
48.5
5 86.81 218.43 516.07 521.79
Deffered Credit 0.00 0.00 0.00 0.00 0.00
Current Liabilities 9.22 10.48 16.26 20.23 25.33
Provisions 0.37 4.11 4.67 3.43 3.27
Total CL & Provisions 9.59 14.59 20.93 23.66 28.60
Net Current Assets
38.9
6 72.22 197.50 492.41 493.19
Miscellaneous Expenses 0.00 1.42 3.94 4.00 0.00
Total Assets
48.1
0 97.24 256.72 593.69 605.98
Contingent Liabilities 0.00 10.82 1.85 16.69 2.91
Book Value (Rs)
34.8
4 44.45 110.51 17.45 17.39
4. Profit & Loss account of Aqua Logistics
Particulars
------------------- in Rs. Cr. -------------------
2008 2009 2010 2011 2012
Income
Sales Turnover 108.99 213.4 322.01 380.88 310.35
Excise Duty 0 0 0 0 0
Net Sales 108.99 213.4 322.01 380.88 310.35
Other Income 0.42 0.65 -0.11 0.85 1.58
Stock Adjustments 0 0 0 0 0
Total Income 109.41 214.05 321.9 381.73 311.93
Expenditure
Raw Materials 0 0 0 0 0
Power & Fuel Cost 0 0 0 0 0
Employee Cost 7.63 10.58 10.92 8.33 6.19
Other Manufacturing Expenses 84.31 175.49 272.42 326.79 282.43
Selling and Admin Expenses 3.44 3.79 4.47 8.71 0
Miscellaneous Expenses 0.84 1.19 1.29 1.29 5.95
Preoperative Exp Capitalised 0 0 0 0 0
Total Expenses 96.22 191.05 289.1 345.12 294.57
Mar'08 Mar'09 Mar'10 Mar '11 Mar '12
Operating Profit 12.77 22.35 32.91 35.76 15.78
PBDIT 13.19 23 32.8 36.61 17.36
Interest 3.82 4.75 5.17 7.25 11.78
PBDT 9.37 18.25 27.63 29.36 5.58
Depreciation 0.57 1.14 1.49 3.88 3.87
Other Written Off 0 0 0 0 0
Profit Before Tax 8.8 17.11 26.14 25.48 1.71
Extra-ordinary items 0 0 0 -0.48 0
PBT (Post Extra-ord Items) 8.8 17.11 26.14 25 1.71
Tax 3.18 5.97 5.6 2.62 0.55
Reported Net Profit 5.61 11.15 20.54 22.39 1.15
Total Value Addition 96.22 191.05 289.1 345.12 294.57
Equity Dividend 0 0 0 0 0
Corporate Dividend Tax 0 0 0 0 0
Per share data (annualised)
Shares in issue (lakhs) 114.64 129.24 205.41
2,999.9
1
2,999.9
1
Earning Per Share (Rs) 4.9 8.63 10 0.75 0.04
Equity Dividend (%) 0 0 0 0 0
Book Value (Rs) 34.84 44.45 110.51 17.45 17.39
5. Key Financial Ratios of Aqua Logistics:
2008 2009 2010 2011 2012
Investment Valuation Ratios
Face Value 10 10 10 1 1
Operating Profit Per Share (Rs) 11.13 17.29 16.02 1.19 0.53
Net Operating Profit Per Share (Rs) 95.07 165.12 156.76 12.7 10.35
Free Reserves Per Share (Rs) 24.84 33.36 98.6 16.31 --
Bonus in Equity Capital -- 15.47 9.73 6.66 6.66
Profitability Ratios
Operating Profit Margin(%) 11.7 10.47 10.21 9.38 5.08
Profit Before Interest And Tax Margin(%) 11.17 9.93 9.74 8.34 3.8
Gross Profit Margin(%) 11.19 9.93 9.75 8.36 3.83
Cash Profit Margin(%) 5.41 5.52 6.98 7.1 1.94
Adjusted Cash Margin(%) 5.41 5.52 6.98 7.1 1.94
Net Profit Margin(%) 5.14 5.22 6.37 5.85 0.36
Adjusted Net Profit Margin(%) 5.14 5.22 6.37 5.85 0.36
Return On Capital Employed(%) 25.66 21.98 12.38 5.58 2.4
Return On Net Worth(%) 14.05 19.89 9.2 4.3 0.22
Adjusted Return on Net Worth(%) 13.37 19.03 9.42 4.48 0.42
Return on Assets Excluding Revaluations 34.84 43.36 108.6 17.32 17.39
Return on Assets Including Revaluations 34.84 43.36 108.6 17.32 17.39
Return on Long Term Funds(%) 25.66 21.98 13.98 5.9 2.77
Liquidity And Solvency Ratios
Current Ratio 5.06 5.95 2.75 5.89 3.26
Quick Ratio 5.06 5.95 10.44 21.81 18.24
Debt Equity Ratio 0.2 0.69 0.13 0.13 0.16
Long Term Debt Equity Ratio 0.2 0.69 -- 0.07 0.01
Debt Coverage Ratios
Interest Cover 6.34 5.47 6.8 4.91 1.23
Total Debt to Owners Fund 0.2 0.69 0.13 0.13 0.16
Financial Charges Coverage Ratio 3.38 4.74 6.44 5.11 1.56
Financial Charges Coverage Ratio Post Tax 2.62 3.59 5.26 4.62 1.43
Management Efficiency Ratios
Debtors Turnover Ratio 4.69 4.61 3.95 2.94 2.05
Asset Turnover Ratio 18.43 19.99 7.58 8.02 0.52
Number of Days In Working Capital 128.69 121.84 220.8 465.41 572.08
6.
Balance Sheet of Allcargo Logistics
------------------- in Rs. Cr. -------------------
Particulars
Dec '07 Dec '08 Dec '09 Dec '10 Mar '12
12 mths 12 mths 12 mths 12 mths 15 mths
Sources Of Funds
Total Share Capital 20.26 22.36 24.96 26.10 26.11
Equity Share Capital 20.26 22.36 24.96 26.10 26.11
Share Application Money 3.60 30.98 1.65 1.23 0.87
Preference Share Capital 0.00 0.00 0.00 0.00 0.00
Reserves 361.65 443.53 765.18 951.68 1113.16
Revaluation Reserves 0.00 0.00 0.00 0.00 0.00
Networth 385.51 496.87 791.79 979.01 1140.14
Secured Loans 24.38 105.28 109.30 247.25 495.91
Unsecured Loans 0.00 100.97 0.00 0.00 62.84
Total Debt 24.38 206.25 109.30 247.25 558.75
Total Liabilities 409.89 703.12 901.09
1226.2
6 1698.89
Particulars Dec '07 Dec '08 Dec '09 Dec '10 Mar '12
Application Of Funds
Gross Block 248.62 377.66 508.97 776.14 1194.27
Less: Accum. Depreciation 38.54 62.50 98.72 134.07 213.06
Net Block 210.08 315.16 410.25 642.07 981.21
Capital Work in Progress 40.52 59.45 61.75 45.79 47.44
Investments 114.06 115.22 200.34 179.07 380.64
Inventories 1.47 1.96 2.71 6.33 11.04
Sundry Debtors 45.63 71.33 72.86 93.55 129.33
Cash and Bank Balance 9.20 29.25 16.79 11.42 6.51
Total Current Assets 56.30 102.54 92.36 111.30 146.88
Loans and Advances 40.90 198.81 248.15 463.66 410.06
Fixed Deposits 5.50 3.35 3.56 2.09 0.00
Total CA, Loans & Advances 102.70 304.70 344.07 577.05 556.94
Deffered Credit 0.00 0.00 0.00 0.00 0.00
Current Liabilities 48.94 83.54 106.83 177.16 246.22
Provisions 8.62 7.90 8.50 40.55 21.13
Total CL & Provisions 57.56 91.44 115.33 217.71 267.35
Net Current Assets 45.14 213.26 228.74 359.34 289.59
Miscellaneous Expenses 0.09 0.05 0.00 0.00 0.00
Total Assets 409.89 703.14 901.08
1226.2
7 1698.88
Contingent Liabilities 18.52 15.93 76.84 69.61 328.89
Book Value (Rs) 188.54 208.33 63.31 74.92 87.27
7. Profit & Loss account of Allcargo Logistics
------------------- in Rs. Cr. -------------------
Particulars
Dec '07 Dec '08 Dec '09 Dec '10 Mar '12
12 mths 12 mths 12 mths 12 mths 15 mths
Income
Sales Turnover 361.25 516.79 516.76 699.84
1,079.4
3
Excise Duty 0 0 0 0 0
Net Sales 361.25 516.79 516.76 699.84
1,079.4
3
Other Income 4.02 20.03 15.34 42.93 51.06
Total Income 365.27 536.82 532.1 742.77
1,130.4
9
Expenditure
Raw Materials 2.31 3.25 4.6 13.1 21.43
Power & Fuel Cost 1.66 1.44 2.41 23.88 40.63
Employee Cost 23.11 34.18 35.84 48.58 80.67
Other Manufacturing Expenses 223.18 300.53 287.11 352.58 535.57
Selling and Admin Expenses 22.22 30.62 29.45 63.95 0
Miscellaneous Expenses 9.05 14.11 12.66 15.31 92.11
Total Expenses 281.53 384.13 372.07 517.4 770.41
Particulars
Dec '07 Dec '08 Dec '09 Dec '10 Mar '12
12 mths 12 mths 12 mths 12 mths 15 mths
Operating Profit 79.72 132.66 144.69 182.44 309.02
PBDIT 83.74 152.69 160.03 225.37 360.08
Interest 2.54 18.07 16.13 27.87 50.55
PBDT 81.2 134.62 143.9 197.5 309.53
Depreciation 14.2 25.47 37.63 40.24 89.04
Other Written Off 0.04 0.04 0.08 0 0
Profit Before Tax 66.96 109.11 106.19 157.26 220.49
Extra-ordinary items 3.33 -0.01 0.23 0 0
PBT (Post Extra-ord Items) 70.29 109.1 106.42 157.26 220.49
Tax 10.52 16.42 8.44 23.74 36.42
Reported Net Profit 59.78 92.67 97.81 121.13 184.07
Total Value Addition 279.22 380.89 367.46 504.32 748.98
Equity Dividend 10.76 5.59 12.48 39.44 19.58
Corporate Dividend Tax 1.83 0.95 2.12 6.43 3.18
Per share data (annualised)
Shares in issue (lakhs) 202.56 223.64
1,248.1
1
1,305.1
7
1,305.4
7
Earnings Per Share (Rs) 29.51 41.44 7.84 9.28 14.1
Equity Dividend (%) 50 25 50 150 75
8. Balance Sheet of Aegis Logistics
Particulars
------------------- in Rs. Cr. -------------------
2008 2009 2010 2011 2012
Sources Of Funds
Total Share Capital 19.91 16.44 18.77 33.40 33.40
Equity Share Capital 19.91 16.44 18.77 33.40 33.40
Share Application Money 0.00 3.35 0.00 0.00 0.00
Preference Share Capital 0.00 0.00 0.00 0.00 0.00
Reserves 137.64 154.91 167.47 230.93 264.23
Networth 157.55 174.70 186.24 264.33 297.63
Secured Loans 34.81 25.21 69.00 57.23 77.64
Unsecured Loans 4.55 4.73 7.38 6.62 1.70
Total Debt 39.36 29.94 76.38 63.85 79.34
Total Liabilities 196.91 204.64 262.62 328.18 376.97
2008 2009 2010 2011 2012
Application Of Funds
Gross Block 205.02 208.99 220.44 240.83 245.83
Less: Accum. Depreciation 79.62 88.79 98.12 108.63 118.16
Net Block 125.40 120.20 122.32 132.20 127.67
Capital Work in Progress 0.99 6.57 12.84 1.15 15.69
Investments 21.23 53.59 42.42 94.53 120.27
Inventories 11.63 4.95 9.34 8.79 8.23
Sundry Debtors 38.76 21.63 20.51 20.76 31.41
Cash and Bank Balance 2.68 3.34 11.27 12.95 10.76
Total Current Assets 53.07 29.92 41.12 42.50 50.40
Loans and Advances 51.30 46.17 89.78 64.04 81.14
Fixed Deposits 19.72 28.44 16.65 57.36 62.99
Total CA, Loans & Advances 124.09 104.53 147.55 163.90 194.53
Deffered Credit 0.00 0.00 0.00 0.00 0.00
Current Liabilities 68.85 68.57 54.21 53.94 68.21
Provisions 5.96 11.67 8.30 9.65 12.99
Total CL & Provisions 74.81 80.24 62.51 63.59 81.20
Net Current Assets 49.28 24.29 85.04 100.31 113.33
Miscellaneous Expenses 0.00 0.00 0.00 0.00 0.00
Total Assets 196.90 204.65 262.62 328.19 376.96
9. Profit & Loss account of Aegis Logistics
Particulars ------------------- in Rs. Cr. -------------------
2008 2009 2010 2011 2012
Income
Sales Turnover 373.88 368.33 284.67 258.14 283.5
Excise Duty 0 0 0 0 0
Net Sales 373.88 368.33 284.67 258.14 283.5
Other Income 1.92 5.14 8.8 7.92 7.83
Stock Adjustments 0 -6.66 4.9 -2.6 -0.29
Total Income 375.8 366.81 298.37 263.46 291.04
Expenditure
Raw Materials 268.96 270.22 175.69 144.47 160.06
Power & Fuel Cost 4.27 4.52 4.05 5.03 5.41
Employee Cost 13.55 16.72 21.14 22.38 25.58
Other Manufacturing Expenses 5.75 6.7 9.89 5.81 6.44
Selling and Admin Expenses 18.34 14.72 18.42 18.06 18.53
Miscellaneous Expenses 1.74 1.7 2.04 2.47 4.83
Preoperative Exp Capitalised 0 0 0 0 0
Total Expenses 312.61 314.58 231.23 198.22 220.85
2008 2009 2010 2011 2012
Operating Profit 61.27 47.09 58.34 57.32 62.36
PBDIT 63.19 52.23 67.14 65.24 70.19
Interest 4.12 6.18 8.04 10.15 10.31
PBDT 59.07 46.05 59.1 55.09 59.88
Depreciation 8.96 9.17 9.67 10.74 11.36
Other Written Off 0 0 0 0 0.57
Profit Before Tax 50.11 36.88 49.43 44.35 47.95
Extra-ordinary items 0.37 -0.24 0.06 0.82 10.07
PBT (Post Extra-ord Items) 50.48 36.64 49.49 45.17 58.02
Tax 11.38 6.27 10.53 13.96 16.95
Reported Net Profit 39.09 30.37 38.94 31.22 41.06
Total Value Addition 43.66 44.37 55.55 53.75 60.79
Preference Dividend 0 0 0 0 0
Equity Dividend 8.96 9.3 10.81 12.94 6.68
Corporate Dividend Tax 1.52 1.76 1.84 2.12 1.08
Per share data (annualised)
Shares in issue (lakhs) 199.41 164.77 188.03 334 334
Earning Per Share (Rs) 19.61 18.43 20.71 9.35 12.29
Equity Dividend (%) 25 45 57.5 40 20
Book Value (Rs) 79.01 103.99 99.05 79.14 89.11
10. Key Financial Ratios of Aegis Logistics
Particulars 2008 2009 2010 2011 2012
Investment Valuation Ratios
Face Value 10 10 10 10 10
Dividend Per Share 2.5 4.5 5.75 4 2
Operating Profit Per Share (Rs) 30.72 28.57 31.02 17.16 18.67
Net Operating Profit Per Share (Rs) 187.5 223.53 151.4 77.29 84.88
Free Reserves Per Share (Rs) 65.21 91.5 85.36 67.09 76.31
Bonus in Equity Capital 4.11 4.98 4.36 39.89 39.89
Profitability Ratios
Operating Profit Margin(%) 16.38 12.78 20.49 22.2 21.99
Profit Before Interest And Tax Margin(%) 13.9 10.1 16.73 17.51 17.34
Gross Profit Margin(%) 13.98 10.29 17.09 18.04 17.99
Cash Profit Margin(%) 12.76 11.09 15.79 15.43 15.5
Adjusted Cash Margin(%) 12.76 11.09 15.79 15.43 15.5
Net Profit Margin(%) 10.39 8.09 13.38 11.73 13.96
Adjusted Net Profit Margin(%) 10.39 8.09 13.38 11.73 13.96
Return On Capital Employed(%) 27.7 21.94 20.88 16.58 16.15
Return On Net Worth(%) 24.81 17.72 20.9 11.8 13.79
Adjusted Return on Net Worth(%) 24.78 18.95 19.47 11.47 11.3
Return on Assets Excluding Revaluations 79.01 103.99 99.05 79.14 89.11
Return on Assets Including Revaluations 79.01 103.99 99.05 79.14 89.11
Return on Long Term Funds(%) 27.7 22.31 22.14 17.29 18.06
Liquidity And Solvency Ratios
Current Ratio 1.66 1.3 1.59 1.81 1.21
Quick Ratio 1.5 1.22 2.18 2.41 2.28
Debt Equity Ratio 0.25 0.17 0.41 0.24 0.27
Long Term Debt Equity Ratio 0.25 0.17 0.33 0.19 0.13
Debt Coverage Ratios
Interest Cover 30.99 9.35 13.04 8.6 8.41
Total Debt to Owners Fund 0.25 0.17 0.41 0.24 0.27
Financial Charges Coverage Ratio 15.41 8.76 8.02 6.42 7.07
Financial Charges Coverage Ratio Post Tax 12.66 7.4 7.05 5.13 6.14
Management Efficiency Ratios
Inventory Turnover Ratio 41.06 150.53 38.76 54.37 63.59
Debtors Turnover Ratio 11.76 12.2 13.51 12.51 10.87
Investments Turnover Ratio 41.06 150.53 38.76 54.37 63.59
Fixed Assets Turnover Ratio 1.83 1.77 1.29 1.09 1.17
Total Assets Turnover Ratio 1.9 1.8 1.09 0.8 0.76
Asset Turnover Ratio 1.83 1.83 1.22 0.87 0.8
Average Finished Goods Held 10.25 2.66 10.91 7.88 6.74
Number of Days In Working Capital 47.46 23.73 107.55 139.88 143.92
Profit & Loss Account Ratios
Material Cost Composition 71.93 73.36 61.71 55.96 56.45
Selling Distribution Cost Composition 1.67 1.39 1.8 1.88 1.9
Expenses as Composition of Total Sales 0.3 0.28 0.31 0.6 0.46
Cash Flow Indicator Ratios
Dividend Payout Ratio Net Profit 26.81 36.41 32.46 48.24 18.9
Dividend Payout Ratio Cash Profit 21.81 27.96 26 35.89 14.65
Earning Retention Ratio 73.16 65.95 65.15 50.36 76.93
Cash Earning Retention Ratio 78.17 73.45 72.49 63.34 82.97
AdjustedCash Flow Times 0.82 0.72 1.66 1.55 1.74
11. Balance Sheet of Arshiya International
Particulars
------------------- in Rs. Cr. -------------------
2008 2009 2010 2011 2012
Sources Of Funds
Total Share Capital 11.4 11.75 11.75 11.77 11.77
Equity Share Capital 11.4 11.75 11.75 11.77 11.77
Share Application Money 2.34 2.99 1.18 0.5 0
Reserves 445.23 475.36 483.91 502.62 540.81
Networth 458.97 490.1 496.84 514.89 552.58
Secured Loans 0.33 78.99 306.41 655.65 1,006.53
Total Debt 0.33 78.99 359.41 679.65 1,139.03
Total Liabilities 459.3 569.09 856.25 1,194.54 1,691.61
Particulars 2008 2009 2010 2011 2012
Application Of Funds
Gross Block 4.89 12.65 23.37 343.18 626.77
Less: Accum. Depreciation 1.48 3 5.78 12.32 24.42
Net Block 3.41 9.65 17.59 330.86 602.35
Capital Work in Progress 194.02 344.63 605.81 490.13 525.21
Inventories 0 0 0 0 0
Sundry Debtors 33.81 57.45 91.45 95.12 121.13
Cash and Bank Balance 26.89 22.01 33.33 55.97 25.82
Total Current Assets 60.7 79.46 124.78 151.09 146.95
Loans and Advances 22.25 77.64 193.82 348.62 645.52
Fixed Deposits 54.28 5.96 9.98 13.52 0
Total CA, Loans & Advances 137.23 163.06 328.58 513.23 792.47
Current Liabilities 15.55 53.33 201.07 269.2 379.29
Provisions 5.68 7.6 8.48 9.97 13
Total CL & Provisions 21.23 60.93 209.55 279.17 392.29
Net Current Assets 116 102.13 119.03 234.06 400.18
Total Assets 459.32 569.09 856.26 1,194.54 1,691.61
12. Profit & Loss account of Arshiya International
Particulars
------------------- in Rs. Cr. -------------------
2008 2009 2010 2011 2012
Income
Sales Turnover 201.91 256.39 273.61 453.01 592.63
Excise Duty 0 0 0 0 0
Net Sales 201.91 256.39 273.61 453.01 592.63
Other Income 5.35 9.82 6.42 21.74 37.38
Stock Adjustments 0 0 0 0 0
Total Income 207.26 266.21 280.03 474.75 630.01
Expenditure
Employee Cost 5.84 7.85 15.79 24.26 36.63
Other Manufacturing Expenses 173.35 214.83 222.91 348.7 386.8
Selling and Admin Expenses 6.24 8.59 9.14 20.19 0
Miscellaneous Expenses 2.45 4.42 3.61 6.73 40.55
Preoperative Exp Capitalised 0 0 0 0 0
Total Expenses 187.88 235.69 251.45 399.88 463.98
2008 2009 2010 2011 2012
Operating Profit 14.03 20.7 22.16 53.13 128.65
PBDIT 19.38 30.52 28.58 74.87 166.03
Interest 0.72 0.82 4.52 31.56 80.41
PBDT 18.66 29.7 24.06 43.31 85.62
Depreciation 0.64 1.56 1.8 6.96 16.43
Other Written Off 0 0 0 0 0
Profit Before Tax 18.02 28.14 22.26 36.35 69.19
Extra-ordinary items -0.19 0.14 0.84 0.1 0
PBT (Post Extra-ord Items) 17.83 28.28 23.1 36.45 69.19
Tax 5.46 9.79 7.71 11.52 21.68
Reported Net Profit 12.36 18.49 15.4 24.93 47.51
Total Value Addition 187.88 235.69 251.45 399.88 463.98
Equity Dividend 4.56 4.7 5.88 7.06 8.24
Corporate Dividend Tax 0.78 0.8 0.98 1.15 1.34
Per share data (annualised)
Shares in issue (lakhs) 570.04 587.53 587.53 588.29 588.29
Earning Per Share (Rs) 2.17 3.15 2.62 4.24 8.08
Equity Dividend (%) 40 40 50 60 70
Book Value (Rs) 80.11 82.91 84.36 87.44 93.93

Logisitics, industry analysis,

  • 1.
    Abstract Logistics services marketIndia is on a growth trajectory owing to rapid globalization and 100% FDI allowance. Logistics services broadly encompass courier services, freight forwarding, third party logistics and reverse logistics. Growth in international trade is providing huge impetus to the demand for the logistics services. Growing competition in retail sector transcends need of reverse logistics to handle returns and store up gradation. Third party logistics providers need to customize their services and charge competitive rates to benefit from retail boom in India. The report begins with an introduction section, classifying the logistics sector into transportation, storage and logistics services, Government Initiatives and regulations, future prospective of the industry. The next section briefly illustrates the evolution of the logistics industry in India, literature review reports. Market overview section provides a brief snapshot of the logistics services market in India. To begin with, the share of logistics services in overall logistics market is shown, followed by the market size and growth in logistics services market in India. Company profile section briefly explains about the top five companies in logistics industry in India namely Container Corporation of India, Arshiya international, Aegis logistics, Aqua logistics, Allcargo logistics SWOT analysis of each company. SWOT analysis helps to find out the weak points of the companies and to find out the way to overcome this problem. The Competitive Landscape section profiles the major players in logistics services market in India in details within the report which enables readers to get a clear picture of the current competitive scenario. The section lists the basic details of the players such as corporate information, business highlights and key members. The section also features financial analysis of key vendors which in turn provides us with the financial health of players. GE matrix used for analyzing the market attractiveness and business strategic Unit. In which to give strategic decisions for attains the market position. The report concludes with a strategic recommendations section that provides suggestions and strategies for the existing and new players in the logistics services market in India.
  • 2.
    ACKNOWLEDGEMENT In a specialway, I submit my whole hearted thanks to my parents for their continuous motivation and the trust on me. It is my pleasure to reveal my thanks to all my friends who offered me a great support for collecting the data from the respondents. I am extremely thankful and indebted to Dr. S.SARAVANASANKER, VICE-CHANCELLOR, KALASALINGAM UNIVERSITY who has given me the prestigious opportunity to do my project successfully. I am extremely thankful and indebted to Dr. M.SATHIVEL RANI MBA, PH.D. HEAD OF THE DEPARTMENT, BUSINESS ADMINISTRATION, KALASALINGAM UNIVERSITY who has given me the prestigious opportunity to do my project successfully. I acknowledge with a sense of gratitude of sincere thanks to my Project Guide Ms .M.SELVARANI, Assistant professor of the Department of Business Administration, Kalasalingam University who provided a great Opportunity for doing this project. Who enlightened me ‘What research is & how it can be performed’, His active motivation provided me an invaluable guidance & Encouragement towards Research that made me to perform this project. I hearty thank Mr. SETHURAMAN “AKARA RESEARCH & TECHNOLOGY CHENNAI” for showing tremendous patience and giving full freedom in guiding me towards the successful completion of my project. In a special way, I submit my grateful thanks to my parents who provided me all the supports throughout the period of project development. I also render my deep thanks to my friends and well wishers who had been a source of encouragement throughout the period of training.
  • 3.
    Last but notleast my prayers and thanks to the “almighty” without whom the work would not have materialized. I also extend my thanks to all the other faculty members for extending their helping hands to complete this project effectively. Finally, I would like to profoundly thank all the respondents who helped me in collecting the necessary information for completing this project. Mr.T.AMULRAJ
  • 4.
    CHAPTER-I 1. LOGISTICS INDUSTRYIN INDIA 1.1.1 INTRODUCTION India has become the prime destination for logistics service providers all over the world. The demand for logistics services in India has been largely driven by the remarkable growth of the economy. The growth is being projected at 9-10 per cent in next few years, with the CAGR (compounded annual growth rate) expected to grow at a rate of 7-8 per cent. This growth is expected to gain greater momentum due to the exponential growth of the Indian economy. India is also experiencing a big retail boom as the buying capacity of the middle and upper middle segment of the population has scaled new heights. Many large multinationals from the retail industry are planning to set up operation in India and large local retailers are also planning to expand their operations. But with the infrastructure largely under-developed and incapable of catering to a growing economy, logistics management in India becomes too complex. The poor condition of infrastructure directly translates to higher turnover, pushing up the operating costs and reducing efficiency. There are other problems such as complex regulatory compliance and limited adoption and utilization of technology, which has resulted in increased paperwork and inability to communicate effectively with customers. In spite of dismal infrastructural scenario, the hopes of the logistics sector are kept up by the various upcoming infrastructural projects like logistics parks and hubs and other initiatives by public and private sector. The future of the logistics sector depends not only on the continued development of infrastructure but also on the capability of the service providers in adapting themselves and making optimal utilization of technology. India is emerging as one of the world’s leading consumer market with the raise of middle income group. Estimated at US$991 billion in 2020, Total consumption expenditure is expected to grow to nearly US$ 3.6 trillion in 2020. Food, housing & consumer durable and transport & communication are expected to be the top 3 categories, accounting for 65% of consumption in 2020. The FMCG sector alone is expected to grow at a base rate of 12 % annually to become an INR 4000 billion industry by 2020. The logistics sector is expected to play an important role in
  • 5.
    accessing this emergingmarket and enabling this growth. 1.1.2 INDUSTRY TRENDS Transportation: Container cargo represents only about 30% (by value) of India's external trade- much lower when compared with the global containerized cargo average of 70-75%. At a growth rate of 12%, India's container cargo traffic is estimated to reach 15 million TEUs by FY16E from about 7.5 million TEUs now (at 12 major ports). In comparison, China has created capacity at its ports to handle more than 100 million TEUs a year. Out of the 15 mn TEUs of total container traffic, we estimate Exim rail container traffic to be 5 mn TEUs by FY16E. This would be a huge opportunity and will significantly benefit container rail operators. Rising investment in the rail and port spaces also fuels growth in allied industries like wagon manufacturing, port handling equipment, railway electrification systems and construction companies. To reduce the transportation cost and for quicker movement of cargo Multimodal transport operation is introduced (MTO). MTO helps exporters with less documentation for instance single document for all modes of transport. Third Party Logistics (3PL): Outsourcing is everywhere. Logistics industry is no exception. Logistics services like transportation, warehousing, cross docking, Inventory management, packaging and freight forwarding all are part of third party logistic services. Companies in India currently outsource an estimated of 52% of logistics. And 3PL industry is estimated to be US$ 1.5bn in FY14. 3PL represents only 1% of logistics cost emphasis its significance in the industry. Future is no doubt lying in outsourcing. As the growth in the 3PL market is expected to be in the range of 25-30% CAGR over FY11-14E. As of now, the 3PL activity is limited to only few industries like automotive, IT hardware, telecom and infrastructure equipment. The organised 3PL market in India can be categorised into three major segments – public sector, private sector and foreign entrants. Some of the major players in each category are: TVS logistics, DIESL (TATA), Panalpina, TCI, Gati, Allcargo, V Trans, Total, VRL and Reliance etc.
  • 6.
    Private Participation: Theindustry is becoming more competent with the entry of global giants like Gazeley Broekmen (Wal-Mart's logistics partner), CH Robinson and Kerry logistics and large Indian corporate houses like Tata, Reliance and Bharti group. A series of mergers and acquisition like DHL acquired Blue Dart, TNT acquired Speedage Express Cargo Service and Fedex bought over Pafex, are also leading to consolidation industry at various levels and segments. Many of these companies are planning to broaden their areas of operation and are also planning to develop their own logistic parks across the country. If the trend continues as per the estimates, the market share of the organized logistics players is expected to double from 6% in 2013 to approx. 12% by 2020. Express logistics: Organised players have monopoly over the express logistics industry. 65% of express business is in the hands of organized players, while semi-organised and unorganised players accounts for 25% and the remaining 10% of the market by EMS Speed Post. But altogether different picture can be witnessed in the domestic segment. In domestic front, unorganised players hold 41% of the market share based on price advantage. While organised players accounts for 45% and EMS Speed Post the remaining 14%. Warehouses: Recently, warehouses have become key growth drivers in the logistics industry. Apart from conventional storing services, warehouses now providing value-added services like consolidation and breaking up of cargo, packaging, labelling, bar coding and reverse logistics etc. warehousing and related activities account for approx. 20% of the total logistics industry. Most of the warehousing space in India lies with unorganised players in domestic front, which is causing wide supply and demand gap in storage space. According to KPMG, an additional 120million square feet of warehousing space is needed by 2013 to bridge this gap. Currently, the organised warehousing industry in India has a capacity of approx. 80million metric tonnes and is growing at 35 to 40 per cent per annum. An investment of approximately US$ 500million is being planned by various logistics companies for the development of about 45million square feet of warehouse space by 2013.Many players in this segment such as Multi Modal Logistics Park, Mega Food Parks and Free Trade Warehousing Zones have planned next generation storage models.
  • 7.
    Logistic parks: About110 logistics parks spread over approximately 3,500 acres at an estimated cost of $1 bn are expected to be operational and an estimated 45 mn ft2 of warehousing space with an investment of $ 500 mn is expected to be developed by various logistics companies by 2020. Majority of these logistics parks are planned in close proximity to state capitals. However, availability of large land parcels at relatively low cost, connectivity to multiple markets across states and industrial clusters has led to the emergence of some tier-2 and tier-3 cities as favoured destinations for the development of logistics parks and warehouses. 1.1.3 Government Initiatives and regulations Initiatives: To emphasis the significance of transportation in logistics industry and to increase the competence in the sector government introduced private participation, especially in port sector. The major initiative in transport infrastructure is introduction of National Maritime Development Program (NMDP) with an investment of Rs 568bn. NMDP would be addressing the challenges of the growing international traffic demand of the country along with developing the port facilities at par with world standards. While liberalizing the railway services, government opened the doors of container business to the private parties. A total of 15 players immediately entered the market. FDI regulations • In general 100% FDI under the automatic route is permitted for all logistic services • FDI up to 100% subject to FIPB approval is permitted for courier services. • FDI up to 49% under the automatic route is permitted for air transport services, including air cargo services. • 100% FDI is permitted in Ports and Harbours under automatic route • 100% FDI is permitted under the automatic route for storage and warehousing including warehousing of agricultural products with cold storage.
  • 8.
    • 100% FDIis permitted in transport and transport support services through automatic route. 1.1.4 Indian Logistics Industry- Future Trends There have been several key indicators to the future trend in the Indian logistics sector. The demand for logistics services has been largely driven by the remarkable growth of the Indian economy. Logistics spend in India is estimated to be around 13% of the GDP, which is comparatively higher than other developed countries. The air transport sector’s contribution has been around 0.2 per cent of the country’s GDP, while the transport sector’s contribution to the GDP has been growing over the last couple of years. India’s air cargo is predicted to grow at over CAGR of 11.5 per cent in the next few years. The contribution of the marine transport sector has also been around 0.2% to the country’s GDP. The sector’s contribution to the GDP has been increasing mostly because of the growing economic developments in the country. The role of the shipping industry in the growth of Indian economy has been very significant. Major ports in India together have handled around 500 million tonnes of cargo in the past two years and this figure is growing significantly. The Indian railways has realised the necessity to improve the infrastructure provide better service. The plan to develop Logistics Parks or hubs has the potential to streamline and optimize the supply chain and reduce the costs. Currently around 80% of the goods in India move by road, the railways has to essentially devise plans to divert this traffic to the rail. India’s logistics sector attracted huge investments, leaving behind some of the major sectors including aviation, metals, and consumer durables. The growths in the retail and manufacturing industry, commodity markets and development of SEZs have
  • 9.
    been key factorsin the growth of Indian logistics industry. Recent studies have indicated that the Indian logistics industry is expected to grow annually at the rate of 15 to 20%. A number of infrastructural projects involving warehouse and logistics parks are being undertaken are expected to be operational in the next 2-3 years. The setting up special economic zones (SEZs) has led to increased logistics activities around them. Several logistics parks have come up at locations like Mumbai, Kolkata, Chennai and Hyderabad because of their excellent port, rail, and road connectivity and are witnessing significant investment in infrastructure. Many of the large logistics players are in the process of setting up warehouses, container freight stations (CFS), inland container depots(ICD), logistics parks, distribution centers and other facilities to leverage the abundant opportunities. Increase in foreign trade is expected to further accelerate the demand for logistics services. The future of the Industry is very bright and is sure to witness exponential growth in the coming years. The increased participation of both public and private sector is crucial for developing logistics and improving supply chain management. Not only do the logistics companies need to create efficient business to thrive in the logistics sector, but they also need to explore ways for investing energy, costs and time to grow a strong logistics system
  • 10.
    1.2 OBJECTIVES • Toanalyze the company performance of selected logistics companies • To find the strength, weakness, opportunities, threads of the selected logistics companies and industry • To compare the financial performance of selected companies to decide its position in the industry • To study the company strength and attractive of the industry by using GE matrix. 1.3 SCOPE OF THE REPORT - The report covers the overview of Indian logistics industry, market size, cost components, overview of air transport system in India, - Air cargo traffic trends, growth drivers, demand- supply scenario, technology and innovation, and future outlook of the global as well as Indian air cargo industry. - In addition, the report also includes profiles of four major players in the sector. - Detailed analysis of Component & Cost structure of Global Logistics and Indian logistics market. This report talks about growth drivers and their effected factors. 1.4 PROBLEM OF THE STUDY 1. The problems of getting data on the market share and market rate. 2. This study takes only the domestic players in India. It ignores foreign players like DHL, UPS, TNT etc. 3. This study considers top five companies in India. 4. There is no clear definition of what constitutes a market. 5. A high market share need not necessarily lead to profitability all the time. 6. Low share businesses can be profitable too.
  • 11.
    Chapter- II 2. LiteratureSurvey 2.1.1 Logistics Logistics is the management of the flow of resources between the point of origin and the point of destination in order to meet some requirements, for example, of customers or corporations. The resources managed in logistics can Include physical items, such as food, materials, equipment, liquids, and staff, as well as abstract items, such as Information, particles, and energy. The logistics of physical items usually involves the integration of information flow, material handling, production, packaging, inventory, transportation, warehousing, and often security. The complexity of logistics can be modeled, analyzed, visualized, and optimized by dedicated simulation software. The minimization of the use of resources and time are common motives. 2.1.2 Origins and definition The term logistics comes from the late 19th century: from French logistique, from loger 'to lodge' Logistics is considered to have originated in the military's need to supply itself with arms, ammunition, and rations as it moved from a base to a forward position. In the ancient Greek, Roman, and Byzantine Empires, military officers with the title Logistikas were responsible for financial and supply distribution matters. The Oxford English Dictionary defines logistics as "the branch of military science relating to procuring, maintaining and transporting material, personnel and facilities." However, the New Oxford American Dictionary defines logistics as "the detailed coordination of a complex operation involving many people, facilities, or supplies", and the Oxford Dictionary online defines it as "the detailed organization and implementation of a complex operation". Another dictionary definition is "the time-related positioning of resources." As such, logistics is commonly seen as a branch of engineering that creates "people systems" rather than "machine systems". According to the Council of Logistics Management, logistics includes the integrated planning, control, realization, and monitoring of all internal and network-wide material, part, and
  • 12.
    product flow, includingthe necessary information flow, in industrial and trading companies along the complete value-added chain (and product life cycle) for the purpose of conforming to customer requirements. Logistics is the process of planning, implementing, and controlling the effective and efficient flow of goods and services from the point of origin to the point of consumption. Main logistics targets Logistics is one of the main functions within a company. The main targets of logistics can be divided into performance-related and cost-related targets. A few examples are high due date reliability, short delivery times, low inventory level, and high utilization of capacity. When decisions are made, there is a trade-off between targets. Logistics viewpoints Inbound logistics is one of the primary processes of logistics, concentrating on purchasing and arranging the inbound movement of materials, parts, and/or finished inventory from suppliers to manufacturing or assembly plants, warehouses, or retail stores. Outbound logistics is the process related to the storage and movement of the final product and the related information flows from the end of the production line to the end user. Logistics fields Given the services performed by logisticians, the main fields of logistics can be broken down as follows: • Procurement logistics • Production logistics • Distribution logistics • After sales logistics • Disposal logistics • Reverse logistics • Global logistics • Domestics logistics
  • 13.
    Procurement logistics consistsof activities such as market research, requirements planning, make-or-buy decisions, supplier management, ordering, and order controlling. The targets in procurement logistics might be contradictory: maximizing efficiency by concentrating on core competences, outsourcing while maintaining the autonomy of the company, or minimizing procurement costs while maximizing security within the supply process. Production logistics connects procurement to distribution logistics. Its main function is to use available production capacities to produce the products needed in distribution logistics. Production logistics activities are related to organizational concepts, layout planning, production planning, and control. Distribution logistics has, as main tasks, the delivery of the finished products to the customer. It consists of order processing, warehousing, and transportation. Distribution logistics is necessary because the time, place, and quantity of production differs with the time, place, and quantity of consumption. Disposal logistics has as its main function to reduce logistics cost(s) and enhance service(s) related to the disposal of waste produced during the operation of a business. Reverse logistics denotes all those operations related to the reuse of products and materials. The reverse logistics process includes the management and the sale of surpluses, as well as products being returned to vendors from buyers. Business logistics One definition of business logistics speaks of "having the right item in the right quantity at the right time at the right place for the right price in the right condition to the right customer". As the science of process, business logistics incorporates all industry sectors. Logistics work aims to manage the fruition of project life cycles, supply chains, and resultant efficiencies. Logistics as a business concept evolved in the 1950s due to the increasing complexity of
  • 14.
    supplying businesses withmaterials and shipping out products in an increasingly globalized supply chain, leading to a call for experts called "supply chain logisticians". In business, logistics may have either an internal focus (inbound logistics) or an external focus (outbound logistics), covering the flow and storage of materials from point of origin to point of consumption (see supply-chain management). The main functions of a qualified logistician include inventory management, purchasing, transportation, warehousing, consultation, and the organizing and planning of these activities. Logisticians combine a professional knowledge of each of these functions to coordinate resources in an organization. There are two fundamentally different forms of logistics: one optimizes a steady flow of material through a network of transport links and storage nodes, while the other coordinates a sequence of resources to carry out some project. Production logistics The term production logistics describes logistic processes within an industry. Production logistics aims to ensure that each machine and workstation receives the right product in the right quantity and quality at the right time. The concern is not the transportation itself, but to streamline and control the flow through value-adding processes and to eliminate non–value- adding processes. Production logistics can operate in existing as well as new plants. Manufacturing in an existing plant is a constantly changing process. Machines are exchanged and new ones added, which gives the opportunity to improve the production logistics system accordingly. Production logistics provides the means to achieve customer response and capital efficiency. Production logistics becomes more important with decreasing batch sizes. In many industries (e.g., mobile phones), the short-term goal is a batch size of one, allowing even a single customer's demand to be fulfilled efficiently. Track and tracing, which is an essential part of production logistics due to product safety and reliability issues, is also gaining importance, especially in the automotive and medical industries.
  • 15.
    2.2 Review ofliterature The Indian economy has been growing at an average rate of more than 8 per cent over the last four years (Srinivas, 2006) putting enormous demands on its productive infrastructure. Whether it is the physical infrastructure of road, ports, water, power etc. or the digital infrastructure of broadband networks, telecommunication etc. or the service infrastructure of logistics – all are being stretched to perform beyond their capabilities. Interestingly, this is leading to an emergence of innovative practices to allow business and public service to operate at a higher growth rate in an environment where the support systems are getting augmented concurrently. In this paper, we present the status of the evolving logistics sector in India, innovations therein through interesting business models and the challenges that it faces in years to come. Broadly speaking, the Indian logistics sector, as elsewhere, comprises the entire inbound and outbound segments of the manufacturing and service supply chains. Of late, the logistics infrastructure has received lot of attention both from business and industry as well as policy makers. However, the role of managing this infrastructure (or the logistics management regimen) to effectively compete has been slightly under-emphasized. Inadequate logistics infrastructure has an effect of creating bottlenecks in the growth of an economy, the logistics management regimen has the capability of overcoming the disadvantages of the infrastructure in the short run while providing cutting edge competitiveness in the long term. It is here that exist several challenges as well as opportunities for the Indian economy. There are several models that seem to be emerging based on the critical needs of the Indian economy that can stand as viable models for other global economies as well. Chandra and Sastry (2004) have pointed towards two key areas that require attention in managing the logistics chains across the Indian business sectors – cost and reliable value add services. Logistics costs (i.e., inventory holding, transportation, warehousing, packaging, losses and related administration costs) have been estimated at 13-14 per cent of Indian GDP which is higher than the 8 per cent of USA’s and lower than the 21 per cent of China’s GDP (Sanyal, 2006a). Service reliability of the logistics industry in emerging markets, like India, has been referred to as slow and requiring high engagement time of the customers, thereby, incurring high indirect variable costs (Dobberstein et. al, 2005).
  • 16.
    However, the Indianlogistics story is one with islands of excellence though there has been a general improvement on almost all parameters. It is this aspect that we explore further in this paper. The paper is organized as follows: the next section gives a brief introduction of some of the peculiarities of the Indian logistics sector.
  • 17.
    Chapter III 3.Research Methodology Researchmethodology is a way to systematically solve the research problem. The research methodology using for find out the solution of the research problem is analytical research methodology and some extend descriptive research methodology. Basis of selection of companies The companies are selected on the basis of Earning per Share of top five companies in logistics industry. This is listed in BSE, NSE Index in India. List of selected companies for study ♦ Container Corporation of India ♦ Allcargo Logistics ♦ Aqua Logistics ♦ Aegis Logistics ♦ Arshiya International Period of study The period of the study is five years that is 2008 to 2012 because of understand the growth of the industry to find out competitive position in market. Nature of data This study takes secondary data for the purpose of analysis of industry, SWOT analysis, and competitive position. Sources of data ü Company website, RBI website, Moneycontrol.com, National stock Exchange, Bombay Stock Exchange, CII, World Bank data.
  • 18.
    Secondary data ü Balancesheet of companies ü Profit and loss accounts ü Directors reports ü News papers ü NSE, BSE data Tools and Techniques These are the most popular tools of industry analysis. They focus on earnings, growth and value of the companies in the market. ü SWOT ü BCG matrix ü General Electrical Matrix ü Financial ratio ü Graphs and tables
  • 19.
    4.1. Container Corporationof India Limited (CONCOR) Container Corporation of India Limited (CONCOR) was set up in March of the year 1988 and commenced operation from November of the year 1989 taking over the existing network of 7 Inland Container Depots (ICDs) from the Indian Railways to profitably satisfy the customer's needs for high- quality, cost-effective logistics services. From its humble beginning, it is now an undisputed market leader having the largest network of 57 ICDs/CFSs in India offering scheduled and on demand rapid rail and road services between the hinderland and ports, and between major metros. In addition to providing inland transport by rail for containers, it has also expanded to cover management of Ports, air cargo complexes and establishing cold-chain. It has and will continue to play the role of promoting containerization of India by virtue of its modern rail wagon fleet, customer friendly commercial practices and extensively used Information Technology. The company developed multimodal logistics support for India's International and Domestic containerization and trade. CONCOR's core business is characterised by three distinct activities, that of • Carrier, • Terminal operator • Warehouse operator CONCOR had been certified to ISO/IEC 27001: 2005 standard for establishing and maintaining Information Security Management System (ISMS) for its IT functionality. CONCOR had commissioned seven container transfer/handling facilities during the year 1990. In addition to three ICDs at Ahmedabad, Pune & Hyderabad, two full-fledged Container Freight Stations (CFSs) were commissioned at Moradabad and Panipat as cargo consolidation and clearance centres with linkage to the OCD at New Delhi. The Company had commissioned Port Side Container Terminal (PSCT) at Todiarpet in March of the year 1991, situated in the vicinity of Chennai Harbor. A similar terminal was commissioned at Wadi Bunder in close proximity of Mumbai Port in April of the year 1991. In 1992-93, the company achieved the first ever movement of refrigerated cargo containers by rail. CONCOR had introduced this service to give a boost to export frozen and chilled products. CONCOR commissioned Inland Containers Depots at Tughalakabad in Delhi and Whitefield in Bangalore during the year 1993. In addition, the first phase of expansion and upgradation of ICD a Tondiarpet in Chennai was commissioned and completed during the same period. During the year 1994, the company made a small footstep as a Multi modal transport operator and also as a consultancy organization for multi-modalism.
  • 20.
    The Government ofIndia disinvested 20% of its equity shares in the company. A new CFS was commissioned in 1995 at New Mulund (Mumbai) and a new export warehouse of the company also started at ICD, Sabarmati. In the same year CONCOR obtained approval from World Bank to increase the quantity of wagons to be procured in the second Tranche from 750 to 1500. Scheduled reefer services between ICD Thughlakabad during the year 1996 and also in the same period the Muboni Port was introduced. The new ICDs were commissioned at Agra in November of the year 1996, linked with ports directly by road ICD Tughlakabad by rail and another ICDs were commissioned at Nagpur in January of the year1997, a rail linked with the twin ports of Mumbai and SNPT. In January of the year 1997, the 'CONTRACK' services were launched by the company offering movement of piecemeal domestic cargo in containers through specialized, scheduled and reliable container-rail services. Two new ICDs of the company were commissioned, one at Moradabad in February of the year 1998 and the other at Malanpur/Gwalior in June of the year 1998. Second bonded warehouse was commissioned at ICD/Whitefield. The Company had launched a daily service between Chennai port and Whitefield ICD, Bangalore in the year 1999. During the year 2000, CONCOR had fashioned a separate domestic division to give a major heighten to the company's growing interest in domestic container movement. The Company had introduced an express parcel service vans between Chennai and Delhi. Private sector warehousing company, Continental Warehousing Corporation had entered into a strategic alliance with CONCOR in the identical year 2000 for handling domestic cargo. The Company had launched a fixed-day fixed-time weekly freight service between Shalimar (Howrah)& Mumbai and Shalimar & Ahmedabad with transshipment at Nagpur during the year 2001. CONCOR had introduced Asia's biggest ICD at Dadri in the year 2003. In the same year the company made a tie up with Kolkata Port Trust to provide services to shippers to transport containers using sea rail-mode between Nepal and Kolkata Dock Systems (KDS). During the year 2004, CONCOR inked pact with Transworld to set up CFS at Dadri, forged alliance with APL for box freight station at Dadri complex and also inked pact with APEDA for movement of perishable goods. A joint venture for Management and operations of Rail Container Terminal in Birgunj (Nepal) was also finalized in form of M/s Himalayan Terminals and its was commissioned during July of the year 2004. During the year 2004-05, the company had commissioned four Rubber Tyred Gantry Cranes (RTG's), two at ICD/Dadri and other two at ICD/ Dandharikalan (Ludhiana). Gateway Terminal India (Pvt) Ltd, a joint venture company of Maersk and the company formed an arm for the construction of 3rd container terminal at JN Port, it was commenced construction work during the year 2005-06.
  • 21.
    CONCOR & GDLhad collectively signed agreement during the year 2005 for providing train services to transport EXIM container traffic. The Company had inked a MoU with Baxi Group in the year 2006. During October of the year 2007, CONCOR develop an inland container depot (ICD) at Baddi in Himachal Pradesh to facilitate the exporters of the Baddi-Barotiwala- Nalagarh region. It will help industrialists of the region in saving the freight charges. The Company has diversified into back-end retail in January of the year 2008 and is in close final negotiation with Bharti-Wal-Mart to procure and supply fruit to the retailer. CONCOR will add eight new rail-linked inland container depots (ICDs) with an investment of Rs 3.2 billion by the end of next fiscal. The Company will have 65 depots, up from 57 at present. The new depots were announced at Railway Budget 2008. The Company is expanding the presence of the company in all the segments of the transport value chain in the Exim as well as Domestic segment. Possibilities are to be explored for strategic alliances, both for optimal utilization of infrastructure as well as expansion into other segments of the value chain.
  • 22.
    1.1.1 Reserve andSurplus Container Corporation of India Particulars 2008 2009 2010 2011 2012 Reserves 3118.93 3632.23 4206.42 4847.83 5476.45 Table No 4.1.1Reserve and Surplus Container Corporation of India Char No 4.1.1 Reserve and Surplus Container Corporation of India Inference The above diagram explains about the general reserves of Container Corporation of India where as in the FY 2008 had Rs 3118.93Crs it was increased to Rs3632.23Crs in FY 2009. In the FY11 the company has Rs 4847.83Crs it was increased from15.25% in previous year. Finally in FY12 the company records 12.97% increased to Rs 5476.45Crs. Its shows that company have good performance over the past five years. As an investor point of view, its performance is high compare to other companies in this industry. 2008 2009 2010 2011 2012 0.00 1000.00 2000.00 3000.00 4000.00 5000.00 6000.00 3118.93 3632.23 4206.42 4847.83 5476.45
  • 23.
    1.1.2 Net Blockof Container Corporation of India Particulars 2008 2009 2010 2011 2012 Net Block 1665.15 1925.59 2140.48 2306.98 2393.75 Table No 4.1.2 Net Block of Container Corporation of India Chart No 4.1.2 Net Block of Container Corporation of India Inference The above diagram denotes that net block of the company in which the company’s net block continually increased over the past five years. In the FY12 the value of net block increased to 76% to Rs 2393.75cr from Rs 1665.15Cr in FY08. They increase their containers, software, leased lands its covers vast area of operation allover the India. 2008 2009 2010 2011 2012 0.00 500.00 1000.00 1500.00 2000.00 2500.00 1665.15 1925.59 2140.48 2306.98 2393.75
  • 24.
    1.1.3 Net Salesof Container Corporation of India Particulars 2008 2009 2010 2011 2012 Net Sales 3347.30 3417.16 3705.68 3828.12 4060.95 Table No 4.1.3 Net Sales of Container Corporation of India Chart No 4.1.3 Net Sales of Container Corporation of India Inference The above diagram explains about the net sales of the company it indicate the good performance over the years. In the FY08 sales stood at Rs3347.30Crs it was increased to 2% in FY09. In the FY11, net sales were Rs3828.12Crs it was increased from 3.30% in previous year 2010. The company improves its operation its shows increased in sales to Rs 4060.95Crs i.e 6% increased. 2008 2009 2010 2011 2012 0.00 500.00 1000.00 1500.00 2000.00 2500.00 3000.00 3500.00 4000.00 4500.00 3347.3 3417.16 3705.68 3828.12 4060.95
  • 25.
    1.1.4 Net Profitof Container Corporation of India Particulars 2008 2009 2010 2011 2012 Net Profit 752.21 791.20 786.69 875.95 877.88 Table No 4.1.4 Net Profit Of Container Corporation of India Chart No 4.1.4 Net Profit Of Container Corporation of India Inference The above diagram explains net profit increased over the years. In the FY2008 the company records Rs 752.21Crs. it was increased Rs 38.99Crs to stood at Rs 791.20Crs in FR09. In the FY10 the Net Profit available for appropriations stands at 786.69 Cr, which is marginally -0.57% below last year's level. This marginal decline in Profit After Tax (PAT) is essentially due to slightly more than proportional increase in the operating expenditure. In 2011 Net Profit available for appropriations stands at Rs 875.95 Cr, which is 11.35% higher than FY2010. This increase in Profit After Tax (PAT) is essentially due to strict expenditure control and innovative practices adopted by the Company. In FY12 net profit shoot at Rs 877.88Crs, which was 0.22% higher than FY11. 2008 2009 2010 2011 2012 752.21 791.2 786.69 875.95 877.88
  • 26.
    1.1.5 Earnings PerShare of Container Corporation of India Particulars 2008 2009 2010 2011 2012 Earnings Per Share 115.74 60.87 60.52 67.39 67.54 Table No 4.1.5Earnings Per Share of Container Corporation of India Chart No 4.1.5Earnings Per Share of Container Corporation of India Inference The above table explains that EPS records of past five years in the year 2008 the EPS stood at Rs 115.74. but in the year 2009 the company issue bonus share to its shareholders so the equity might be increased so that reasons the Earning Per Share to decline Rs 60.87. in the FY12 the company’s EPS was Rs 67.54
  • 27.
    1.1.6 Current Ratioof Container Corporation of India Particulars 2008 2009 2010 2011 2012 Earnings Per Share 115.74 60.87 60.52 67.39 67.54 Table No 4.1.6 Current Ratio of Container Corporation of India Chart No 4.1.6 Current Ratio of Container Corporation of India Inference Current Ratio provides a margin of safety to the creditors. In a sound business, a current ratio of 2:1 is considered an ideal one. But in this case, the current ratio explains that in the FY08 & FY09 constant relation between current assets and current liability but in the FY10 increased to 3.03:1 it indicate well liquidly position. Later in FY12 the level of inventories would be increased it stood at 4.15:1 is an ideal one.
  • 28.
    4.1.7 Financial Highlightsof Container Corporation of India • In the FY09 the company issue 1:1 bonus share to its shareholders. 6,49,91,397 equity shares issued as fully paid up Bonus Shares by Capitalizing General Reserves. The total share capital stood at Rs.129.98Crs in 2009. Then it was remain same up to current financial year. • The company had strong resources and surplus because this is has more operation compare to other companies it generate more revenue in past five years. The company had Rs.3118.93Crs in 2008 it was increased to Rs.3632.23Crs in 2009. Finally in the FY12 its was increased to 75% stood at Rs.5476.45Crs • The net worth of the CONCOR could be increased past five years. Now it stands at Rs 5606.43Crs. it was increased 12.6% in previous year • Net Block of the company continuously increased due to the company had more leased land, purchase more plant and machinery now stood at Rs.2177Crs, they spent Rs33.16Crs for buying containers now the value of the container stood at Rs124.55Crs • The company’s investment could be increased over the years because in the FY12 the company invest about Rs.50Crs IRFC Secured, Tax Free, Redeemable, Non-convertible, Non-Cumulative Railway Bonds in the nature of promissory notes-79th Series of 1,00,000/- each now the total investment amount stood at Rs 293Crs in FY12 • The company follows just in time inventory. Stores and spare parts are valued at cost on weighted average basis so the value of the inventory now stands at Rs 8Crs in FY12 • The sundry debtors were slightly increased over the years. In FY08 it was Rs 13.73Crs which increased to Rs 19.59Crs in FY12 • CONCORE Bank Deposits with maturity upto 12 months Rs 2540.82Crs in FY12 so that reasons the company’s current ratio was increased • The sales of the company was increased over the years due to company covers vast area for its operations in FY12 the company records Rs 4060Cr it was higher in these industry • The company earns more other income by way of getting more interest and dividend for its investments. In FY12 the company get Rs 316Cr as additional income which was higher than Rs 143Crs in previous year. • Hence the total income of the company could be increased in FY12 to stood at Rs 4377.49Crs • Operating profit of FY2008 was Rs890.73Crs it was increased to Rs 1002.69Cr in FY’11. In FY12 the operating profit stood at Rs 1023.73Cr • The company records Rs 1181.78Crs of Profit Before Tax (PBT) which was 13% higher than FY08. • The book value of share now stood at Rs 431.32 the original face value is Rs 10. • The company recommended 165% of dividend in FY12. In the FY08 provide 260% of dividend due to increase in equity share capital.
  • 29.
    4.1.8 SWOT ANALYSISOF CONTAINER CORPORATION OF INDIA (CONCOR) Strength v Market leader in logistics sector in India v 20 years of presence in rail movement of containers/terminal management/operation of ICDs v Government undertaking company v High level of resources and surplus v They currently hold 10988 wagons v The Company has constituted a Core Risk management Committee (RMC) for managing the integrated risks of the company v The company has Strong financials and highly committed team of experienced and skilled manpower with in-depth knowledge of multi modal logistics business. Weakness v This focus only railways, containers operations v Follow old information technology, equipments v It handle bulk quantities only v The company utilize its equity funds Opportunities v Customer delights by way of efficient response and integrated multi modal services. v Increase in revenue by diversification and product differentiation. v Management of costs by technological innovation Threats v High cost of operations v Government polices over import and export in India v Lack of infrastructure v 100% FDI in India Table No 4.1.8 SWOT analysis of CONCORE
  • 30.
    4.2 Allcargo Logistics AllcargoGlobal Logistics Ltd is also known as Allcargo Logistics Ltd the leading LCL (Less than Container Load) consolidator in India offering direct outbound and inbound LCL groupage services to and from major cargo destinations worldwide. Their present operations are in seven key areas of the logistics business. They are Multi-modal Transport Operations, Container Freight Stations, Project and ODC Cargo Handling, Airfreight, Transport Logistics, Equipment Hiring and Oil Rig & Supply Vessels Management. The company was incorporated on August 18, 1993 as a private limited company in the name Allcargo Movers (India) Pvt Ltd. The company commenced their operations as a shipping agency and also provided freight forwarding services. In the year 1995, they formed association with Ecu Line NV, Belgium to serve as their agents in Mumbai and New Delhi. From June 1998, they became a Multimodal Transport Operator by obtaining the licence from the Ministry of Shipping, Government of India. v In the year 2001, the company made strategic investments in Ecu Line Mauritius and Ecu Line Middle East (Dubai). They acquired 50% stake in ACM Lines (Pty) Ltd in the year 2002. In the year 2003, they entered into a JV with Transworld Logistics & Shipping Services Inc. v In the year 2003, they commissioned Container Freight Stations at Koproli in Maharashtra. In the next year, they commissioned the second phasse and in the year 2005, they commissioned the third phase. v On December 8, 2005 the company name was changed into Allcargo Global Logistics Pvt Ltd. They company became a public limited company in the year 2006. v In January 2007, the company acquired Hindustan Cargo Ltd from Thomas Cook India Ltd and thus they became the subsidiary of the company. v On April 24, 2007 the company commenced their commercial operations in the Container Freight Stations at Chennai in Tamil Nadu and Mudra in Gujarat. v The company acquired the Project and Equipment Division of Transindia Freight Services Pvt Ltd on May 2008.
  • 31.
    4.2.1 ALLCARGO LOGISTICSLTD- FINANCIAL PERFORMANCE 1.1.2 NET WORTH OF ALLCARGO LOGISTICS LTD Particulars 2008 2009 2010 2011 2012 Net worth 385.51 496.87 791.79 979.01 1140.14 Table No. 4.2.2 net worth of Allcargo Logistics Chart No. 4.2.2 net worth of Allcargo Logistics INTERPRETATION The net worth of Allcargo Logistics has continuously increased compare to past financial years. It retains abundance of reserves and surplus. 14% to be increased its value over the previous year. In FY2008 the company had Rs 385.51Cr. But in FY10 the company spilt share capital so the value stood at Rs 791.79crs. The company records good sales records over the years this one of the reasons increased in General reserve so the net worth was increased in FY12 Dec '07 Dec '08 Dec '09 Dec '10 Mar '12 0.00 200.00 400.00 600.00 800.00 1000.00 1200.00 1400.00 385.51 496.87 791.79 979.01 1140.14
  • 32.
    1.1.3 GENERAL RESERVEOF ALLCARGO LOGISTICS LTD Particulars 2008 2009 2010 2011 2012 Reserves 361.65 443.53 765.18 951.68 1113.16 Table No 4.2.3 General reserve of Allcargo Logistics Chart No 4.2.3 General reserve of Allcargo Logistics INTERPRETATION The diagram explain about the level of reserve is increased Up to 14% the company has spent more money for acquisition of firms it shows that increase in value of share in future. Even the company has the high level of reserve and surplus in expect more return in the future. The company records high level of sales compare to past years this is one of the reasons increase in General Reserves. 2008 2009 2010 2011 2012 0.00 200.00 400.00 600.00 800.00 1000.00 1200.00 1400.00 Reserves Series 2
  • 33.
    1.1.4 NET BLOCKOF ALLCARGO LOGISTICS LTD Particulars 2008 2009 2010 2011 2012 Net Block 210.08 315.16 410.25 642.07 981.21 Table No 4.2.4 Net Block Of Allcargo Logistics Ltd Chart No 4.2.4 Net Block Of Allcargo Logistics Ltd INTERPRETATION The company is net block that is the asset of the company increased 39% due to acquired more asset over the years. In the year 2012 the company purchases heavy Equipments Rs.0.35Crs.The Company also brought additional vehicles for their operation about Rs 1.17Crs. They also spent funds for buying more assets like freehold land, plant Equipments, furniture& Fixtures in FY12. 2008 2009 2010 2011 2012 0.00 200.00 400.00 600.00 800.00 1000.00 1200.00 210.08 315.16 410.25 642.07 981.21
  • 34.
    1.1.5 BOOK VALUEOF ALLCARGO LOGISTICS LTD Particulars 2008 2009 2010 2011 2012 Book Value (Rs) 188.54 208.33 63.31 74.92 87.27 Table No 4.2.6 Book Value of Allcargo Logistics Chart No 4.2.6 Book Value of Allcargo Logistics INTERPRETATION The company had face value of Rs 10 in 2008 & 2009. Later it reduces their face value from Rs10 to Rs2. So the book value of share is now stood at Rs 87.27 In the FY2010, the value of book value stood at Rs 63.31 it was increased past three years now the company records book value of a share is Rs87.27 2008 2009 2010 2011 2012 0.00 50.00 100.00 150.00 200.00 250.00 188.54 208.33 63.31 74.92 87.27
  • 35.
    1.1.6 SALES TURNOVER OF ALLCARGO LOGISTICS LTD Particulars 2008 2009 2010 2011 2012 Sales Turnover 361.25 516.79 516.76 699.84 1079.43 Table No 4.2.6 SALES TURN OVER OF ALLCARGO LOGISTICS Chart No 4.2.6 SALES TURN OVER OF ALLCARGO LOGISTICS INTERPRETATION The above diagram explains about the Net sale of the company. it has increased from Rs. 516.76 Cr for the FY-2009-10 to Rs.699.84 for the FY-2010-11 indicating increase of 26% further, as per audited financial for the year 2011-12, the company achieved sale of Rs. 1079.43Cr Indicating an increase of 35% 2008 2009 2010 2011 2012 0 200 400 600 800 1,000 1,200 361.25 516.79 516.76 699.84 1079.43
  • 36.
    1.1.7 PROFIT BEFOREDEPRECIATION INTEREST& TAXES (PBDIT) Particulars 2008 2009 2010 2011 2012 PBDIT 83.74 152.69 160.03 225.37 360.08 Table No 4.2.7 PROFIT BEFORE DEPRECIATION INTEREST& TAXES Chart No PROFIT BEFORE DEPRECIATION INTEREST& TAXES INTERPRETATION The profit Before Depreciation Interest & Taxes of Allcaro logistics shows that in the year 2011 PBDIT was Rs 225.37Cr. In the FY-2012 increased by Rs.134.71Cr reach at Rs.360.08Cr the company earn good efficiency of performance in other words there is a upwards movement in the PBDIT Over the past financial years the company face the boom position due to that have various net work all over the world. The company operates its operation all over the world wide. That one of the reason they get more profit compare to its competitors.
  • 37.
    1.1.8 NET PROFITOF ALLCARGO LOGISTICS LTD Particulars 2008 2009 2010 2011 2012 Reported Net Profit 59.78 92.67 97.81 121.13 184.07 Table No. 4.2.8 NET PROFIT OF ALLCARGO LOGISTICS Chart No 4.2.8 NET PROFIT OF ALLCARGO LOGISTICS INTERPRETATION The net profit of the company had a very good performance over past five years. The company achieved Rs.184.07Cr Net Profit in FY-12 it was increased from 34% in previous years. in the year 2008 the company records Rs 59.78Cr but in next year the company records Rs 93.67Cr. 59.78 92.67 97.81 121.13 184.07 2008 2009 2010 2011 2012
  • 38.
    1.1.9 EARNINGS PERSHARE (RS) OF ALLCARGO LOGISTICS LTD Particulars 2008 2009 2010 2011 2012 Earning Per Share (Rs) 29.51 41.44 7.84 9.28 14.1 Table No 4.2.9 EARNINGS PER SHARE (RS) OF ALLCARGO LOGISTICS Chart No EARNINGS PER SHARE (RS) OF ALLCARGO LOGISTICS INTERPRETATION The above diagram explain about the EPS of Allcargo Logistics Ltd .The company had face value of Rs 10 in 2008 & 2009. Later it reduces their face value from Rs10 to Rs2. So that reason in FY12 stood at Rs14.1 2008 2009 2010 2011 2012 29.51 41.44 7.84 9.28 14.1 Earning Per Share (Rs)
  • 39.
    1.1.10 DEBT –EQUITY RATIO OF ALLCARGO LOGISTICS LTD Particulars 2008 2009 2010 2011 2012 Debt Equity Ratio 0.06 0.44 0.14 0.25 0.49 Table No 4.2.10 Debt – Equity Ratio Of Allcargo Logistics Chart No 4.2.10 Debt – Equity Ratio Of Allcargo Logistics INTERPRETATION The above chart explains that the debt- equity ratio of the Allcargo Logistics Ltd in the FY2008 they have only 0.06. It was increased to 0.44 in the year 2009 due to company brows more funds from external sources. But in FY2010 it was reduced because the company refunds their borrowing later it was increased to 0.49 in the FY12 due to increase their operation towards worldwide. 2008 2009 2010 2011 2012 0 0.1 0.2 0.3 0.4 0.5 0.6 0.06 0.44 0.14 0.25 0.49
  • 40.
    1.1.11 Current RatioAllcargo Logistics Ltd Particulars 2008 2009 2010 2011 2012 Current Ratio 1.55 3.33 2.98 2.65 2.08 Table No 4.2.11 Current Ratio Allcargo Logistics Table No 4.2.11 Current Ratio Allcargo Logistics INTERPRETATION The current ratio’s normal range between .05 to 2.0 is acceptable but the above diagram denotes that continuously decrease over four years but ratio cloud be remain same position that is safe liquidity. The company spent more resource for expands its operation over the upcoming years. 2008 2009 2010 2011 2012 0 0.5 1 1.5 2 2.5 3 3.5 4 1.55 3.33 2.98 2.65 2.08 Current Ratio
  • 41.
    4.2.12 RATIO ANALYSISOF ALLCARGO LOGISTICS LTD Particulars 2008 2009 2010 2011 2012 Operating Profit Margin(%) 22.07 25.66 28 26.06 28.62 Gross Profit Margin(%) 18.13 20.73 20.71 20.31 20.37 Net Profit Margin(%) 16.48 17.76 18.5 16.79 16.28 Return On Capital Employed(%) 16.33 15.93 13.17 13.34 15.95 Return On Net Worth(%) 15.65 19.89 12.37 12.38 16.15 Table No 4.2.12 Ratio Analysis Of Allcargo Logistics Chart No 4.2.12 Ratio Analysis Of Allcargo Logistics INTERPRETATION The above diagram denotes that operating profit margin was increased over the years. The Gross Profit Margin was no changes over the years. Net Profit Margin is no change in last two years. Return on capital employed indicates that in FY08 was 16% due to increase the employer level so that reasons it was decreased to 15.95% in FY12. The rate of return on net worth in FY08 was 2008 2009 2010 2011 2012 0 5 10 15 20 25 30 35 Operating Profit Margin(%) Gross Profit Margin(%) Net Profit Margin(%) Return On Capital Employed(%) Return On Net Worth(%)
  • 42.
    15.65% but itincreased to 19.89% in FY09 finally in FY12 rate of return stood at16.15% 4.2.13 LIQUIDITY AND SOLVENCY RATIOS Particulars 2008 2009 2010 2011 2012 Quick Ratio 1.75 3.31 2.94 2.61 2.04 Debt Equity Ratio 0.06 0.44 0.14 0.25 0.49 Long Term Debt Equity Ratio 0.05 0.44 0.14 0.25 0.49 Debtors Turnover Ratio 10 8.84 7.17 8.41 9.69 Asset Turnover Ratio 1.46 1.37 0.64 0.66 0.69 Table No 4.2.13 Liquidity And Solvency Ratios Chart No 4.2.13 Liquidity And Solvency Ratios INTERPRETATION The above diagram explains that ratio of Allcargo Logistics Ltd. whereas quick ratio indicates that the firm has good financial position over the past five years. The company use external use of funds over the years in FY12 Company 49% of shareholders’ funds. Long term debt equity ratio was stood at 0.49. A debtor turnover ratio explains that extends level of credit sales over 2008 2009 2010 2011 2012 0 2 4 6 8 10 12 Quick Ratio Debt Equity Ratio Long Term Debt Equity Ratio Debtors Turnover Asset Turnover Ratio
  • 43.
    the years herethe company in FY12 was 9.69times. Asset turnover ratio indicates that company utilizes the assets use effectively over the years. 4.2.14 SWOT Analysis of Allcargo Logistics Ltd Strength • MTO business showed growth of 13% • 2nd rank in the industry in India. • Scale of operation across 62 countries and over 4000 ports. • LCL consolidation market with a strong network across 62 countries and 142 own offices covering over 4,000 port pairs with nearly 200 agents and franchisees • Robust distribution network • Superior performance and innovative ideas Weakness • Strong dependency on weak infrastructure • Taxes policies in India • lack of adoption of new technology compare to foreign companies Opportunities • Diversify new product portfolio to enter in to new service provided • Company utilizes their fund for further expansion. • To start 3PL it will give more strong to the company • CFS/ICDs that run their own container terminal, freight forwarder or shipping line are likely to gain from the surge in ocean freight Threats • Competitor like DHL, TNT,UPS, Blue Dart • Government rules and regulations • India have poor infrastructure facilities like road, port, information technology • Restriction on import and export procedure. Table No 4.2.14 SWOT Analysis Of Allcargo Logistics Ltd
  • 44.
    4.3 AQUA LOGISTICSLIMITED Aqua Logistics Limited is India's foremost global logistics and supply chain partner, delivering excellence across industries, through an integration of empowered people, processes and technology. The Company is a full-scope 3 PL (third-party logistics service provider), delivering end-to-end solutions in the logistics and supply chain domain to customers. The company capabilities include supply chain consulting, logistics execution and project logistics. The company operations and consulting teams, deliver logistics solutions, to client's by aligning the strategic and the operational perspectives. The company is global supply chain management involves planning, implementing and controlling a series of complex tasks performed by persons of different nationalities and cultures and with varying language capabilities. The company integrates these multinational capabilities by combining years of expertise with the latest in technology. The company's operations in consulting, and client development teams deliver logistics, operations strategy, sourcing and procurement planning, fulfillment operations, customer service and after sales support. The company was established in 1999 and headquartered in Mumbai and has presence in major locations such as New Delhi, Chennai, Bangalore, Ludhiana, Baroda, Cochin and Pune. In 1999, the company started as freight forwarding and consistently increased capabilities and scope of services. As an external service provider ambit of services covers critical services which are required to execute end-to- end logistic needs. These include Multimodal Transportation, Contract Logistics, Regulatory Compliance, Warehousing, Value Added Services and Project Logistics. The company international logistics operations are supported by a network of 3PL partners and vendors that enables us to service client requirements across India and abroad as well. The company delivers international logistic services by using air, sea and surface, as modes of transportation. The company regulatory compliance services include customs and industry-specific regulations. The company had a Multi-Modal Transport Operator's License, an IATA Accreditation and a Custom House Agent's License for servicing customers' requirements
  • 45.
    4.3.1 RESERVES &SURPLUS OF AQUA LOGISTICS LIMITED Particulars 2008 2009 2010 2011 2012 Reserves & Surplus 28.48 44.52 206.47 493.61 491.56 Table No 4.3.1 Reserves & Surplus Of Aqua Logistics Chart No 4.3.1 Reserves & Surplus Of Aqua Logistics Inference: During the year, company reduction in operation so that reason the level of reserve and surplus Rs. 2.05Cr could be reduced. But past four years they retain so many reserves and surplus. In the FY2011 they retain 139% in profit. Now the company reserve increased up to 1625% in past financial five years. 2008 2009 2010 2011 2012 28.48 44.52 206.47 493.61 491.56
  • 46.
    4.3.2 NET BLOCK/NETASSETS OF AQUA LOGISTICS LIMITED Particulars 2008 2009 2010 2011 2012 Net Block 9.13 12.75 43.09 44.36 44.93 Table No 4.3.2 Net Block/Net Assets Of Aqua Logistics Chart No 4.3.2 Net Block/Net Assets Of Aqua Logistics Inference In the FY2010 the company brought Plant & machinery about Rs 31Cr. So the value of asset could be increased over the years. Later the value of net block could be increased. In the Year 2012 the value of assets shows that Rs44.93Cr. the followings are explains about the the company brought asset over the FY2010 • Plant & Machinery-Rs 31.2Cr • Computer & Software- Rs 0.08Cr • Furniture & Fixtures-Rs 0.22Cr • Vehicles-Rs 0.22Cr
  • 47.
    Therefore, the companyspent their resources for buying new vehicles currently the company buy the worth of Rs4.46Cr 4.3.3 NET SALES OF AQUA LOGISTICS LIMITED Particulars 2008 2009 2010 2011 2012 Net Sales 108.99 213.4 322.01 380.88 310.35 Table No 4.3.3 Net Sales Of Aqua Logistics Chart No 4.3.3 Net Sales Of Aqua Logistics Inference The company records the continuous improvement in the year between FY2008 to FY2011. But in the year 2012 the sales could be down up to 18.52% the level of sales stand at Rs 310.35Cr in FY12.eventhouh the sales growth for past five years is 184% 2008 2009 2010 2011 2012 108.99 213.4 322.01 380.88 310.35 Net Sales (Cr)
  • 48.
    4.3.4 NET PROFITOF AQUA LOGISTICS LIMITED Particulars 2008 2009 2010 2011 2012 Net Profit 5.61 11.15 20.54 22.39 1.15 Table No 4.3.4 Net Profit Of Aqua Logistics Chart No 4.3.4 Net Profit Of Aqua Logistics Inference The diagram explains about the net profit of the company could reduced due to payment of more interest and taxes in FY12. In the FY10 the company recorded Rs 22.39Crs which was 1.85Crs increased from previous years.
  • 49.
    4.3.5 DEBT-EQUITY RATIOOF AQUA LOGISTICS LIMITED Particulars 2008 2009 2010 2011 2012 Debt – Equity ratio 0.20 0.69 0.13 0.13 0.16 Table No 4.3.5 Debt-Equity Ratio of Aqua Logistics Chart No 4.3.5 Debt-Equity Ratio of Aqua Logistics Inference The Debt- Equity ratio explains about the business concern is done by owner’s equity as well as outside debts. In other words, the relationship between borrowed funds and owner’s capital it used for measure the long – term solvency of a firm. Aqua logistics shows that in the FY2009 could be increased from 0.20times to 0.69 times later it reduced to 0.13 times but in the audited FY12 the company borrowings more short term loans so that reason the level could be increased over the year. Now it stands at 0.16 times.
  • 51.
    4.3.6 Profitability Ratiosanalysis of Aqua Logistics Particulares 2008 2009 2010 2011 2012 Operating Profit Margin(%) 11.7 10.47 10.21 9.38 5.08 Gross Profit Margin(%) 11.19 9.93 9.75 8.36 3.83 Net Profit Margin(%) 5.14 5.22 6.37 5.85 0.36 Return On Capital Employed(%) 25.66 21.98 12.38 5.58 2.4 Return On Net Worth(%) 14.05 19.89 9.2 4.3 0.22 Table No 4.3.6 Profitability Ratios analysis of Aqua Logistics Chart No 4.3.6 Profitability Ratios analysis of Aqua Logistics INFERENCE The diagram explains that Gross profit margin ratio explains that in FY08 records that 11.19% due to decreased in sales now 3.83% in FY12. Net profit margin indicates that diminishing over the years reasons was reduced in sales over the years. 2008 2009 2010 2011 2012 0 10 20 30 40 50 60 70 80 90 Operating Profit Margin(%) Gross Profit Margin(%) Net Profit Margin(%) Return On Capital Employed(%) Return On Net Worth(%)
  • 52.
    Financial Highlights v FaceValue of the Equity Share of the Company was splitted from 2010 to Rs.1.00 With Respect of 4th October, 2010 v During the year, the Company allotted 4.1Cr Global Depository Receipt (GDR) (on pari- passu basis) representing 9.46 Equity Shares of Re.1/- each with each GDR representing 23 Equity Shares at US$ 15.17 per GDR on February 10, 2011 v In order to conserve the profit of the business of the company, to meet the growing funding requirements, it has not recommended any dividend for the last 5 years. v The Value of the Net Assets of the company has increased in past 5 years it shows that it brought many assets by way of utilizing the reserves & surplus of the company. v It provide services, so it need not maintain any inventories v The company spent more funds on its subsidiaries so the level of investment could be increased in past few years v The value of Debtors collection could be decreased. Up to 5.6% has been reduced. v The performance of the current assets shows very good financial results up to 53% increased its helps to investors can invest their fund in this company share for short term period. v Aqua Logistics company barrows fund from external sources in the previous year Rs 65.35Cr it’s increased to 329% stood at Rs 280.62Cr in FY12. v Face Value of the Equity Share of the Company was splitted from 2010 to Rs.1.00 due to that reason the book value of share was FY11 stood at Rs 17.45 in FY12 profit level could be turn down so the book value per share is Rs.17.39 v During the year the company has registered income from operation of Rs. 331.93 Cr. as compared to Rs. 381.73Cr in the previous year. v Profit before Depreciation Interest and Tax (PBDIT) has decreased from Rs 17.36Cr. For the year ended March 31, 2011 to Rs.36.61 Cr. showing the decrease of 52.6 %. During FY2012, the company has recorded PBDIT of 5.55% of the income from operation as against 9.58% during FY2011. The reduction in operation in operating margin is due to decrease in income from operation.
  • 53.
    vDuring the year,Profit after tax (PAT) has decreased from Rs.21.24Cr. for the FY2011 to Rs.1.15Cr. in FY2012 due to decrease in income from operation. v The company pays more funds for interest payment due to that reason the level of profit could be decreased over the year. Interest has increased from Rs. 4.53Cr. for the FY2011 to Rs.11.78Cr. in FY2012 v The gross Profit Margin reflects the efficiency with which Management Produces each unit of product. This ratio indicates the average spread between the cost of goods sold and the sales revenues. A high gross profit margin shows that a sign of good management and vice. Versa in Aqua Logistics company past five year gross profit margin continuously inability to purchase raw material at favorable terms. It result in decreased from 9.38% to 5.08% in FY2012. v Net Profit Margin ratio establishes a relationship between net profit and sales and indicates management’s efficiency in manufacturing, administration and selling the products/service. While in this case the company performance shows that fluctuation in past five years. In FY2008 5.14% but the company effort of the could be abridged now the ratio shows that 0.36% the economic condition also one of the reasons for slope in net profit margin ratio. v There is no constant changes in the ROE it indicate that the relationship between the Net Profit to Net worth of the company but the company shows up-down movement in past performance like in FY2011 the ROE was 4.3% it reduced to 0.22% in FY2012. v Current Ratio provides a margin of safety to the creditors. In a sound business, a current ratio of 2:1 is considered an ideal one. But in this case, the current ratio explains that in the FY08 & FY09 constant relation between current assets and current liability but in the FY10 increased in sundry creditors for supplier upto Rs. 2.29 Cr. later in FY12 the level of short term borrowings would be increased it stood at 3.26:1 is an ideal one. v The working capital cycle level could be increased continuously over the past five years. In FY12 the Number of Days in Working Capital was 1.5yrs.
  • 54.
    4.3.7 SWOT ANALYSISOF AQUA LOGISTICS LIMITED Strength Ø Good quality and reliability Ø Robust distribution network Ø Superior performance and innovative idea to implement Weakness ØPoor infrastructure in India so that reasons could not able to earn profit effeictively ØGovernment rules and regulations ØLack of financial position in companies Opportunities ØReduction in warehousing space requirement ØImprovement in efficiency due to better inventory management Ø Reduction in transportation cost due to higher capacity utilization Threats Ø Low margin business Ø International competitors ØAcquisitions of other business unit Table No 4.3.7 SWOT Analysis Of Aqua Logistics Limited
  • 55.
    4.4 Arshiya International ArshiyaInternational Ltd is a fast emerging end-to-end service and solution provider in logistics and supply chain management. The company is an amalgamation of several strategic verticals such as Free Trade Warehousing Zones, Rail, 3PL, 4PL, Trucking, Warehousing & IT enabling unparalleled operational expertise & solution capability across the entire supply chain spectrum. Arshiya is rapidly expanding their business capabilities through continuous internal development and aggressive acquisitions in complimentary space. The headquarter is at Mumbai with offices spanning across India, Singapore, Australia, Dubai, Qatar, Oman and USA. Arshiya International Ltd was incorporated in the year 1981 as IID Forgings Ltd. Ø In the year 2006, the company name was changed into Arshhiya Technologies International Ltd and the name was further changed into Arshiya International Ltd with effect from September 28, 2007. Ø In April 2006, the company acquired 100% of the share in two companies namely Cyberlog Technologies Pte Ltd, Singapore, a company engaged in the business of development and marketing of software products and Park Investments Ltd, Hongkong, a company engaged in the business of supply chain logistics. Ø In January 2006, BDP (India) Pvt Ltd was amalgamated with the company. In october 2006, the company had a joint venture agreement with the BDP International Inc USA and Genco I Inc USA for foray into retail distribution activities. During the year 2007-08, the company incorporated Arshiya Logistics Infrastructure Ltd, Arshiya Western Logistic Infrastructure Ltd, Arshiya Distripark Ltd and Flat World Processes Ltd. Thus, they became the subsidiary of the company. The company is in the process of setting up a Free Trade Warehousing Zone, a special category SEZ at Sai Village in Raigad, Maharashtra with a project outlay of Rs 1200 crores. The company has made substantial acquistion of land for the Free Trade Warehousing Zone proposed at Uttar Pradesh and Nagpur at an estimated cost of Rs 1100 crore and Rs 900 crore respectively. The company incorporated a subsidiary namely Arshiya Rail Infrastructure Ltd for containerised rail operations services to the customer for both domestic and exim cargo movement across the the country. The company estimated the project outlay of Rs 1600 crore for the acquisition of 75 Rakes, break vans, building of rail siding and other necessary infrastructure across the country.
  • 56.
    4.4.1 GENERAL RESERVESOF ARSHIYA INTERNATIONAL LTD Particulars 2008 2009 2010 2011 2012 Reserves 445.23 475.36 483.91 502.62 540.81 Table No 4.4.1 General Reserves of Arshiya International Chart No 4.4.1 General Reserves of Arshiya International Inference The above diagram explains that General Reserve of Arshiya International where as the company earn more profit in FY12 due to company earn more profit. They allocate Rs 540.81Cr as general Reserves. It was increased from 7% in previous Year. The growth of the company is moderately increased. So it indicates that definite growth in future because 100% FDI is allowed in India. The company was an amalgamation of several strategic vertical such as Free Trade Warehousing Zones, Rail, 3PL, 4PL, Trucking, IT in future. 2008 2009 2010 2011 2012 445.23 475.36 483.91 502.62 540.81
  • 57.
    4.4. 2 NETBLOCK OF ARSHIYA INTERNATIONAL LTD Particulars 2008 2009 2010 2011 2012 Net Block 3.41 9.65 17.59 330.86 602.35 Table no 4.4. 2 net block of arshiya international Chart no 4.4. 2 net block of arshiya international Inference The above diagram explains about the Net block of the Arshiya International Ltd where as in the FY2008 the company has Rs3.41Crs. but it was increased to Rs 9.65Crs they brows some plant and machineries. In FY11 in company’s net block abnormal increased to Rs330.86Crs company additionally purchase freehold lands, buildings, computers and other equipments. In the financial year 2012 the company shows Rs 602.35Crs reasons, the company purchase additional assets in the years details are, 1. Freehold land-Rs 120Cr 2. Buildings – Rs 134Cr 3. Plant and machinery- Rs 3Crs 4. Equipment –Rs 16Crs 2008 2009 2010 2011 2012 0 100 200 300 400 500 600 700 3.41 9.65 17.59 330.86 602.35
  • 58.
    These items areadditionally purchased in FY12 this is major reasons for improvement in net block of the company. 4.4.3 NET SALES OF ARSHIYA INTERNATIONAL LTD Particulars 2008 2009 2010 2011 2012 Net Sales 201.91 256.39 273.61 453.01 592.63 Table No 4.4.3 Net Sales Of Arshiya International Chart No 4.4.3 Net Sales Of Arshiya International Inference The above diagram explains that Net profit of the company in which the company records Rs 201Cr in FY20008. It was increased 21% to stand at Rs 256.39Crs in FY09. In the FY10 the company records Rs 453Crs as net profit due to the company amalgamate more several strategic vertical such as Free Trade Warehousing Zones, Rail, 3PL, 4PL, Trucking, IT this is one of the reason improvement in profit. Finally company records Rs592.6Cr in FY2012.
  • 59.
    4.4.4 NET PROFITOF ARSHIYA INTERNATIONAL LTD Particulars 2008 2009 2010 2011 2012 Net Profit 12.36 18.49 15.4 24.93 47.51 Table No 4.4.4 Net Profit Of Arshiya International Chart No 4.4.4 Net Profit Of Arshiya International Inference The above diagram denotes that Net profit of the company records in past five years. In FY08 company perform Rs12.36Crs as net profit. In the FY09 the company increased their operations so that reasons the firm earns Rs 18.49Crs. but in FY10 the company’s profit declined Rs 3Crs to shows Rs 15.4Crs because of increase in depreciation, payment of more taxes. In FY12 the company records Rs 47.51Crs as net profit because of increased in operations it reflect improvement in net profit of Arshiya International. Its increased 23.5% from in previous year. But in FY12 the company pays more financial interest to its borrowings.
  • 60.
    4.4.5 EARNINGS PERSHARE OF ARSHIYA INTERNATIONAL LTD Particulars 2008 2009 2010 2011 2012 Earnings Per Share 2.17 3.15 2.62 4.24 8.08 Table No 4.4.5 Earnings Per Share Of Arshiya International Chart No 4.4.5 Earnings Per Share Of Arshiya International Inference The above diagram explains about the Earnings per share of the company in which in the FY08 the value of EPS was Rs 2.17 they recommend Rs0.80 as dividend in the year. In FY2010 EPS could be decreased EPS as Rs 2.62 because of decline in income of the company but the company declare Rs 1.00 as dividend. In FY12 EPS stood at Rs 8.08 the company declare Rs 1.40 as dividend to its share holders. 2008 2009 2010 2011 2012 0 1 2 3 4 5 6 7 8 9 10 2.17 3.15 2.62 4.24 8.08
  • 61.
    4.4.6 DEBT EQUITYRATIO OF ARSHIYA INTERNATIONAL LTD Particulars 2008 2009 2010 2011 2012 Debt Equity Ratio 0.78 0.16 0.73 1.32 2.06 Table No 4.4.6 Debt Equity Ratio Of Arshiya International Chart No 4.4.6 Debt Equity Ratio Of Arshiya International Inference The above chart denotes that Debt Equity of Arshiya International in the Year 2008 the Debt Equity Ratio was 0.78X. A less than 1 ratio indicates that the portion of assets provided by stockholders is greater than the portion of assets provided by creditors and a greater than 1 ratio indicates that the portion of assets provided by creditors is greater than the portion of assets provided by stockholders. In FY2012 the level of debt Equity ratio stands at 2.06X times 2008 2009 2010 2011 2012 0 0.5 1 1.5 2 2.5 0.78 0.16 0.73 1.32 2.06
  • 62.
    4.4.7 CURRENT RATIOOF ARSHIYA INTERNATIONAL LTD Particulars 2008 2009 2010 2011 2012 Current Ratio 6.46 0.75 1.3 1.27 2.02 Table No 4.4.7 Current Ratio Of Arshiya International Chart No 4.4.7 Current Ratio Of Arshiya International Inference The above digram explains that current ratio of Arshiy International where as in FY08 shows 6.46 because of the company do not borrow any term loans. But in FY09 advances received from its subsidiary companies so that reasons the current ratio comes down in the year. In FY12 the ratio indicate good financial positions over working capital the ratio of 2.02:1 whereas company provide Rs 600Crs as loans and advances to its subsidiaries. 2008 2009 2010 2011 2012 0 1 2 3 4 5 6 7 8 6.46 0.75 1.3 1.27 2.02
  • 63.
    4.4.8 PROFITABILITY RATIOSANALYSIS OF ARSHIYA INTERNATIONAL Particulars 2008 2009 2010 2011 2012 Operating Profit Margin(%) 6.95 8.07 8.09 11.72 86.97 Gross Profit Margin(%) 6.63 7.46 7.44 10.19 84.2 Net Profit Margin(%) 5.94 7 5.45 5.25 7.54 Return On Capital Employed(%) 4.22 4.68 3.36 5.67 31.7 Return On Net Worth(%) 2.7 3.79 3.1 5.1 8.59 Table No 4.4.8 Profitability Ratios Analysis Of Arshiya Chart No4.4.8 Profitability Ratios Analysis Of Arshiya INFERENCE The above diagram explains about the Gross Profit Margin highly increased over the years whereas in 6.63% in FY08 but in 84% in FY12. Operating Profit Margins also increased due to 2008 2009 2010 2011 2012 0 10 20 30 40 50 60 70 80 90 100 Operating Profit Margin(%) Gross Profit Margin(%) Net Profit Margin(%) Return On Capital Employed(%) Return On Net Worth(%)
  • 64.
    increased in salesin FY12. The level of net profit was increased in FY12 so the margin level was increased in FY12 stood at 7.54 it was 5.25% in FY11. The value of return on net worth could be increased in past five years in FY12 Stood at 31.7%. the value of return on net worth was increased 8.59% in FY12. Hence the performance of the company has been very good position in the matket. 4.4.9 LIQUIDITY AND SOLVENCY RATIOS ANALYSIS Particulars 2008 2009 2010 2011 2012 Current Ratio 6.46 0.75 1.3 1.27 2.02 Quick Ratio 6.45 2.67 1.57 1.84 2.02 Debt Equity Ratio 0.15 0.16 0.73 1.32 2.06 Debtors Turnover Ratio 7.56 5.62 3.67 4.86 5.48 Table No 4.4.9 Liquidity And Solvency Ratios Analysis Chart No 4.4.9 Liquidity And Solvency Ratios Analysis INFERENCE The above diagram explains that current ratio of the company in which FY08 the level of current ratio was 6.46 because of the company brows Rs 22.25Crs of loans and advances. But it was increased to Rs 121Cr in FY12 so that reasons the level could be decreased to 2.02 in FY12. The
  • 65.
    Quick ratio alsodecreased same reasons. Debtors turnover ratio denotes that 7.56times in FY08 but it was increased to 5.58times due to the level of sundry debtors level has been increased in FY12. 4.4.10 FINANCIAL HIGHLIGHTS OF ARSHIYA INTERNATIONAL LTD v In the FY2011 the company increases their capital by way of issued as bonus share to its share holders. v The reserve of the company shows that continuously increased over the past five years. In the FY12 company retains their funds to 7.06% in the previous year Rs 502.62Crs. so its value of the company could be increase in upcoming years hence an investor can invest their money in this company strongly v The net worth of the company also increased due to wide area of operation could be carried over the world wide. Now the company has worth of Rs553Crs. v During the year the company borrows short term funds from banks for the purpose of increase their working capital position of the firm. In FY12 company borrows Rs.1006Crs. against of FY11 Rs 655.65Crs v In the FY2011 company brought freehold land, vehicles, plant and equipments with worth of Rs 330Crs. It is increased to Rs602 Cr in the financial years. From this denotes that the company have good value in market v The company does not maintain any inventories over the last financial years v The level of sundry debtors could be increased over the years in the FY12 records Rs 121 Cr in the previous year Rs 95Crs v The company also lends loan and advances for its subsidiaries for the purpose of expand its operations v The net current asset of the company increase over the past financial years currently the company hold the worth of the Rs 400Cr v The company records a best sales performance over the past financial years. in the FY2008 the sales level was Rs201.Crs on the other hand the level of sales could be increased up to 21% it reach at Rs. 256Crs in the FY2009. Even though the company have good sales in the FY2012 it records Rs592Crs due to expand their business over the
  • 66.
    years. v The netincome of the company also increased over the past financial years in the FY12 the current net income is stood at Rs630Crs v In this accounting period the company borrows more funds from outsider it results in payment of the more interest to creditors. In the financial years the company pay Rs 80Crs but in the previous year Rs 31Crs v The above balance sheet explains about the tax could be paid by the company is high compare to previous years. In the FY12 the company pay Rs. 21 Cr. as tax to Indian govt v The Earning Per Share of the company increases over the financial years in year 2010 EPS was Rs2.64 but the next financial year 2011 the EPS could be increased to Rs 4.42 finally the value of EPS in the FY12 reach at Rs 8.08 because of the the company has more retains their earnings v In the year 2012 the company declares the 70% as dividend for the equity shareholders. But in FY08 they declared 40% only the face value of Rs 2 per share. v The book value of the share shows that continuous improvement over the years now the company’s book value is Rs 93 the original value of share’s face value is Rs 2 only v During the year under report / review, seven step down subsidiaries of the Company, viz. Arshiya Southern Domestic Distripark Ltd., Arshiya Eastern Domestic Distripark Ltd., Arshiya Western Domestic Distripark Ltd., Arshiya Central Domestic Distripark Ltd., Arshiya Exim Trading Ltd., Arshiya Eastern FTWZ Ltd., Arshiya Western FTWZ Ltd. have ceased to be step down subsidiaries of this Company.Further, another step-down subsidiary of your Company, Cyberlog Technologies Inc., USA has been dissolved. v The face value of the company share is Rs 2.00 there is no change in capital structure in past five years v The company declared Rs 0.80 in FY2008. It was increased in FY12. The company recommended Rs1.40 in FY12 v Operating profit was continuously improved over the year. In FY12 the company had 87% contribute as operating profit. v Gross profit margin level has been increased due to company operate wide area in India it results in increase in gross profit level, in FY12 the company’s Gross profit margin stood at 84.4%
  • 67.
    v The netprofit margin represents that relationship between net profit and total net sales where as the company’s net profit margin in FY2010 5.5% it was increased to 7.54% in FY12 because of increased in sales of the company 4.1.11 SWOT ANALYSIS- ARSHIYA INTERNATIONAL LTD Strength ü India’s first Free Trade and Warehousing Zone (FTWZ) ü The FTWZ is a deemed foreign territory with tax exemptions ü state-of-the-art equipment state-of-theart equipment along with convenient siding and customized wagons ü information technology is a completely- integrated system ü have more subsidiary companies Weakness ühigh cost of operation it result in decreased in net profit üFace heavy competition with its competitors like CONCORE, DHL, TNT etc. ü Fluctuation in foreign exchange rate. ü Government influence on import and export policies. Opportunities ü The transportation sector in India is still dominated by the road segment which accounts for 65% of the total freight traffic followed by railway which accounts for about 30%. Due to higher dependence on roadways, logistics industry efficiency gets affected due to traffic bottlenecks; delay in clearing of trucks, etc. Thus dependency on road makes hinterland cargo movement more expensive and inefficient. India burns nearlyUS$2.5 billion worth of fuel on account of trucks standing idle on state checkposts Threats ü Poor infrastructure like road, rail road, IT ü 100% FDI allowed its leads entrance of foreign player in india
  • 68.
    Table No 4.4.10SWOT Analysis- Arshiya International 4.5 Aegis Logistics Ltd Aegis Logistics Ltd is a leader in Oil, Gas and Chemical Logistics. The company is engaged in providing logistic solutions for Oil, Gas, Chemicals and Petrochemical Industries. With their strategic locations and indispensable services, Aegis is a key supplier for total supply chain management services to major customers including Oil PSUs. The company presently has three operating port terminals, two in Mumbai and one in Kochi, as well as two state of the art gas terminals at Mumbai & Pipavav through which they handle annually over 2 million MT of Oil, Gas and Petroleum products as well as around 400,000 MT of LPG and Propane gas. Aegis Logistics Ltd was incorporated on June 30, 1956 as a private limited company with the name Atul Drug House Ltd. In the year 1962, the company installed their first plant for the manufacture of formaldehyde and hexamine at Kandla. In the year 1967, they installed another plant at Capi near Bulsar in Gujarat State for the manufacture of 14,400 tonnes of formaldehyde and 540 tonnes of hexamine per annum. In the year 1970, the company installed at Vapi a plant for the manufacture of Pentaerythritol formaldehyde with a capacity of 1,200 tonnes per annum with the technical know- how supplied by Joset Meissner of W.Germany. In September 14, 1976, the name of the company was changed to Atul Chemical Industries Ltd. Also, they became a public limited company. The name of the company was again changed from Atul Chemical Industries Ltd to Aegis Logistics Ltd. In the year 1999, the Petrochemicals Division was hived off to Perstorp Aegis Chemicals Ltd, (PACL) a joint venture company between the company and Perstorp AB, Netherlands. During the year 2007-08, as per the scheme of arrangement (SoA), Throughput Activity Undertaking of Hindustan Aegis LPG Ltd was de-merged and transferred to the company with effect from the appointed date, April 01, 2007.
  • 69.
    During the year2008-09, Tapi Finvest India Pvt Ltd was amalgamated with the company. During the year 2009-10, the company entered into a strategic alliance with Essar Oil Ltd which entails a reciprocal arrangement wherein both the companies would sell each other fuels through their retail outlets. In April 1, 2010, the company acquired 100% shareholding in Shell Gas (LPG) India Pvt Ltd. Consequently, SGLIPL became wholly owned subsidiary with effect from April 1, 2010. Also, the name of SCLIPL was changed to Aegis Gas (LPG) Pvt Ltd (AGPL). During the year 2010-11, the company was awarded the Operations & Maintenance (O&M) contract for the product storage and dispatch operations of Bharat Oman Refinery Ltd (BORL) at Bina in Madhya Pradesh signifying the Aegis expertise of the company in Liquid Logistic and Operations & Maintenance. Also, Aegis Gas (LPG) Pvt Ltd (AGPL), the wholly owned subsidiary of the company acquired 100% equity shares of Hindustan Aegis LPG Ltd (HAL PG), from its erstwhile shareholders. Consequently, HAL PG ceased to be an associate and became a wholly owned subsidiary of AGPL. In November 2010, the company entered into a major deal with APM Terminals Pipavav to avail on sub-lease close to 100 acres of land for building a global oil and petrochemicals storage complex. The company will invest up to Rs 400 crore ($90m) in building a 600,000 KL oil terminal complex in Port Pipavav. With the announcement of this project, the company's liquids capacity will rise from 300,000 KL to over 1 million KL. The company's strategy of building a 'necklace' of port terminals around India's coastline from Pipavav to Haldia to Kochi, inland oil terminals to service the national oil companies and developing a retail distribution network for the LPG business is proceeding at a steady pace.
  • 70.
    4.5.1 General Reservesof Aegis Logistics Ltd Particulars 2008 2009 2010 2011 2012 Reserves (In Cr) 137.64 154.91 167.47 230.93 264.23 Table No. 4.5.1 General Reserves of Aegis Logistics Ltd Chart No. 4.5.1 General Reserves of Aegis Logistics Interpretation The above diagram explains about the reserves and surplus of Aegis logistics Ltd have Rs 137.64 Cr in the FY08 it was increased by 17.15Cr in the FY09. In FY12 the company records the 12.60% growth than the value of the reserves is Rs 264.23 Cr. Over the years the company have retain more sources so that reasons the investor can make invest in this company strongly because the company growth in upcoming years 2008 2009 2010 2011 2012 0.00 50.00 100.00 150.00 200.00 250.00 300.00 137.64 154.91 167.47 230.93 264.23
  • 71.
    should be increasedue to the Indian government give more importance for exports & imports. The company also utilize the fund for further expansion their business over the world wide from which they attain competitive position in the field. 4.5.2 Net worth of Aegis Logistics Ltd Particulars 2008 2009 2010 2011 2012 Networth (In Crs) 157.55 174.70 186.24 264.33 297.63 Table No. 4.5.2 Net worth of Aegis Logistics Chart No. 4.5.2 Net worth of Aegis Logistics Interpretation The above diagram explains about the net worth of Aegis Company in which the company performs over the year shows good results.
  • 72.
    Net worth includesshare capital and reserve of the company. The company has good net worth in over the years. In the year 2010 the value of net worth was Rs 186.24Cr high in FY2011 up to Rs. 264.33Cr with 42% 12.6% could be increased from in the year 2011 it stood at Rs 297.63Cr It is clear that investors can invest their fund in this company so that way it will grow in future. 4.5.3 Net sales of Aegis Logistics Ltd Particulars 2008 2009 2010 2011 2012 Net Sales 373.88 368.33 284.67 258.14 283.5 Table No. 4.5.3 Net sales of Aegis Logistics Chart No 4.5.3 Net sales of Aegis Logistics Interpretation 2008 2009 2010 2011 2012 0 50 100 150 200 250 300 350 400 373.88 368.33 284.67 258.14 283.5
  • 73.
    The above diagramexplains about the net sales of the Aegis Company in FY2008 it was records Rs. 373.88Crs. But in the FY2009 it comes down to Rs 368.33Crs. In the financial year 2010 the net sale was again reduced 83%. Later the company record good results in the FY12 is Rs 283.5 Cr in previous year was Rs 258.14cr Meanwhile the company have face lot of challenges because of change in government policies in supply chain and the company target only gas and oil so that reason the sales could be variation over the past financial fiscals 4.5.4 Profit analysis of Aegis Logistics Ltd Particulars 2008 2009 2010 2011 2012 PBDIT 63.19 52.23 67.14 65.24 70.19 PBDT 59.07 46.05 59.1 55.09 59.88 Profit Before Tax 50.11 36.88 49.43 44.35 47.95 Net Profit 39.09 30.37 38.94 31.22 41.06 Table No. 4.5.4 Profit analysis of Aegis Logistics Chart No 4.5.4 Profit analysis of Aegis Logistics Interpretation
  • 74.
    The above diagramexplains about the profit of the Aegis Company Ltd in the PBDIT, PBDT, PBT, Net Profit indicates some variation in the last five years. It explains about the poor efficiency of the firm because the company does not adopt constant strategy. As a researcher point of view, the company should be clearly defined its path in order to achieve the better performance. 4.5.5 Earning per Share of Aegis Logistics Ltd Particulars 2008 2009 2010 2011 2012 Earning Per Share (Rs) 19.61 18.43 20.71 9.35 12.29 Table No. 4.5.5 Earning per Share of Aegis Logistics Chart No. 4.5.5 Earning per Share of Aegis Logistics Interpretation 2008 2009 2010 2011 2012 0 5 10 15 20 25 19.61 18.43 20.71 9.35 12.29 Earning Per Share (Rs)
  • 75.
    The above diagramexplains about the EPS of the Aegis Logistics Ltd in year 2008 it have Rs 19.61 it plunged to 20.71 in FY2010. Due to variation in the sale, reflect in the EPS of the company could be down to Rs 9.35. currently the company has the EPS of Rs 12.29. Hence the upcoming years the company has to plan to expands their business all over the nation so value of the company will be increased in future 4.5.6 Book value (In Rs) of Aegis Logistics Ltd Particulars 2008 2009 2010 2011 2012 Book Value (Rs) 79.01 103.99 99.05 79.14 89.11 Table No. 4.5.6 Book value (In Rs) of Aegis Logistics Chart No. 4.5.6 Book value (In Rs) of Aegis Logistics Interpretation
  • 76.
    The book valueof the company share in FY12 stood at Rs. 89.11. But in FY2009 the company had Rs 104 because of they have more reserves later the company utilize its fund for expand their operation so that reason the book value could be down in the year 2010 and 2011. 4.5.8 PROFITABILITY RATIOS Particulars 2008 2009 2010 2011 2012 Operating Profit Margin(%) 16.38 12.78 20.49 22.2 21.99 Gross Profit Margin(%) 13.98 10.29 17.09 18.04 17.99 Net Profit Margin(%) 10.39 8.09 13.38 11.73 13.96 Return On Capital Employed(%) 27.7 21.94 20.88 16.58 16.15 Return On Net Worth(%) 24.81 17.72 20.9 11.8 13.79 Return on Long Term Funds(%) 27.7 22.31 22.14 17.29 18.06 Table No 4.5.8 Profitability Ratios
  • 77.
    Chart No 4.5.8Profitability Ratios INFERENCE The operating profit margin of the aegis logistics continuously increased over the past five years currently the company records 21.99%. Gross Profit Margin increased due to increase in total sales. Net Profit Margin was stood at 13.96% it was increased from 11.73% in previous year. 4.5.9 Liquidity And Solvency Ratios Particulars 2008 2009 2010 2011 2012 Current Ratio 1.66 1.3 1.59 1.81 1.21 Quick Ratio 1.5 1.22 2.18 2.41 2.28 Debt Equity Ratio 0.25 0.17 0.41 0.24 0.27 Long Term Debt Equity Ratio 0.25 0.17 0.33 0.19 0.13 Table No 4.5.9 Liquidity And Solvency Ratios 2008 2009 2010 2011 2012 0 5 10 15 20 25 30 Operating Profit Margin(%) Gross Profit Margin(%) Net Profit Margin(%) Return On Capital Employed(%) Return On Net Worth(%) Return on Long Term Funds(%)
  • 78.
    Chart No4.5.9 LiquidityAnd Solvency Ratios INFERENCE The above diagram explains about the Liquidity ratio and solvency ratio of Aegis Logistics Ltd where as there is slight variation on current ratio over five years. Quick ratio increased over the years but in FY12 the company has 2.28:1 of quick ratio. Debt Equity Ratio denotes the company use only owner’s funds over the years. Long term debt Equity ratio was 0.13X in 2012. It was in 0.13 times in 2011 4.5.10 Financial highlights of Aegis Logistics Ltd • In the FY2009, the company had buy back total of 10,20,473 equity shares at price not exceeding Rs.143 per share through open market transactions for an aggregate amount of Rs. 3.47Cr consequently the issue and paid up equity shares capital of the company stands reduced to Rs. 16.44Cr. • In the FY2010, the company had issued and allotted 12506710 equity shares at Rs.10 per share as bonus share in the proportions of two share for every existing 3 fully paid up 2008 2009 2010 2011 2012 0 0.5 1 1.5 2 2.5 3 Series 1 Series 2 Current Ratio Quick Ratio
  • 79.
    shares so thatreasons the company shares value stood at Rs.33.40 till current financial year 2012. • The reserves and surplus of the company shows that an excellent performance over the past five years. In the FY2011 shows that abnormal growth up to 37.89% increased, in FY2012 the reserves and surplus could be stood at 14% in past five years the company shows 91% they retain their earnings for future expansions. • The company spent their resources for buying more plant & equipments in FY12 spent up to Rs.464Crs and vehicles brought about 45.43Crs. But also intangible assets like computer software it acquires up to Rs. 81Crs. From this point of view, the company adopts new technologies • Aegis logistics ltd’s investment parameters shows that there is an up down movements in FY2011 Rs 94.53Cr its was increased from 122% in the previous year. But in FY2012, the level could be increased up to 27% about Rs27.23Crs • Inventories are valued at cost or net realizable Value whichever is less. Cost is determined by using the first in first out formula. Cost comprises all costs of purchase, cost of conversion and cost incurred to bring inventories to their present location and condition other than those subsequently recoverable by company form tax authorities. • The level of sundry debtors value could be increased over the past five years in FY12 is shows that Rs.31.41Crs • Aegis company adopts just in time inventory concept in which they would not focus on inventories because all material in movements. So the inventory level continuously decreased. • Aegis Company they deposit level could be increased over the past performance in this way the firm deposit their amount in banks for increase the current ratio position in the markets. • The firm lends loans and advances to their subsidiaries and other government deposit in FY12 they provide Rs.81.14Crs. • Meanwhile the total current asset could be increased up to Rs 30.63crs. Due to increased interest accrued on fixed deposits, unamortized interest on buyers’ credit & premium on Option contracts, unamortized premium on share and Debentures increased to Rs 5crs. • The company short term borrowings could be increased still it stood at Rs.12.99Crs
  • 80.
    • The currentliabilities of aegis shows that fluctuation over the past five years in the FY12 the company increased about Rs 14.27 Crs • The company had a continuous poor performance on sales over the past four years. In FY12 that records 10% slight growth in sales. • Due to low production that one reason for reduction in decline in sales in past four years. •During the year the company has registered income from operation of Rs. 62.36Crs.as compared to Rs. 57.32Crs In FY2011. • Profit before Depreciation Interest and Tax (PBDIT) has increased Rs 4.95Cr. For the year ended March 31, 2011 PBDIT was Rs.65.24 Cr. It showing an increase of 7.5%. During FY2012, the company has recorded PBDIT of Rs 70.19Crs of the income from operation as against -2% during FY2011. •In the year 2008, the company performs Rs39.09Cr level of net profit in FY09 it was decreased of Rs. 8Crs then stood at Rs.30.37Crs. in the FY10 the level of profit could be increased 28%. Finally in the FY12 the company records the Rs41.06Crs. It was increased from 31% in the past FY11. •The book value of the company shows that there is a fluctuation in over past financial years. Now it stand at Rs 89.00 •EPS calculation made over the years indicate whether or not the firm’s earnings on per share basis has changed over the period under this case the company EPS shows that some variation over the past five financial years. In FY12, Aegis company EPS stood at Rs. 12.29 the face value is Rs 10 only. • The company recommends the dividend of Rs 6.68 in FY12. It was 20 % low compare to previous financial year 2011. • The gross profit ratio reflects the efficiency with which management produce each unit of product. This is explaining about the relative to sales after the deduction of production costs, and indicates the relation between production costs, and selling price. Under this case aegis record over the past financial years it shows good results it increase to 22% in FY12 • The ratio of return of net worth was in FY2008 was 13.79% it was increased in FY12 was stood at 27.70%
  • 81.
    • The companyrecommends Rs 2.50 in FY12. Due to retains their resources as general reserves. • Net profit margin ratio means a relationship between net profit and sales and indicates management’s efficiency in manufacturing, administering and selling products. In aegis company’s net profit margin indicate that some variations in past five years. In FY12 it stands at 13.96% it was increased from pervious financial years 11.73%. • The current ratio of aegis’s company shows that there is constant position over the years. • Number of days in working capital in the FY12 is increased because of the lot of completion in the markets. So the working capital cycle now in 144 days. 4.5.11 SWOT Analysis of Aegis Logistics Ltd
  • 82.
    Strength ü Strong brandimage. ü Quality and reliability. ü A leader in Oil, Gas and Chemical Logistics ü Direct delivery capability ü Strength market position in west India segment like Karnataka, Maharashtra, Gujarat. Weakness ü Government influence over price of oil, gas and chemical ü Bad infrastructure in India like road, communication, port Opportunities ü Could seek better supplier deals üLarge, potential domestic and international ü to utilize their general reserve for future expansion ü company can enter in to east India segment Threats ü Competition from low quality from local terminals ü LPG domestic sector subsides continue to eat into margins and sales as domestic cooking gas gets illegally diverted into other market segment such as autogas and commercial cylinder. ü Bad infrastructure facilities in India. Table No 4.5.11 SWOT Analysis of Aegis Logistics
  • 83.
    1.6 COMPETITIVE ADVANTAGESANALYSIS 4.6.1 RESERVE AND SURPLUS OF INDUSTRY Company Name Reserve and Surplus 2008 2009 2010 2011 2012 Aegis Logistics 137.64 154.91 167.47 230.93 264.23 Allcargo Logistics 361.65 443.53 765.18 951.68 1113.16 Aqua Logistics 28.48 44.52 206.47 493.61 491.56 Arshiya International 445.23 475.36 483.91 502.62 540.81 Container Corporation of India 3118.93 3632.23 4206.42 4847.83 5476.45 Industries Average 818.39 950.11 1165.89 1405.33 1577.24 Table No 4.6.1 Reserve and Surplus of Industry Chart No 4.6.1 Reserve and Surplus of Industry Inference The above diagram explain about the reserve and surplus of the logistics industry in which the Container Corporation of India has more resources compare to its competitors
  • 84.
    1.1.2 NET WORTHOF INDUSTRY Company Name Networth 2008 2009 2010 2011 2012 Aegis Logistics 157.55 174.70 186.24 264.33 297.63 Allcargo Logistics 385.51 496.87 791.79 979.01 1140.14 Aqua Logistics 39.94 57.44 227.01 523.61 521.56 Arshiya International 458.97 490.1 496.84 514.89 552.58 Container Corporation of India 3183.92 3762.21 4336.40 4977.81 5606.43 Industries Average 845.178 996.264 1207.656 1451.93 1623.668 Table No 4.6.2 Net Worth Of Industry Chart No 4.6.2 Net Worth Of Industry Inference The diagram explain about the net worth of industries where as the average of industries could be increased over the past five years. In which the Container Corporation of India has greater than the average. The remaining companies have the below the average. Allcargo Logistics have the chance to prosperity in future. But Aegis performs similar result over the 2008 2009 2010 2011 2012 0.00 1000.00 2000.00 3000.00 4000.00 5000.00 6000.00 7000.00 Aegis Logistics Allcargo Logistics Aqua Logistics Arshiya International Container Corporation of India Series 6 Series 7 Series 8 Series 9 Series 10
  • 85.
    years. 1.1.3 SALES Company Name NetSales 2008 2009 2010 2011 2012 Aegis Logistics 373.88 368.33 284.67 258.14 283.5 Allcargo Logistics 361.25 516.79 516.76 699.84 1,079.43 Aqua Logistics 108.99 213.4 322.01 380.88 310.35 Arshiya International 201.91 256.39 273.61 453.01 592.63 Container Corporation of India 3347.30 3417.16 3705.68 3828.12 4060.95 Industries Average 878.666 954.414 1020.546 1123.998 1265.372 Table No 4.6.3SALES Chart No 4.6.3SALES INFERENCE The diagram denotes that Net Sales of the overall industries the Container Corporation of India have good performance over the years it had more sales compare to the industries averages. Allcargo Logistics nearly touch the average in the FY12 then Arshiya International shows that 2008 2009 2010 2011 2012 0 500 1,000 1,500 2,000 2,500 3,000 3,500 4,000 4,500 5,000 Aegis Logistics Allcargo Logistics Aqua Logistics Arshiya International Container Corporation of India Industries Average
  • 86.
    beat performance inthe past five years. But Aegis and Aqua Logistics most horrible performance compare to other companies. 1.1.4 TOTAL INCOME Company Name Total Income 2008 2009 2010 2011 2012 Aegis Logistics 375.8 366.81 298.37 263.46 291.04 Allcargo Logistics 365.27 536.82 532.1 742.77 1130.49 Aqua Logistics 79.72 132.66 144.69 182.44 309.02 Arshiya International 207.26 266.21 280.03 474.75 630.01 Container Corporation of India 3506.02 3620.73 3869.75 4001.57 4377.49 Industries Average 906.814 984.646 1024.988 1132.998 1347.61 Table No 4.6.4 Total Income Chart No 4.6.4 Total Income INFERENCE The diagram explains about the total income of the companies. The industries average of in the year 2012 Rs. 1347.61Crs but the Container Corporation of India sales corresponding year is Rs. 4377Crs their contribution is highest than other companies. The Allcargo shows also near 2008 2009 2010 2011 2012 0 1,000 2,000 3,000 4,000 5,000 6,000 7,000 8,000 Aegis Logistics Allcargo Logistics Aqua Logistics Arshiya International Container Corporation of India Series 6 Series 7 Series 8 Series 9 Series 10
  • 87.
    to the average.But Aegis company performance has the variation over the five years even its below the average. While compare to total income of the industry. The Container Corporation of India has the competitive advantage in the industries. 1.1.5 Operating Profit Company Name Operating Profit 2008 2009 2010 2011 2012 Aegis Logistics 61.27 47.09 58.34 57.32 62.36 Allcargo Logistics 79.72 132.66 144.69 182.44 309.02 Aqua Logistics 12.77 22.35 32.91 35.76 15.78 Arshiya International 14.03 20.7 22.16 53.13 128.65 Container Corporation of India 890.73 931.12 961.97 1002.69 1023.73 Industries Average 211.704 230.784 244.014 266.268 307.908 Table No 4.6.5Operating Profit Chart No 4.6.5Operating Profit INFERENCE 2008 2009 2010 2011 2012 0 200 400 600 800 1,000 1,200 1,400 1,600 1,800 Aegis Logistics Allcargo Logistics Aqua Logistics Arshiya International Container Corporation of India Industries Average
  • 88.
    The above diagramexplains the operating profit of the industries. This ratio used to discuss the general profitability of the concern. The Container Corporation of India more than the industry average it shows that more efficiency firm. Allcargo Company is near to the average in the year 2012. But the balance three companies much could be improves its performance because it denotes lower efficiency. 1.1.6 PBIDT Company Name PBDIT 2008 2009 2010 2011 2012 Aegis Logistics 63.19 52.23 67.14 65.24 70.19 Allcargo Logistics 83.74 152.69 160.03 225.37 360.08 Aqua Logistics 13.19 23 32.8 36.61 17.36 Arshiya International 19.38 30.52 28.58 74.87 166.03 Container Corporation of India 1049.45 1134.69 1126.04 1176.14 1340.27 Industries Average 245.79 278.626 282.918 315.646 390.786 Table No 4.6.6 PBIDT Chart No 4.6.6 PBIDT 2008 2009 2010 2011 2012 0 200 400 600 800 1,000 1,200 1,400 1,600 Aegis Logistics Allcargo Logistics Aqua Logistics Arshiya International Container Corporation of India Industries Average
  • 89.
    INFERENCE The diagram denotesthe Profit Before Depreciation Interest and Taxes of the companies where as Container Corporation of India is more than the company average. Other companies are below the average in which Allcargo is in the year 2012 near to the average. 1.1.7 PROFIT BEFORE TAX Company Name Profit Before Tax 2008 2009 2010 2011 2012 Aegis Logistics 50.11 36.88 49.43 44.35 47.95 Allcargo Logistics 66.96 109.11 106.19 157.26 220.49 Aqua Logistics 8.8 17.11 26.14 25.48 1.71 Arshiya International 18.02 28.14 22.26 36.35 69.19 Container Corporation of India 942.87 1018.72 990.85 1030.61 1181.78 Industries Average 217.352 241.992 238.974 258.81 304.224 Table No 4.6.7 Profit Before Tax 2008 2009 2010 2011 2012 0 200 400 600 800 1,000 1,200 Aegis Logistics Allcargo Logistics Aqua Logistics Arshiya International Container Corporation of India Series 6 Series 7 Series 8 Series 9 Series 10
  • 90.
    Chart No 4.6.7Profit Before Tax INFERENCE The Profit Before Taxes is the difference between profit before interest and taxes and interest charge (PBT=PBIT-INT). PBT may also include non-operating profit. Whereas the above diagram explains that the Container Corporation of India earns more PBT. The other companies never touch the companies’ averages. 1.1.8 NET PROFIT Company Name Net Profit 2008 2009 2010 2011 2012 Aegis Logistics 39.09 30.37 38.94 31.22 41.06 Allcargo Logistics 59.78 92.67 97.81 121.13 184.07 Aqua Logistics 5.61 11.15 20.54 22.39 1.15 Arshiya International 12.36 18.49 15.4 24.93 47.51 Container Corporation of India 752.21 791.2 786.69 875.95 877.88 Industries Average 173.81 188.776 191.876 215.124 230.334 Table No 4.6.7 Profit Before Tax 2008 2009 2010 2011 2012 0 100 200 300 400 500 600 700 800 900 Aegis Logistics Allcargo Logistics Aqua Logistics Arshiya International Container Corporation of India Series 6 Series 7 Series 8 Series 9 Series 10
  • 91.
    4.6.7 Profit BeforeTax INFERENCE The diagram explains about Net Profit of the company in which Container Corporation of India is earn more profit compare to its overall companies. It have the competitive advantage in the market. All cargo in the year 2012 near to industries average so it have superior growth upcoming years 1.1.9 EARNING PER SHARE Company Name Earning Per Share (Rs) 2008 2009 2010 2011 2012 Aegis Logistics 19.61 18.43 20.71 9.35 12.29 Allcargo Logistics 29.51 41.44 7.84 9.28 14.1 Aqua Logistics 4.9 8.63 10 0.75 0.04 Arshiya International 2.17 3.15 2.62 4.24 8.08 Container Corporation of India 115.74 60.87 60.52 67.39 67.54 Industries Average 34.386 26.504 20.338 18.202 20.41 Table No 4.6.9 Earning Per Share
  • 92.
    Chart No 4.6.9Earning Per Share INFERENCE The profitability of the shareholders’ investments can also be measured in this way like EPS. It indicate whether or not the firm’s earning power on per share basis has changed over the period. The diagram shows that the Container Corporation of India has more earning per share compare to its companies. The others are below the companies’ average 1.1.10 NET PROFIT MARGIN (%) Company Name Net Profit Margin(%) 2008 2009 2010 2011 2012 Aegis Logistics 10.39 8.09 13.38 11.73 13.96 Allcargo Logistics 16.48 17.76 18.5 16.79 16.28 Aqua Logistics 5.14 5.22 6.37 5.85 0.36 Arshiya International 5.94 7 5.45 5.25 7.54 Container Corporation of India 21.45 21.92 20.32 21.88 20.05 Industries Average 11.88 11.998 12.804 12.3 11.638 Table No 4.6.10 Net Profit Margin 2008 2009 2010 2011 2012 115.74 60.87 60.52 67.39 67.54 Aegis Logistics Allcargo Logistics Aqua Logistics Arshiya International Container Corporation of India
  • 93.
    Chart No4.6.10 NetProfit Margin INFERENCE Net Profit Margin ratio establishes a relationship between net profit and sales and indicates management’s efficiency in manufacturing, administering and selling products. This ratio is the overall measure of the firm’s ability to turn each rupee sales into profit. If the net margin is inadequate, the firm will fail to achieve satisfactory return on shareholder’s funds. Whereas the diagram explains that Container Corporation of India have more efficiency compare to other companies. The other companies’ performances are below the average of the industries. 1.1.11Current Ratio Company Name Current Ratio Company Name 2008 2009 2010 2011 2012 Aegis Logistics 1.66 1.3 1.59 1.81 1.21 Allcargo Logistics 1.55 3.33 2.98 2.65 2.08 Aqua Logistics 5.06 5.95 2.75 5.89 3.26 Arshiya International 6.46 0.75 1.3 1.27 2.02 Container Corporation of India 2.65 2.66 3.03 3.63 4.15 Industries Average 3.476 2.798 2.33 3.05 2.544 Table No 4.6.11 Current Ratio 2008 2009 2010 2011 2012 21.45 21.92 20.32 21.88 20.05 Aegis Logistics Allcargo Logistics Aqua Logistics Arshiya International Container Corporation of India Series 6 Series 7 Series 8 Series 9 Series 10
  • 94.
    Chart No 4.6.11Current Ratio INFERENCE The current ratio is a measure of the firms’ short term solvency. As conventional rules, a current ratio of 2:1 or more is considered satisfactory. Whereas the diagram explains about the current ratio of the companies in which the Container Corporation of India have the grater the margin of safety. But Aegis Logistics company ratio indicates that inadequate margin of safety for creditors. Arshiya International have the variation over the past five years later in the FY12 company has good performance. Allcargo has also records good performance over the years 4.7 BRIEF HISTORY OF BOSTON CONSULTANCY GROUP The Boston Consulting Group was started up in 1963 by Bruce Henderson and from its inception sought to establish itself in the planning and was considered the pioneer of Business Strategy analysis. Boston Consulting Group was founded as the Management and Consulting Division of the Boston Safe Deposit and Trust Company - a subsidiary of The Boston Company. In 1968, The Boston Company spinned off BCG as a separate subsidiary. In 1965 Henderson thought that to survive, much less grow, in a competitive landscape occupied by hundreds of larger and better-known consulting firms, a distinctive identity was needed, 2008 2009 2010 2011 2012 0 1 2 3 4 5 6 Aegis Logistics Allcargo Logistics Aqua Logistics Arshiya International Container Corporation of India Series 6 Series 7 Series 8 Series 9 Series 10
  • 95.
    and pioneered "BusinessStrategy" as a special area of expertise for BCG.As his client list grew, Henderson targeted the nation's best business schools. At some point he was said to have eclipsed McKinsey as the top recruiter at Harvard, aggressively wooing its best students with high salaries and the chance to make a difference in a cutting-edge firm. He encouraged the brilliant young minds he hired to come up with innovative ideas that were meant to dazzle hardened corporate veterans. In 1973 Bill Bain and others left BCG to form Bain & Company, and two years later Henderson arranged an employee stock ownership plan (ESOP), so that the employees could take the company independent from The Boston Safe Deposit and Trust Company. The buyout of all shares was completed in 1979. In 1998 BCG created The Strategy Institute. Its purpose is to enrich the firm's strategic thinking by applying insights from a variety of academic disciplines to the strategic challenges facing both business and society. The Boston Consulting Group (BCG) ranked 8th overall and first among smaller companies in Fortune Magazine's 2007 "100 Best US Companies to Work For" survey, based on strong employee development, a supportive culture, and progressive benefits. 4.7.1 BCG Growth-Share Matrix In the late 1960’s a consultant for the Boston Consulting Group presented his ideas about ‘cash deficient’ and ‘growth deficient’ businesses and the need for a balance between cash generators and cash users. In the late 1960’s the Boston Consulting Group developed a portfolio business model based on this thinking. The model, the BCG matrix or growth/share matrix, was based on the Boston Consulting Group’s knowledge and work in the area of the experience curve and of the product life cycle and how they relate to cash generation and cash requirements.
  • 96.
    The growth-share matrixwas intended to analyse a portfolio from a corporate perspective because it is only at that level that cash balance is meaningful. A business may, however, be segmented further using this diagnostic tool to understand the positions of its various product lines or market segments. This portfolio can therefore be made up of products in a multi-product company, divisions in a multidivisional company and companies in a conglomerate. The BCG Growth-Share Matrix is based on the observation that a company's business units can be classified into four categories based on combinations of market growth and market share relative to the largest competitor, hence the name "growth-share". Market growth serves as a proxy for industry attractiveness, and relative market share serves as a proxy for competitive advantage. The growth-share matrix thus maps the business unit positions within these two important determinants of profitability The BCG Growth-Share Matrix positions the various SBUs/product lines on the basis of Market Growth Rate and Market Share relative to the most important competitor as shown below; Relative market share This indicates likely cash generation, because the higher the share the more cash will be generated. As a result of 'economies of scale' (a basic assumption of the BCG Matrix), it is assumed that these earnings will grow faster the higher the share. The exact measure is the brand's share relative to its largest competitor. Thus, if the brand had a share of 20 percent, and the largest competitor had the same, the ratio would be 1:1. If the largest competitor had a share of 60 per cent, however, the ratio would be 1:3, implying that the organization's brand was in a relatively weak position. If the largest competitor only had a share of 5 per cent, the ratio would be 4:1, implying that the brand owned was in a relatively strong position, which might be reflected in profits and cash flows. If this technique is used in practice, this scale is logarithmic, not linear. On the other hand, exactly what is a high relative share is a matter of some debate. The best evidence is that the most stable position (at least in FMCG markets) is for the brand leader to have a share double that of the second brand, and triple that of the third. Brand leaders in this position tend to be very stable - and profitable.
  • 97.
    The reason forchoosing relative market share, rather than just profits, is that it carries more information than just cash flows. It shows where the brand is positioned against its main competitors, and indicates where it might be likely to go in the future. It can also show what type of marketing activities might be expected to be effective. Market growth rate Rapidly growing brands, in rapidly growing markets, are what organizations strive for; but the penalty is that they are usually net cash users - they require investment. The reason for this is often because the growth is being 'bought' by the high investment, in the reasonable expectation that a high market share will eventually turn into a sound investment in future profits. The theory behind the matrix assumes, therefore, that a higher growth rate is indicative of accompanying demands on investment. The cut-off point is usually chosen as 10 per cent per annum. Determining this cut-off point, the rate above which the growth is deemed to be significant (and likely to lead to extra demands on cash) is a critical requirement of the technique; and one that, again, makes the use of the BCG Matrix problematical in some product areas. What is more, the evidence, from FMCG markets at least, is that the most typical pattern is of very low growth, less than 1 per cent per annum. This is outside the range normally considered in BCG Matrix work, which may make application of this form of analysis unworkable in many markets. Where it can be applied, however, the market growth rate says more about the brand position than just its cash flow. It is a good indicator of that market's strength, of its future potential (of its 'maturity' in terms of the market life-cycle), and also of its attractiveness to future competitors. It can also be used in growth analysis. Resources are allocated to business units according to where they are situated on the grid as follows: Dog - a business unit that has a small market share in a mature industry. A dog may not require substantial cash because dogs have low market share and a low growth rate and thus neither generate nor consume a large amount of cash, and dogs are cash traps because of the money tied up in a business that has little potential and the capital that could better be deployed elsewhere. Unless a dog has some other strategic purpose, such businesses are candidates for
  • 98.
    divestiture, and itshould be liquidated if there is little prospect for it to gain market share. Question Mark (or Problem Child) - a business unit that has a small market share in a high growth market. Question marks are growing rapidly and thus consume large amounts of cash, but because they have low market shares they do not generate much cash. The result is large net cash consumption. A question mark (also known as a "problem child") has the potential to gain market share and become a star, and eventually a cash cow when the market growth slows. If the question mark does not succeed in becoming the market leader, then after perhaps years of cash consumption it will degenerate into a dog when the market growth declines. Question marks must be analyzed carefully in order to determine whether they are worth the investment required to grow market share. Star - a business unit that has a large market share in a fast growing industry. Stars generate large amounts of cash because of their strong relative market share, but also consume large amounts of cash because of their high growth rate; therefore the cash in each direction approximately nets out. If a star can maintain its large market share, it will become a cash cow when the market growth rate declines. The portfolio of a diversified company always should have stars that will become the next cash cows and ensure future cash generation. If successful, a star will become a cash cow when its industry matures. Cash Cow - a business unit that has a large market share in a mature, slow growing industry. As leaders in a mature market, cash cows exhibit a return on assets that is greater than the market growth rate, and thus generate more cash than they consume. Such business units should be "milked", extracting the profits and investing as little cash as possible. Cash cows provide the cash required to turn question marks into market leaders, to cover the administrative costs of the company, to fund research and development, to service the corporate debt, and to pay dividends to shareholders. Because the cash cow generates a relatively stable cash flow, its value can be determined with reasonable accuracy by calculating the present value of its cash stream using a discounted cash flow analysis. Cash cows require little investment and generate cash that can be used to invest in other business units.
  • 99.
    Chart No 4.7.1BCG MATRIX 4.7.3 BCG ANALYSIS FOR LOGISTICS INDUSTRY IN INDIA MARKET SHARE & GROWTH OF SELECTED LOGISTICS COMPANIES IN 2012
  • 100.
    Company Name CompanyGrowth Market share in 2012 Aegis Logistics -24.17 4.48 Allcargo Logistics 198.80 17.06 Aqua Logistics 184.75 4.91 Arshiya International 193.51 9.37 Container Corporation of India 21.32 64.19 Table No 4.7.1 Market Share and Growth of companies Market shares and market growth are calculated from net sales of the companies. It covers five years periods. Chart No 4.7.2 Market Share of logistics companies in India Relative market share
  • 101.
    R el at iv e M a r k et G r o w t h HIGH LOW H I G H Stars QuestionMarks L O W Cash Cows Dogs Table No 4.7.3 BCG Matrix for Logistics Industry in India 1. Stars The stars though generate funds but need to be constantly invested into because their prospectus of becoming cash cows depends on the pre-requisite of them being the market leader. Container
  • 102.
    Corporation of India,Arshiya International comes this position in which the company take following strategic decision Market Development • The Allcrgo Logistics Company can develop new product to capture market share in the industry. Currently company hold high in growth due to earn more profit over the five years Market penetration • CONCORE can penetrate in to develop rail road to connect new cities, implement developed technologies • Arshiya International can improve their warehousing facilities to speed up the delivery time 2. Question marks Since they are the new entrants or strugglers in the market for major share where the market is changing at a high pace, efforts are being made to make sure that the gain on their market share. Arshiya International comes under this position Product development • To develop wide range of product in order to catch the new market in India also in aboard • To improve the 3PL segment it leads to increase the market growth 3. Cash cows
  • 103.
    Since the cowsneeded to be milked now and then, and efforts are to be made to ensure that they maintain the largest share in the market the following strategies are being adopted by Aegis Logistics Ltd Product development • CONCORE can develop their market into air cargo, to cover new market to increase its operation in order to maintain this position in this industry • CONCORE can develop market in pipe line logistics segment • The company can come in to cargo handling segment, warehousing, container etc • The company may enter in to 3PL in segment Concentric diversification The COCORE Company may add extra value to its existing product like new pipe line between new markets. Focus to India market segment like road segment, airways 4. Dogs They are run on breakeven point and in the eyes of an accountant they are not even viable. But can be important for synergies Aegis Logistics and Aqua Logistics comes under dog criteria in which the company deal with single segment so the company can diversify their business into various segment it increase their value in the marget. Divestments • The company can come in to cargo handling segment, warehousing, container etc • The company may enter in to 3PL in segment • The company can improve their operation by way of increase the market segment. 4.8 GE MATRIX FOR LOGISTICS INDUSTRY
  • 104.
    GE / McKinseyMatrix are strategic and marketing management tool used for portfolio analysis. Most of the time, this tool is used for analyzing the portfolio of products, services, and strategic business units. GE Matrix is similar to BCG Matrix and it is an extension of the BCG Matrix approach - multifactor portfolio analysis tool. The GE Matrix compares different businesses on "Business Strength" and "Market Attractiveness" variables, plus the size of the bubbles in the matrix represents the market size instead of business sales used in the BCG Matrix. The share of the market or business sales vs. market size is represented as pie chart inside the bubbles in the matrix. This allows business users to compare business strength, market attractiveness, market size, and market share for different strategic business units (SBUs) or different product offerings on one matrix or chart. 4.8.1 GE MATRIX - ALTERNATIVE POSITIONS & STRATEGIES The GE / McKinsey Matrix is divided into nine cells - nine alternatives for positioning of any SBU or product offering. Based on the strength of the business and its market attractiveness each SBU will have a different position in the matrix. Further, the market size and the current sales will distinguish each SBU. Based on clear understanding of all of these factors decision makers are able to develop effective strategies. The nine cells in the matrix can be grouped into three major segments: Segment 1: This is the best segment. The business is strong and the market is attractive. The company should allocate resources in this business and focus on growing the business and increase market share. Segment 1
  • 105.
    Segment 2: Thebusiness is either strong but the market is not attractive or the market is strong and the business is not strong enough to pursue potential opportunities. Decision makers should make judgment on how to further deal with these SBUs. Some of them may consume to much resources and are not promising while others may need additional resources and better strategy for growth. Segment 2 Segment 3: This is the worst segment. Businesses in this segment are weak and their market is not attractive. Decision makers should consider either repositioning these SBUs into a different market segment, develop better cost-effective offering, or get rid of these SBUs and invest the resources into more promising and attractive SBUs. Segment 3
  • 106.
    4.8.2 MARKET SHARE& GROWTH OF SELECTED LOGISTICS COMPANIES IN 2012 Company Name Company Growth Market share in 2012 Aegis Logistics -24.17 4.48 Allcargo Logistics 198.80 17.06 Aqua Logistics 184.75 4.91 Arshiya International 193.51 9.37 Container Corporation of India 21.32 64.19 Table No Market share & Market Growth 4.8.3 GE MATRIX FOR LOGISTICS INDUSTRY High Medium Low H ig h M e di u m L o w MARKETATTRACTIVENESS Business Unit Strength Allcargo AegisCCI Aqua Arshiya
  • 107.
    INFERENCE • In Indiathe industry attractiveness is highly increased over a decades. India allowed FDI 100% though the performance of logistics company shows excellent performance • by using GE matrix, the Allcargo have more market attractiveness and market growth and market share in among companies • Arshiya International having good growth in market so it below the market shares. So the company can increase their market shares by increasing the operation in up coming periods • The Container Corporation of India had competitive position in Indian market but the growth of the company is less than the Allcargo. The company can increase their capacity over the market • Aegis Logistics company leader in Oil, Gas and Chemical segment but its performance was comes under negative points because of it focus particular segment so the company can set up new plants. To cover the all over the India • The performance of Aqua logistics company denotes that company having good financial records over the years so the growth of the company goes double digits even the market share remain in constants its face the lot of competitions in the market
  • 108.
    4.9 SWOT ANALYSISOF INDIAN LOGISTICS INDUSTRY 4.9.1 Strength and weakness • Logistics industry contribute 10-13 % in GDP in India • Ranked at 46th position in world in 2012 • Vital role in import and export business • Cheap labour available in India • Improve infrastructure like development of new roads, rail road, ports • 100% in FDI in India • Quality and reliability • Direct delivery capability • Currently industry use latest technology 4.9.2 Weakness • Poor performance in infrastructure facilities in india • Lack of experienced people while taking strategic decisions • Poor physical facilities like road, port, rail road, IT etc • State and central government policies over its industry like import restriction over certain products and export for certain scare products • Competitors from international players like DHL, UPS, TNT, FEDEX, Blue Dart etc • Indian logistics company adopt inadequate technology compare to foreign competitors 4.9.3 Opportunities and Threats Opportunities - Growth and future of 3PL Market in India CRISIL Research has estimated the 3PL market in India at Rs 47-50 billion in 2008-09, which is expected to grow at a CAGR of 27% to Rs162-165 billion by 2013-14. 3PL penetration has been the highest in sectors such as cars and organized retail. The segment is also gaining importance in other sectors such as IT hardware and FMCG. The share of 3PL in the overall logistics market is expected to increase from around 1.5 - 2.0% in 2008-09 to around 3.5 – 4% by 2013-14. The benefits would accrue in the form of: • Reduction in warehousing space requirement • Improvement in efficiency due to better inventory management
  • 109.
    • Reduction intransportation cost due to higher capacity utilisation The segment is also gaining importance in other sectors such as Power, Infrastructure,IT hardware and FMCG. Threats - Key Challenges faced by the Indian Logistics Sector 1. Logistics has historically been a high-cost, low-margin business. The problem of organized players is compounded by unfair competition with unorganized players, who can get away without paying taxes and following operating norms stipulated in the Motor Vehicles Act such as quality of drivers and vehicles, volume and weight restrictions, etc. 2. Economies of scale are absent in the Indian logistics industry. Even the organized sector that contributes slightly more than 1% of the logistics cost, is highly fragmented. Existences of the differential sales tax structure have brought in diseconomies of scale. Though VAT (Value Added Tax) has been implemented since April 1, 2005, failure in implementation of a uniform VAT structure across different states has let the problem persist even today. 3. Apart from the non-uniform tax structure, Indian LSPs have to pay numerous other taxes, octopi, and face multiple check posts and harassment from authorities. High costs of operation and delays involved in compliance with varying documentation requirements of different states make the business unattractive. It is assumed that on an average, a vehicle on Indian roads loses 24-48 hours in complying with paperwork and formalities at different check posts en route to a destination and also precious fuel is spent waiting at check posts. 4. There is lack of trust and awareness among Indian shippers with regard to outsourcing logistics. The volume of outsourcing by Indian shippers is presently very low (~ 10%) compared to the same for the developed countries (> 50%, sometimes as high as 80%). The unwillingness to outsource logistics on part of Indian shippers may be attributed to scepticism about the possible benefits, perceived risk, and losing control, of sensitive organizational information, and vested interests in keeping logistics activities in-house. 5. Indian shippers expect LSPs to own quality assets, provide more value-added services and act as an integrated service provider, and institute world-class information systems for more visibility and real-time tracking of shipments. However, they are unwilling to match the same with increased billings; even pay little attention to timely payments that leave LSPs short of adequate working capital.
  • 110.
    6. Indian freightforwarders face stiff competition from multi-national freight forwarders for international freight movement. MNCs, because of their size and operations in many countries, are able to offer low freight rates and extend credit for long periods. Indian freight forwarders, on the other hand, because of their smaller size and lack of access to cheap capital, are not able to match the same. 7. Poor physical and communications infrastructure is another deterrent to attracting investments in the logistics sector. Road transportation accounts for more than 60% of inland transportation of goods, and highways that constitute 1.4% of the total road network, carry 40% of the freight movement by roadways. Slow movement of cargo due to bad road conditions, multiple check posts and documentation requirements, congestion at seaports due to inadequate infrastructure, bureaucracy, red-tapism and delay in government clearances, coupled with unreliable power supply and slow banking transactions, make it difficult for exporters to meet the deadlines for their international customers. To expedite shipments, they have to book as air freight, rather than sea freight, which adds to the costs of shipments making them uncompetitive in international markets. 8. Low penetration of IT and lack of proper communications infrastructure also result in delays, and lack of visibility and real-time tracking ability. Unavailability and absence of a seamless flow of information among the constituents of LSPs creates a lot of uncertainty, unnecessary paperwork and delays, and lack of transparency in terms of cost structures and service delivery. 9. Shippers would like LSPs to offer more value-added services and a single-stop solution to all their logistical problems. The inability of service providers to go beyond basic services and provide value-added services such as small repair work, kitting/de-kitting, packaging/labeling, order processing, distribution, customer support, etc. has not been able to motivate shippers to go for outsourcing in a big way. 10. There is lack of skilled and knowledgeable manpower in the logistics sector. Management graduates do not consider logistics as a prime job. To improve the status of the industry, service providers have to move beyond the level of brokers and truckers to attract and retain talent.
  • 111.
    CHAPTER IV FINDINGS ANDCONCLUSION 5.1 FINDINGS • The Container Corporation of India records good financial performance in past five years. In which the company have more reserves compare to its company with in industry. So the company enjoyed competitive position in the market. • CONCORE was leader in rail road segment. Because the company has major player in rail way cargo handling followed by Arshiya International, Allcargo Logistics. • Even the Allcargo Logistics Company had good performance in both market growth and market shares in past five years. Because the company operates worldwide level up to 65 countries. • Aegis Logistics enjoy as leader in Oil, Gas, Chemical handing the company had poor financial performance over five years because of poor infrastructure facilities in prevailing in India. But the company only target east India segment only. Hence the company had strong financial resources compare to its company in industry. • Strength of CONCORE, Arshiya in railway cargo handling, CFS, MOT. Allcargo, Aqua is strength in third party logistics and warehousing and information technology, Aegis Logistics company strength in Oil, Gas field. • The weakness of all of the company is to face tough competition towards world level due to change in government policies, fluctuation in foreign currency, poor physical facilities in India. • India ranked at 46th position in Logistics performance Index all over the world • The overall industry strength is the level of GDP increased by its industry. The industry contributed 13-14% as GDP in 2012. • Industry analysis explains that the CONCORE attains competitive position in the market followed by Allcargo, Arshiya International • Aegis Logistics company attained competitive position in Oil, Gas, and Chemical segment.
  • 112.
    • The overallindustry average income was increased continuously over the period. In FY12 the industry average income stood at Rs1347Cr. • The operating profit explains that CONCORE got more profit followed by Allcargo, Arshiya Int. • The Earning Per Share (EPS) of CONCORE in FY12 Rs67.54 • The all companies are followed acceptable level of current ratio. In which the working capital level is better in CONCORE and followed by Aqua • By using BCG matrix the Allcargo company get star position, Arshiya Int. stand at question mark position, CONCORE comes under cash cow area, the other two companies like Aqua, Aegis comes in dog position. • By using GE matrix 5.2 SUGGESTION • India should develop infrastructure facilities improve road structure like extension the road, to improve the capacity of ports and develop new ports in India. • Railroad must be developed because it leads to reliability in supply of goods and services quickly. • The Air port should be improve their capacity level and create more air port in India so the level of cargo handling can be increased • To adopt latest information technology like GPS, inventory control, material handling equipments, it helps to decrease the cost of operation in order to utilize the resource effectively • CONCORE may enter into airways, 3PL it provide more revenue to company. • CONCORE can acquisition of other company in which it may enter into new segment like Free Trade Warehousing Zones. • Allcargo company may enter into CFS in which improve its capacities • Aegis Company may expand their operation throughout the India. So it can cover all over the India
  • 113.
    • Arshiya Internationalcompany have financially strong position in market so the company have estimated the project outlay of Rs 1600 crore for the acquisition of 75 Rakes, break vans, building of rail siding and other necessary infrastructure across the country. Its helps to investors interest over the company shares in market • Arshiya International can develop their Free Trade Warehousing Zones in other major cities like Chennai port, Tuticorin ports and others majors ports in India • Aqua Logistics company can improve their operation by way of increasing its contracts Logistics and The company had a Multi-Modal Transport Operator's License, an IATA Accreditation and a Custom House Agent's License for servicing customers' requirement could be match accordingly • Aqua Logistics may enter into FTWZ, MTO its create increase their performance in the markets 5.3 CONCLUSION The project titled “A Study on Logistics Industry in India” in which the selected logistics companies’ performance in financial position, market growth, and market share in industry was discussed. The purpose of this research was to find out the competitive position in the logistics market in India by using BCG matrix and GE matrix. In this research, the author considered the political, economical, socio-demographical and technological changes that can influence the company and its industry. Finally the industry analysis finds out how to attain competitive position in the market and what are the strategic decisions to be taken for improving in this industry.
  • 114.
    REFERENCE WEBSITES • http://www.transportintelligence.com/assets/files/ Global_Transport_and_Logistics_Financial_Ratio_Analysis_2012_Brochure.pdf •http://www.gati.com/html/investors-desk_financial-reports_annual-report.html • http://www.allcargologistics.com/investor-relations/overview.aspx • http://english.eazel.com/lv/software/download/kl670736.htm • https://docs.google.com/viewer?a=v&q=cache:WpcaszttO0AJ:www.researchersworld.com/ vol2/issue2/ Paper_16.pdf+various+companies+capital+structure&hl=en&gl=in&pid =bl&srcid=ADGEESiq4wBaUEzYk6fgYddtVoSwOfz3yb_MYjrB_YW- a02TpOdTZ_7iwr10MmX5qYp8uvrso28iTucxnauYQv4msB67NnN8Ucu8EHSk0KEHIMSP81gEuMk Kmevdb_xW8NG7DheowiQf&sig=AHIEtbSSSxGb2Tqi5krf-7oXDHnjrQoHgg • http://www.scribd.com/doc/37138080/Capital-Structure-Analysis-of-Triveni • http://www.ukessays.com/dissertation/literature-review/literature-review-on-capital-structure- theory.php • http://www.docstoc.com/docs/44243747/MBA-PROJECT-IN-CEMENT-INDUSTRY • http://www.scribd.com/doc/54495972/Capital-Structure-Analysis-of-Indian-Automobile- Industry • http://www.managementparadise.com/buggu1/documents/1884/amul-bcg-matrix/ • http://siteresources.worldbank.org/TRADE/Resources/239070-1336654966193/ LPI_2012_rankings.pdf • http://siteresources.worldbank.org/TRADE/Resources/239070-1336654966193/ LPI_2012_final.pdf • http://siteresources.worldbank.org/TRADE/Resources/239070-1336654966193/ LPI_Survey_2011.pdf • http://india.smetoolkit.org/india/en/file/content/43677/en/ Indian_Logistics_Industry_Snippet.pdf • http://www.deloitte.com/assets/Dcom-India/Local%20Assets/Documents/Thoughtware/ Logistics%20Sector-Present%20situation%20and%20way%20forward.pdf • http://www3.weforum.org/docs/ WEF_SCT_GAC_OutlookLogisticsSupplyChainIndustry_IndustryAgenda_2012.pdf • http://www.softlinkglobal.com/resources/Expert%20Opinion/Amit_TTalkJan10.aspx? Type=resources • http://www.ilfsindia.com/downloads/bus_concept/Logistics.pdf • http://research.fh-ooe.at/files/publications/912_Futurescenarios.pdf • http://www.google.co.in/url? sa=t&rct=j&q=&esrc=s&source=web&cd=1&sqi=2&ved=0CDAQFjAA&url=http%3A%2F%2Fwww .iun.edu%2F~bnwcls%2Fj401%2Fbcg.doc&ei=m4xuUbekOcGNrgeMjoCYBg&usg=AFQjCNFk8xG7 G_D3T2PdpGq242Jr8Z-Zsw&sig2=G0c4ZhqHtBoLGZDB5n-sfw&bvm=bv.45368065,d.bmk • https://docs.google.com/viewer?url=http://www.iseindia.com/ResearchPDF/ BCG_Matrix_SWOT_and_Porter_Model-April_2011.pdf
  • 115.
  • 116.
    1. Balance Sheetof Container Corporation of India ------------------- in Rs. Cr. ------------------- Particulars Mar '08 Mar '09 Mar '10 Mar '11 Mar '12 Sources Of Funds Total Share Capital 64.99 129.98 129.98 129.98 129.98 Equity Share Capital 64.99 129.98 129.98 129.98 129.98 Reserves 3,118.93 3,632.23 4,206.42 4,847.83 5,476.45 Networth 3,183.92 3,762.21 4,336.40 4,977.81 5,606.43 Total Liabilities 3,183.92 3,762.21 4,336.40 4,977.81 5,606.43 Mar '08 Mar '09 Mar '10 Mar '11 Mar '12 Application Of Funds Gross Block 2,244.24 2,617.57 2,965.48 3,266.11 3,472.61 Less: Accum. Depreciation 579.09 691.98 825 959.13 1,078.86 Net Block 1,665.15 1,925.59 2,140.48 2,306.98 2,393.75 Capital Work in Progress 172.08 269.07 222.44 339.18 115.12 Investments 155.36 203.08 240.54 243.96 293.1 Inventories 4.81 5.08 6.99 6.26 8.17 Sundry Debtors 13.73 15.72 17.64 17.27 19.59 Cash and Bank Balance 64.47 58.77 49.44 56.34 2,761.50 Total Current Assets 83.01 79.57 74.07 79.87 2,789.26 Loans and Advances 373.07 403.94 571.56 561.77 906.35 Fixed Deposits 1,457.03 1,704.74 1,940.07 2,239.34 0 Total CA, Loans & Advances 1,913.11 2,188.25 2,585.70 2,880.98 3,695.61 Current Liabilities 599.05 684.24 707.79 639.22 714.37 Provisions 122.73 139.54 144.97 154.07 176.78 Total CL & Provisions 721.78 823.78 852.76 793.29 891.15 Net Current Assets 1,191.33 1,364.47 1,732.94 2,087.69 2,804.46 Total Assets 3,183.92 3,762.21 4,336.40 4,977.81 5,606.43
  • 117.
    2. Profit &Loss account of Container Corporation of India ------------------- in Rs. Cr. ------------------- Mar '08 Mar '09 Mar '10 Mar '11 Mar '12 Income Sales Turnover 3,347.3 0 3,417.1 6 3,705.6 8 3,828.1 2 4,060.9 5 Excise Duty 0 0 0 0 0 Net Sales 3,347.3 0 3,417.1 6 3,705.6 8 3,828.1 2 4,060.9 5 Other Income 158.72 203.57 164.07 173.45 316.54 Total Income 3,506.0 2 3,620.7 3 3,869.7 5 4,001.5 7 4,377.4 9 Expenditure Raw Materials 1.71 2.14 2.29 2.67 5.04 Power & Fuel Cost 0 0 14.99 14.03 28.05 Employee Cost 54.82 80.39 83.61 86.9 99.91 Other Manuf.Expenses 2,294.1 2 2,254.0 0 2,506.3 2 2,598.3 2 78.86 Selling and Admin Expenses 62.42 95.96 94.7 75.43 0 Miscellaneous Expenses 43.5 53.55 41.8 48.08 2,825.3 6 Preoperative Exp Capitalised 0 0 0 0 0 Total Expenses 2,456.5 7 2,486.0 4 2,743.7 1 2,825.4 3 3,037.2 2 Mar '08 Mar '09 Mar '10 Mar '11 Mar '12 Operating Profit 890.73 931.12 961.97 1,002.6 9 1,023.7 3 PBDIT 1,049.4 5 1,134.6 9 1,126.0 4 1,176.1 4 1,340.2 7
  • 118.
    Interest 0.24 0.060.09 0.3 0 PBDT 1,049.2 1 1,134.6 3 1,125.9 5 1,175.8 4 1,340.2 7 Depreciation 106.34 115.91 135.1 145.23 158.49 Other Written Off 0 0 0 0 0 Profit Before Tax 942.87 1,018.7 2 990.85 1,030.6 1 1,181.7 8 Extra-ordinary items 7.38 7.21 15.76 25.11 -52.16 PBT (Post Extra-ord Items) 950.25 1,025.9 3 1,006.6 1 1,055.7 2 1,129.6 2 Tax 197.98 234.73 219.92 179.77 251.74 Reported Net Profit 752.21 791.2 786.69 875.95 877.88 Total Value Addition 2,454.8 6 2,483.9 0 2,741.4 2 2,822.7 6 3,032.1 8 Equity Dividend 168.98 181.98 181.98 201.48 249.26 Corporate Dividend Tax 28.72 30.93 30.52 33.06 0 Per share data (annualised) Shares in issue (lakhs) 649.91 1,299.8 3 1,299.8 3 1,299.8 3 1,299.8 3 Earning Per Share (Rs) 115.74 60.87 60.52 67.39 67.54 Equity Dividend (%) 260 140 140 155 165 Book Value (Rs) 489.9 289.44 333.61 382.96 431.32 3. Balance Sheet of Aqua Logistics Particulars ------------------- in Rs. Cr. ------------------- 2008 2009 2010 2011 2012 Sources Of Funds Total Share Capital 11.4 6 12.92 20.54 30.00 30.00
  • 119.
    Equity Share Capital 11.4 612.92 20.54 30.00 30.00 Share Application Money 0.00 0.00 0.00 0.00 0.00 Preference Share Capital 0.00 0.00 0.00 0.00 0.00 Reserves 28.4 8 44.52 206.47 493.61 491.56 Revaluation Reserves 0.00 0.00 0.00 0.00 0.00 Networth 39.9 4 57.44 227.01 523.61 521.56 Secured Loans 7.46 39.73 29.70 39.71 53.18 Unsecured Loans 0.70 0.06 0.01 30.37 31.23 Total Debt 8.16 39.79 29.71 70.08 84.41 Total Liabilities 48.1 0 97.23 256.72 593.69 605.97 2008 2009 2010 2011 2012 Application Of Funds Gross Block 9.91 14.67 46.50 51.50 55.89 Less: Accum. Depreciation 0.78 1.92 3.41 7.14 10.96 Net Block 9.13 12.75 43.09 44.36 44.93 Capital Work in Progress 0.00 0.00 2.30 7.31 13.45 Investments 0.01 10.85 9.89 45.61 54.41 Inventories 0.00 0.00 0.00 0.00 0.00 Sundry Debtors 32.8 6 59.73 103.24 155.63 146.80 Cash and Bank Balance 8.19 1.04 5.46 2.28 94.37 Total Current Assets 41.0 5 60.77 108.70 157.91 241.17 Loans and Advances 7.40 15.59 33.82 65.35 280.62 Fixed Deposits 0.10 10.45 75.91 292.81 0.00
  • 120.
    Total CA, Loans& Advances 48.5 5 86.81 218.43 516.07 521.79 Deffered Credit 0.00 0.00 0.00 0.00 0.00 Current Liabilities 9.22 10.48 16.26 20.23 25.33 Provisions 0.37 4.11 4.67 3.43 3.27 Total CL & Provisions 9.59 14.59 20.93 23.66 28.60 Net Current Assets 38.9 6 72.22 197.50 492.41 493.19 Miscellaneous Expenses 0.00 1.42 3.94 4.00 0.00 Total Assets 48.1 0 97.24 256.72 593.69 605.98 Contingent Liabilities 0.00 10.82 1.85 16.69 2.91 Book Value (Rs) 34.8 4 44.45 110.51 17.45 17.39 4. Profit & Loss account of Aqua Logistics Particulars ------------------- in Rs. Cr. ------------------- 2008 2009 2010 2011 2012 Income Sales Turnover 108.99 213.4 322.01 380.88 310.35 Excise Duty 0 0 0 0 0 Net Sales 108.99 213.4 322.01 380.88 310.35 Other Income 0.42 0.65 -0.11 0.85 1.58 Stock Adjustments 0 0 0 0 0 Total Income 109.41 214.05 321.9 381.73 311.93 Expenditure Raw Materials 0 0 0 0 0 Power & Fuel Cost 0 0 0 0 0 Employee Cost 7.63 10.58 10.92 8.33 6.19
  • 121.
    Other Manufacturing Expenses84.31 175.49 272.42 326.79 282.43 Selling and Admin Expenses 3.44 3.79 4.47 8.71 0 Miscellaneous Expenses 0.84 1.19 1.29 1.29 5.95 Preoperative Exp Capitalised 0 0 0 0 0 Total Expenses 96.22 191.05 289.1 345.12 294.57 Mar'08 Mar'09 Mar'10 Mar '11 Mar '12 Operating Profit 12.77 22.35 32.91 35.76 15.78 PBDIT 13.19 23 32.8 36.61 17.36 Interest 3.82 4.75 5.17 7.25 11.78 PBDT 9.37 18.25 27.63 29.36 5.58 Depreciation 0.57 1.14 1.49 3.88 3.87 Other Written Off 0 0 0 0 0 Profit Before Tax 8.8 17.11 26.14 25.48 1.71 Extra-ordinary items 0 0 0 -0.48 0 PBT (Post Extra-ord Items) 8.8 17.11 26.14 25 1.71 Tax 3.18 5.97 5.6 2.62 0.55 Reported Net Profit 5.61 11.15 20.54 22.39 1.15 Total Value Addition 96.22 191.05 289.1 345.12 294.57 Equity Dividend 0 0 0 0 0 Corporate Dividend Tax 0 0 0 0 0 Per share data (annualised) Shares in issue (lakhs) 114.64 129.24 205.41 2,999.9 1 2,999.9 1 Earning Per Share (Rs) 4.9 8.63 10 0.75 0.04 Equity Dividend (%) 0 0 0 0 0 Book Value (Rs) 34.84 44.45 110.51 17.45 17.39 5. Key Financial Ratios of Aqua Logistics: 2008 2009 2010 2011 2012 Investment Valuation Ratios
  • 122.
    Face Value 1010 10 1 1 Operating Profit Per Share (Rs) 11.13 17.29 16.02 1.19 0.53 Net Operating Profit Per Share (Rs) 95.07 165.12 156.76 12.7 10.35 Free Reserves Per Share (Rs) 24.84 33.36 98.6 16.31 -- Bonus in Equity Capital -- 15.47 9.73 6.66 6.66 Profitability Ratios Operating Profit Margin(%) 11.7 10.47 10.21 9.38 5.08 Profit Before Interest And Tax Margin(%) 11.17 9.93 9.74 8.34 3.8 Gross Profit Margin(%) 11.19 9.93 9.75 8.36 3.83 Cash Profit Margin(%) 5.41 5.52 6.98 7.1 1.94 Adjusted Cash Margin(%) 5.41 5.52 6.98 7.1 1.94 Net Profit Margin(%) 5.14 5.22 6.37 5.85 0.36 Adjusted Net Profit Margin(%) 5.14 5.22 6.37 5.85 0.36 Return On Capital Employed(%) 25.66 21.98 12.38 5.58 2.4 Return On Net Worth(%) 14.05 19.89 9.2 4.3 0.22 Adjusted Return on Net Worth(%) 13.37 19.03 9.42 4.48 0.42 Return on Assets Excluding Revaluations 34.84 43.36 108.6 17.32 17.39 Return on Assets Including Revaluations 34.84 43.36 108.6 17.32 17.39 Return on Long Term Funds(%) 25.66 21.98 13.98 5.9 2.77 Liquidity And Solvency Ratios Current Ratio 5.06 5.95 2.75 5.89 3.26 Quick Ratio 5.06 5.95 10.44 21.81 18.24 Debt Equity Ratio 0.2 0.69 0.13 0.13 0.16 Long Term Debt Equity Ratio 0.2 0.69 -- 0.07 0.01 Debt Coverage Ratios Interest Cover 6.34 5.47 6.8 4.91 1.23 Total Debt to Owners Fund 0.2 0.69 0.13 0.13 0.16 Financial Charges Coverage Ratio 3.38 4.74 6.44 5.11 1.56 Financial Charges Coverage Ratio Post Tax 2.62 3.59 5.26 4.62 1.43 Management Efficiency Ratios
  • 123.
    Debtors Turnover Ratio4.69 4.61 3.95 2.94 2.05 Asset Turnover Ratio 18.43 19.99 7.58 8.02 0.52 Number of Days In Working Capital 128.69 121.84 220.8 465.41 572.08 6. Balance Sheet of Allcargo Logistics ------------------- in Rs. Cr. ------------------- Particulars Dec '07 Dec '08 Dec '09 Dec '10 Mar '12 12 mths 12 mths 12 mths 12 mths 15 mths Sources Of Funds Total Share Capital 20.26 22.36 24.96 26.10 26.11 Equity Share Capital 20.26 22.36 24.96 26.10 26.11 Share Application Money 3.60 30.98 1.65 1.23 0.87 Preference Share Capital 0.00 0.00 0.00 0.00 0.00 Reserves 361.65 443.53 765.18 951.68 1113.16 Revaluation Reserves 0.00 0.00 0.00 0.00 0.00 Networth 385.51 496.87 791.79 979.01 1140.14 Secured Loans 24.38 105.28 109.30 247.25 495.91 Unsecured Loans 0.00 100.97 0.00 0.00 62.84 Total Debt 24.38 206.25 109.30 247.25 558.75 Total Liabilities 409.89 703.12 901.09 1226.2 6 1698.89 Particulars Dec '07 Dec '08 Dec '09 Dec '10 Mar '12 Application Of Funds Gross Block 248.62 377.66 508.97 776.14 1194.27 Less: Accum. Depreciation 38.54 62.50 98.72 134.07 213.06 Net Block 210.08 315.16 410.25 642.07 981.21 Capital Work in Progress 40.52 59.45 61.75 45.79 47.44 Investments 114.06 115.22 200.34 179.07 380.64 Inventories 1.47 1.96 2.71 6.33 11.04 Sundry Debtors 45.63 71.33 72.86 93.55 129.33 Cash and Bank Balance 9.20 29.25 16.79 11.42 6.51 Total Current Assets 56.30 102.54 92.36 111.30 146.88 Loans and Advances 40.90 198.81 248.15 463.66 410.06 Fixed Deposits 5.50 3.35 3.56 2.09 0.00 Total CA, Loans & Advances 102.70 304.70 344.07 577.05 556.94 Deffered Credit 0.00 0.00 0.00 0.00 0.00 Current Liabilities 48.94 83.54 106.83 177.16 246.22 Provisions 8.62 7.90 8.50 40.55 21.13 Total CL & Provisions 57.56 91.44 115.33 217.71 267.35 Net Current Assets 45.14 213.26 228.74 359.34 289.59 Miscellaneous Expenses 0.09 0.05 0.00 0.00 0.00 Total Assets 409.89 703.14 901.08 1226.2 7 1698.88 Contingent Liabilities 18.52 15.93 76.84 69.61 328.89 Book Value (Rs) 188.54 208.33 63.31 74.92 87.27
  • 124.
    7. Profit &Loss account of Allcargo Logistics
  • 125.
    ------------------- in Rs.Cr. ------------------- Particulars Dec '07 Dec '08 Dec '09 Dec '10 Mar '12 12 mths 12 mths 12 mths 12 mths 15 mths Income Sales Turnover 361.25 516.79 516.76 699.84 1,079.4 3 Excise Duty 0 0 0 0 0 Net Sales 361.25 516.79 516.76 699.84 1,079.4 3 Other Income 4.02 20.03 15.34 42.93 51.06 Total Income 365.27 536.82 532.1 742.77 1,130.4 9 Expenditure Raw Materials 2.31 3.25 4.6 13.1 21.43 Power & Fuel Cost 1.66 1.44 2.41 23.88 40.63 Employee Cost 23.11 34.18 35.84 48.58 80.67 Other Manufacturing Expenses 223.18 300.53 287.11 352.58 535.57 Selling and Admin Expenses 22.22 30.62 29.45 63.95 0 Miscellaneous Expenses 9.05 14.11 12.66 15.31 92.11 Total Expenses 281.53 384.13 372.07 517.4 770.41 Particulars Dec '07 Dec '08 Dec '09 Dec '10 Mar '12 12 mths 12 mths 12 mths 12 mths 15 mths Operating Profit 79.72 132.66 144.69 182.44 309.02 PBDIT 83.74 152.69 160.03 225.37 360.08 Interest 2.54 18.07 16.13 27.87 50.55 PBDT 81.2 134.62 143.9 197.5 309.53 Depreciation 14.2 25.47 37.63 40.24 89.04 Other Written Off 0.04 0.04 0.08 0 0 Profit Before Tax 66.96 109.11 106.19 157.26 220.49 Extra-ordinary items 3.33 -0.01 0.23 0 0 PBT (Post Extra-ord Items) 70.29 109.1 106.42 157.26 220.49 Tax 10.52 16.42 8.44 23.74 36.42 Reported Net Profit 59.78 92.67 97.81 121.13 184.07 Total Value Addition 279.22 380.89 367.46 504.32 748.98 Equity Dividend 10.76 5.59 12.48 39.44 19.58 Corporate Dividend Tax 1.83 0.95 2.12 6.43 3.18 Per share data (annualised) Shares in issue (lakhs) 202.56 223.64 1,248.1 1 1,305.1 7 1,305.4 7 Earnings Per Share (Rs) 29.51 41.44 7.84 9.28 14.1 Equity Dividend (%) 50 25 50 150 75
  • 126.
    8. Balance Sheetof Aegis Logistics Particulars ------------------- in Rs. Cr. ------------------- 2008 2009 2010 2011 2012 Sources Of Funds Total Share Capital 19.91 16.44 18.77 33.40 33.40 Equity Share Capital 19.91 16.44 18.77 33.40 33.40 Share Application Money 0.00 3.35 0.00 0.00 0.00 Preference Share Capital 0.00 0.00 0.00 0.00 0.00 Reserves 137.64 154.91 167.47 230.93 264.23 Networth 157.55 174.70 186.24 264.33 297.63 Secured Loans 34.81 25.21 69.00 57.23 77.64 Unsecured Loans 4.55 4.73 7.38 6.62 1.70 Total Debt 39.36 29.94 76.38 63.85 79.34 Total Liabilities 196.91 204.64 262.62 328.18 376.97 2008 2009 2010 2011 2012 Application Of Funds Gross Block 205.02 208.99 220.44 240.83 245.83 Less: Accum. Depreciation 79.62 88.79 98.12 108.63 118.16 Net Block 125.40 120.20 122.32 132.20 127.67 Capital Work in Progress 0.99 6.57 12.84 1.15 15.69 Investments 21.23 53.59 42.42 94.53 120.27 Inventories 11.63 4.95 9.34 8.79 8.23 Sundry Debtors 38.76 21.63 20.51 20.76 31.41 Cash and Bank Balance 2.68 3.34 11.27 12.95 10.76 Total Current Assets 53.07 29.92 41.12 42.50 50.40 Loans and Advances 51.30 46.17 89.78 64.04 81.14 Fixed Deposits 19.72 28.44 16.65 57.36 62.99 Total CA, Loans & Advances 124.09 104.53 147.55 163.90 194.53 Deffered Credit 0.00 0.00 0.00 0.00 0.00
  • 127.
    Current Liabilities 68.8568.57 54.21 53.94 68.21 Provisions 5.96 11.67 8.30 9.65 12.99 Total CL & Provisions 74.81 80.24 62.51 63.59 81.20 Net Current Assets 49.28 24.29 85.04 100.31 113.33 Miscellaneous Expenses 0.00 0.00 0.00 0.00 0.00 Total Assets 196.90 204.65 262.62 328.19 376.96 9. Profit & Loss account of Aegis Logistics Particulars ------------------- in Rs. Cr. ------------------- 2008 2009 2010 2011 2012 Income Sales Turnover 373.88 368.33 284.67 258.14 283.5 Excise Duty 0 0 0 0 0 Net Sales 373.88 368.33 284.67 258.14 283.5 Other Income 1.92 5.14 8.8 7.92 7.83 Stock Adjustments 0 -6.66 4.9 -2.6 -0.29 Total Income 375.8 366.81 298.37 263.46 291.04 Expenditure Raw Materials 268.96 270.22 175.69 144.47 160.06 Power & Fuel Cost 4.27 4.52 4.05 5.03 5.41 Employee Cost 13.55 16.72 21.14 22.38 25.58 Other Manufacturing Expenses 5.75 6.7 9.89 5.81 6.44 Selling and Admin Expenses 18.34 14.72 18.42 18.06 18.53 Miscellaneous Expenses 1.74 1.7 2.04 2.47 4.83 Preoperative Exp Capitalised 0 0 0 0 0 Total Expenses 312.61 314.58 231.23 198.22 220.85 2008 2009 2010 2011 2012 Operating Profit 61.27 47.09 58.34 57.32 62.36 PBDIT 63.19 52.23 67.14 65.24 70.19 Interest 4.12 6.18 8.04 10.15 10.31 PBDT 59.07 46.05 59.1 55.09 59.88 Depreciation 8.96 9.17 9.67 10.74 11.36 Other Written Off 0 0 0 0 0.57 Profit Before Tax 50.11 36.88 49.43 44.35 47.95 Extra-ordinary items 0.37 -0.24 0.06 0.82 10.07 PBT (Post Extra-ord Items) 50.48 36.64 49.49 45.17 58.02 Tax 11.38 6.27 10.53 13.96 16.95 Reported Net Profit 39.09 30.37 38.94 31.22 41.06 Total Value Addition 43.66 44.37 55.55 53.75 60.79 Preference Dividend 0 0 0 0 0 Equity Dividend 8.96 9.3 10.81 12.94 6.68 Corporate Dividend Tax 1.52 1.76 1.84 2.12 1.08 Per share data (annualised)
  • 128.
    Shares in issue(lakhs) 199.41 164.77 188.03 334 334 Earning Per Share (Rs) 19.61 18.43 20.71 9.35 12.29 Equity Dividend (%) 25 45 57.5 40 20 Book Value (Rs) 79.01 103.99 99.05 79.14 89.11 10. Key Financial Ratios of Aegis Logistics Particulars 2008 2009 2010 2011 2012 Investment Valuation Ratios Face Value 10 10 10 10 10 Dividend Per Share 2.5 4.5 5.75 4 2 Operating Profit Per Share (Rs) 30.72 28.57 31.02 17.16 18.67 Net Operating Profit Per Share (Rs) 187.5 223.53 151.4 77.29 84.88 Free Reserves Per Share (Rs) 65.21 91.5 85.36 67.09 76.31 Bonus in Equity Capital 4.11 4.98 4.36 39.89 39.89 Profitability Ratios Operating Profit Margin(%) 16.38 12.78 20.49 22.2 21.99 Profit Before Interest And Tax Margin(%) 13.9 10.1 16.73 17.51 17.34 Gross Profit Margin(%) 13.98 10.29 17.09 18.04 17.99 Cash Profit Margin(%) 12.76 11.09 15.79 15.43 15.5 Adjusted Cash Margin(%) 12.76 11.09 15.79 15.43 15.5 Net Profit Margin(%) 10.39 8.09 13.38 11.73 13.96 Adjusted Net Profit Margin(%) 10.39 8.09 13.38 11.73 13.96 Return On Capital Employed(%) 27.7 21.94 20.88 16.58 16.15 Return On Net Worth(%) 24.81 17.72 20.9 11.8 13.79 Adjusted Return on Net Worth(%) 24.78 18.95 19.47 11.47 11.3 Return on Assets Excluding Revaluations 79.01 103.99 99.05 79.14 89.11 Return on Assets Including Revaluations 79.01 103.99 99.05 79.14 89.11 Return on Long Term Funds(%) 27.7 22.31 22.14 17.29 18.06 Liquidity And Solvency Ratios Current Ratio 1.66 1.3 1.59 1.81 1.21 Quick Ratio 1.5 1.22 2.18 2.41 2.28 Debt Equity Ratio 0.25 0.17 0.41 0.24 0.27 Long Term Debt Equity Ratio 0.25 0.17 0.33 0.19 0.13 Debt Coverage Ratios Interest Cover 30.99 9.35 13.04 8.6 8.41 Total Debt to Owners Fund 0.25 0.17 0.41 0.24 0.27 Financial Charges Coverage Ratio 15.41 8.76 8.02 6.42 7.07 Financial Charges Coverage Ratio Post Tax 12.66 7.4 7.05 5.13 6.14 Management Efficiency Ratios Inventory Turnover Ratio 41.06 150.53 38.76 54.37 63.59 Debtors Turnover Ratio 11.76 12.2 13.51 12.51 10.87 Investments Turnover Ratio 41.06 150.53 38.76 54.37 63.59 Fixed Assets Turnover Ratio 1.83 1.77 1.29 1.09 1.17 Total Assets Turnover Ratio 1.9 1.8 1.09 0.8 0.76 Asset Turnover Ratio 1.83 1.83 1.22 0.87 0.8
  • 129.
    Average Finished GoodsHeld 10.25 2.66 10.91 7.88 6.74 Number of Days In Working Capital 47.46 23.73 107.55 139.88 143.92 Profit & Loss Account Ratios Material Cost Composition 71.93 73.36 61.71 55.96 56.45 Selling Distribution Cost Composition 1.67 1.39 1.8 1.88 1.9 Expenses as Composition of Total Sales 0.3 0.28 0.31 0.6 0.46 Cash Flow Indicator Ratios Dividend Payout Ratio Net Profit 26.81 36.41 32.46 48.24 18.9 Dividend Payout Ratio Cash Profit 21.81 27.96 26 35.89 14.65 Earning Retention Ratio 73.16 65.95 65.15 50.36 76.93 Cash Earning Retention Ratio 78.17 73.45 72.49 63.34 82.97 AdjustedCash Flow Times 0.82 0.72 1.66 1.55 1.74 11. Balance Sheet of Arshiya International Particulars ------------------- in Rs. Cr. ------------------- 2008 2009 2010 2011 2012 Sources Of Funds Total Share Capital 11.4 11.75 11.75 11.77 11.77 Equity Share Capital 11.4 11.75 11.75 11.77 11.77 Share Application Money 2.34 2.99 1.18 0.5 0 Reserves 445.23 475.36 483.91 502.62 540.81 Networth 458.97 490.1 496.84 514.89 552.58 Secured Loans 0.33 78.99 306.41 655.65 1,006.53 Total Debt 0.33 78.99 359.41 679.65 1,139.03 Total Liabilities 459.3 569.09 856.25 1,194.54 1,691.61 Particulars 2008 2009 2010 2011 2012 Application Of Funds Gross Block 4.89 12.65 23.37 343.18 626.77 Less: Accum. Depreciation 1.48 3 5.78 12.32 24.42 Net Block 3.41 9.65 17.59 330.86 602.35 Capital Work in Progress 194.02 344.63 605.81 490.13 525.21 Inventories 0 0 0 0 0 Sundry Debtors 33.81 57.45 91.45 95.12 121.13 Cash and Bank Balance 26.89 22.01 33.33 55.97 25.82 Total Current Assets 60.7 79.46 124.78 151.09 146.95
  • 130.
    Loans and Advances22.25 77.64 193.82 348.62 645.52 Fixed Deposits 54.28 5.96 9.98 13.52 0 Total CA, Loans & Advances 137.23 163.06 328.58 513.23 792.47 Current Liabilities 15.55 53.33 201.07 269.2 379.29 Provisions 5.68 7.6 8.48 9.97 13 Total CL & Provisions 21.23 60.93 209.55 279.17 392.29 Net Current Assets 116 102.13 119.03 234.06 400.18 Total Assets 459.32 569.09 856.26 1,194.54 1,691.61 12. Profit & Loss account of Arshiya International Particulars ------------------- in Rs. Cr. ------------------- 2008 2009 2010 2011 2012 Income Sales Turnover 201.91 256.39 273.61 453.01 592.63 Excise Duty 0 0 0 0 0 Net Sales 201.91 256.39 273.61 453.01 592.63 Other Income 5.35 9.82 6.42 21.74 37.38 Stock Adjustments 0 0 0 0 0 Total Income 207.26 266.21 280.03 474.75 630.01 Expenditure Employee Cost 5.84 7.85 15.79 24.26 36.63 Other Manufacturing Expenses 173.35 214.83 222.91 348.7 386.8 Selling and Admin Expenses 6.24 8.59 9.14 20.19 0 Miscellaneous Expenses 2.45 4.42 3.61 6.73 40.55 Preoperative Exp Capitalised 0 0 0 0 0 Total Expenses 187.88 235.69 251.45 399.88 463.98 2008 2009 2010 2011 2012 Operating Profit 14.03 20.7 22.16 53.13 128.65 PBDIT 19.38 30.52 28.58 74.87 166.03 Interest 0.72 0.82 4.52 31.56 80.41 PBDT 18.66 29.7 24.06 43.31 85.62
  • 131.
    Depreciation 0.64 1.561.8 6.96 16.43 Other Written Off 0 0 0 0 0 Profit Before Tax 18.02 28.14 22.26 36.35 69.19 Extra-ordinary items -0.19 0.14 0.84 0.1 0 PBT (Post Extra-ord Items) 17.83 28.28 23.1 36.45 69.19 Tax 5.46 9.79 7.71 11.52 21.68 Reported Net Profit 12.36 18.49 15.4 24.93 47.51 Total Value Addition 187.88 235.69 251.45 399.88 463.98 Equity Dividend 4.56 4.7 5.88 7.06 8.24 Corporate Dividend Tax 0.78 0.8 0.98 1.15 1.34 Per share data (annualised) Shares in issue (lakhs) 570.04 587.53 587.53 588.29 588.29 Earning Per Share (Rs) 2.17 3.15 2.62 4.24 8.08 Equity Dividend (%) 40 40 50 60 70 Book Value (Rs) 80.11 82.91 84.36 87.44 93.93