Download to read offline
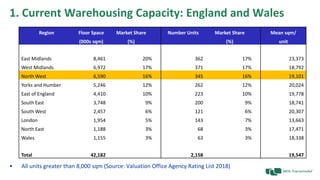
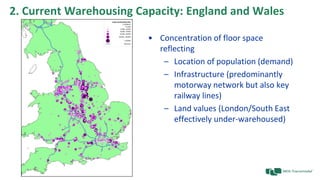
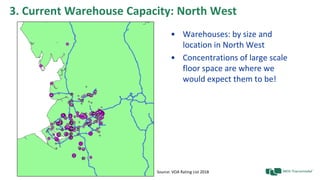
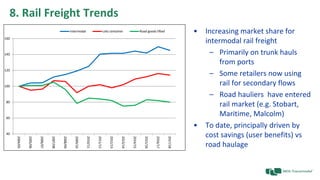
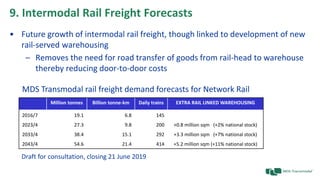

The document summarizes the current state and future trends of logistics warehousing in the North West of England. It finds that the majority of large warehouse space is concentrated near major population centers and transportation infrastructure like motorways. However, rail-connected warehouse space in the North West lags other regions like the Midlands. The document predicts growing demand for more sustainable rail freight transport due to issues like congestion and air quality. This will require developing more rail-served warehouses and cross-dock facilities to reduce road mileage. The North West region needs to identify and plan additional strategic rail-served sites to capitalize on future growth opportunities in rail freight.


