Download as PDF, PPTX

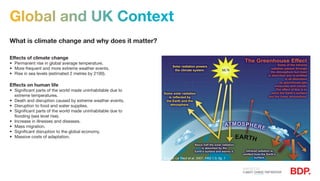
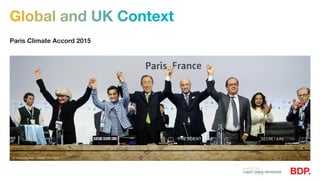
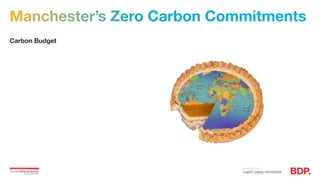
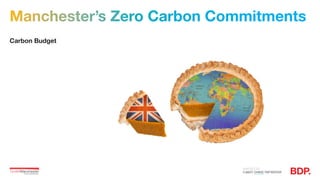
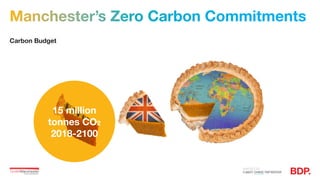
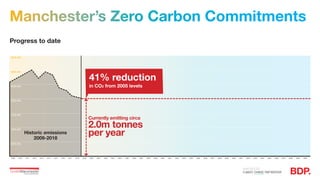
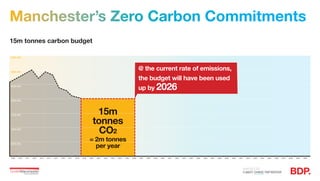
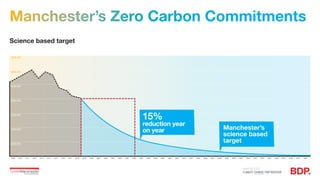
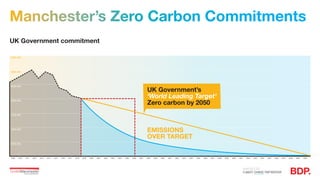
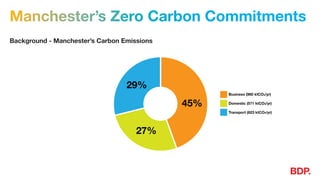
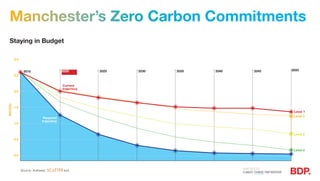
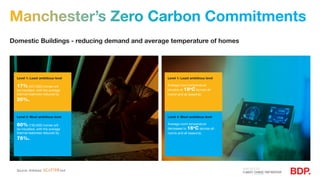
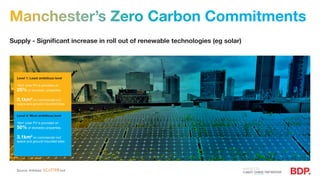

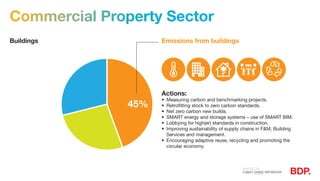
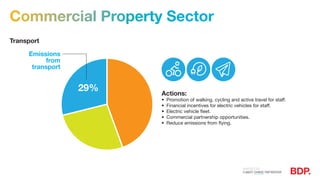


Global climate change poses severe risks to human life and the global economy if left unaddressed. The effects include rising temperatures, more extreme weather, rising sea levels, and disruption to food and water supplies. In response, the Paris Climate Accord set a goal of limiting global warming to well below 2°C. Manchester has committed to becoming a zero carbon city by 2038. It has set a carbon budget of 15 million tonnes between 2018-2100. At current emission rates, the budget would be exceeded by 2026. Manchester aims to reduce emissions by 15% annually to stay within its budget and meet the UK's 2050 zero carbon target. Significant changes are needed across various sectors like buildings, transport,


