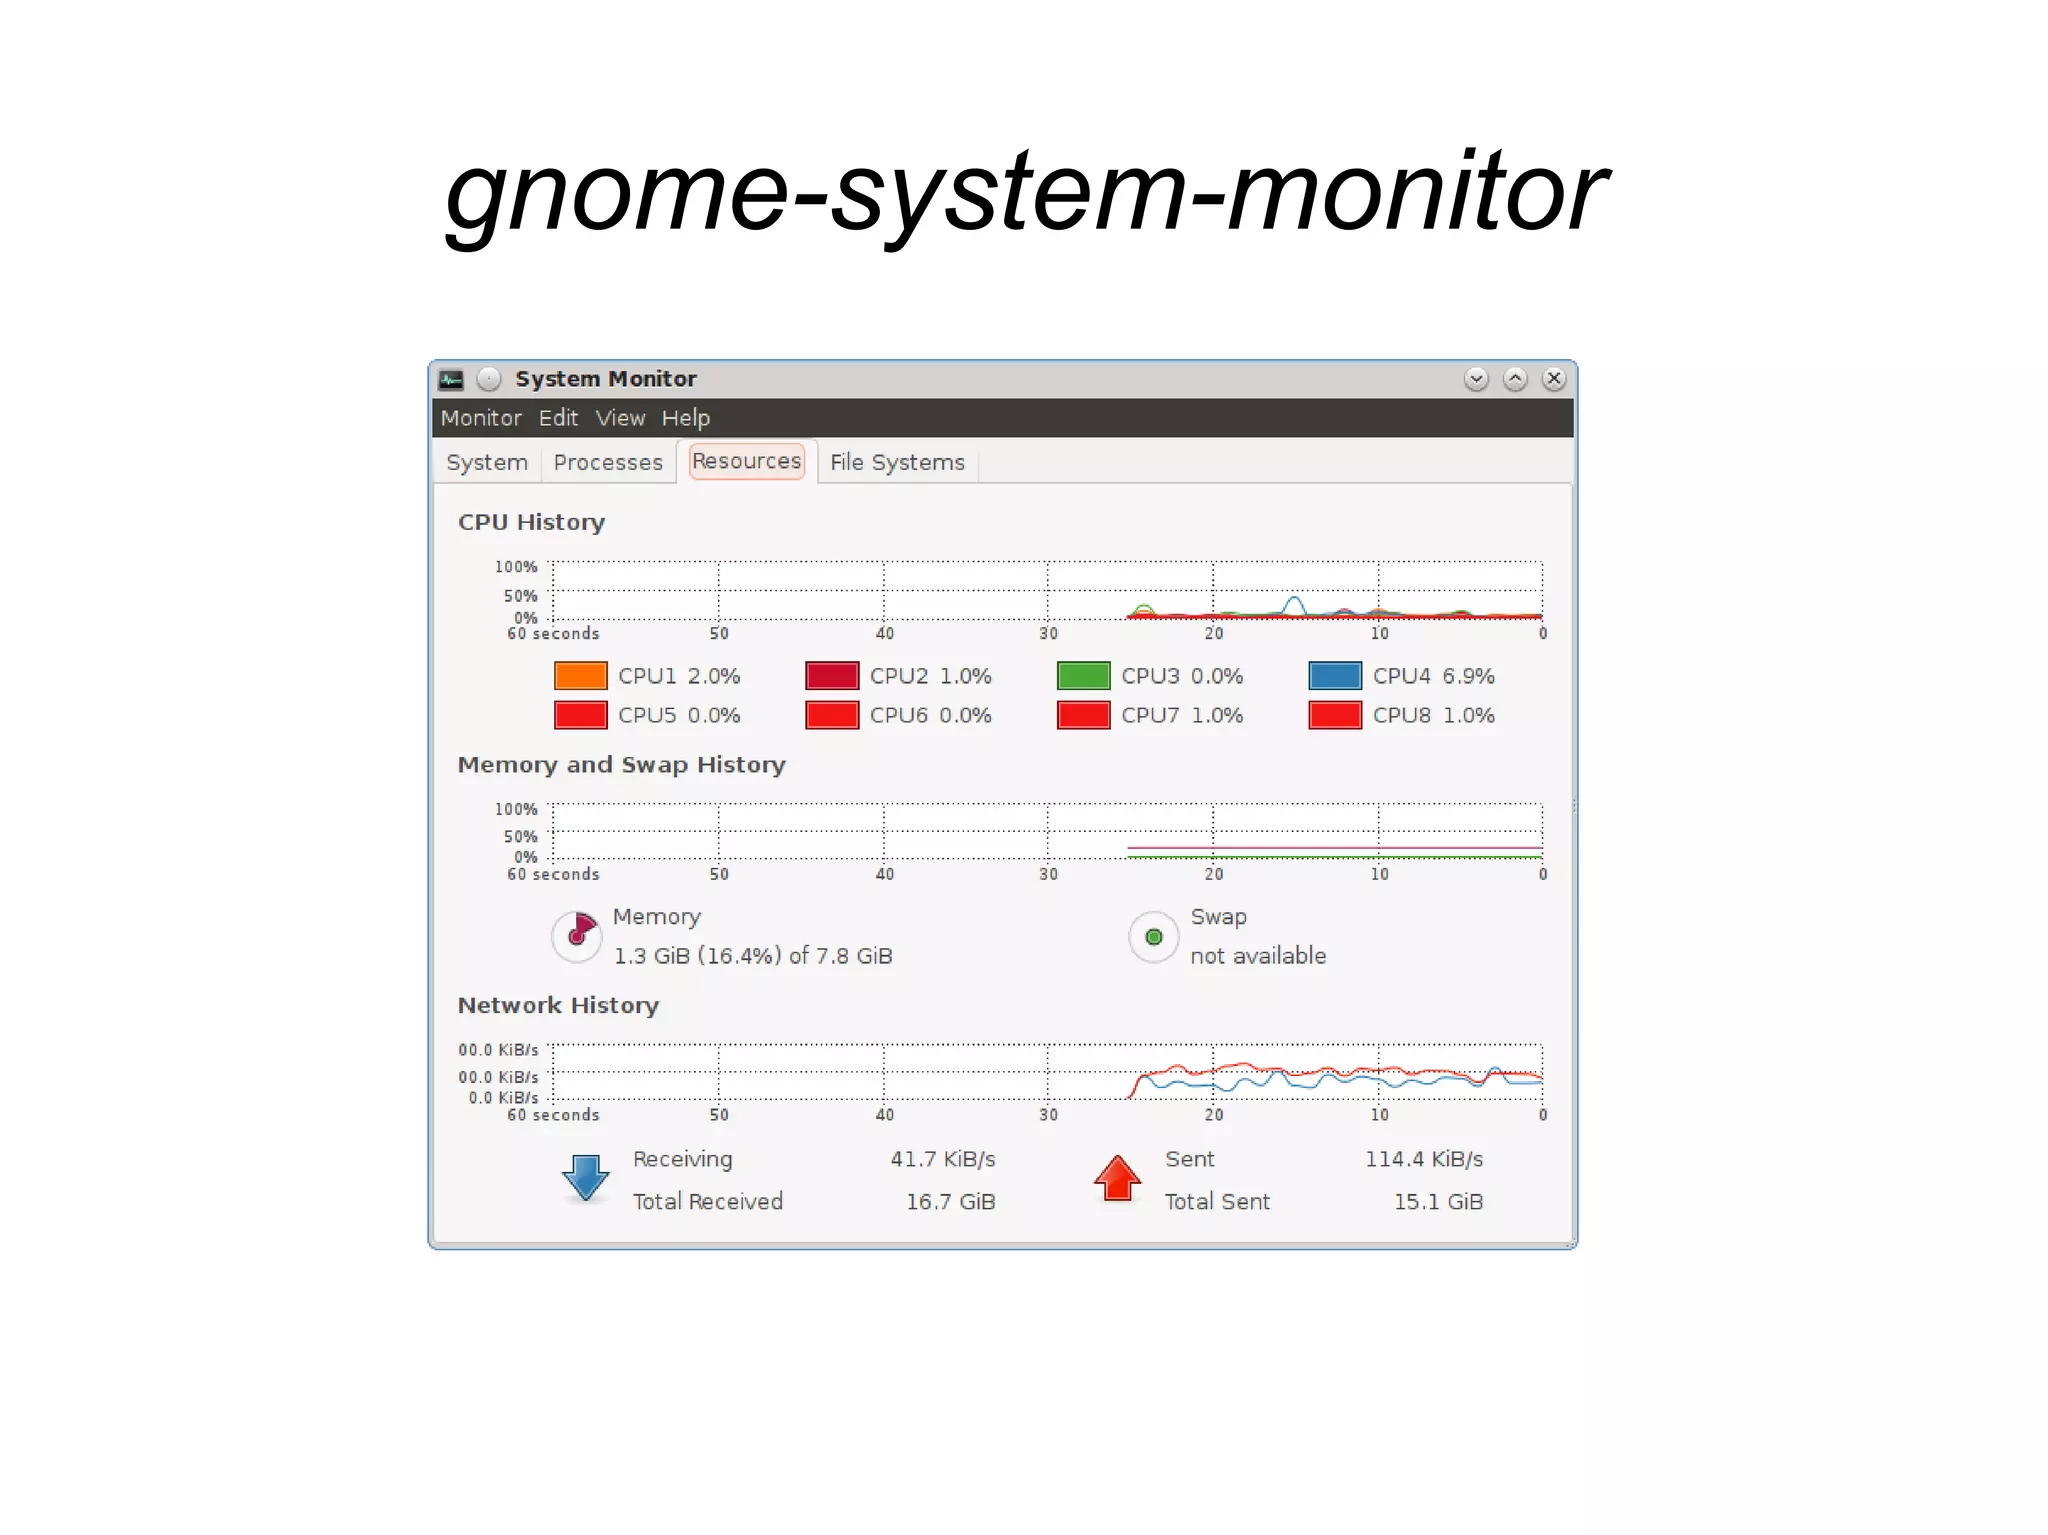
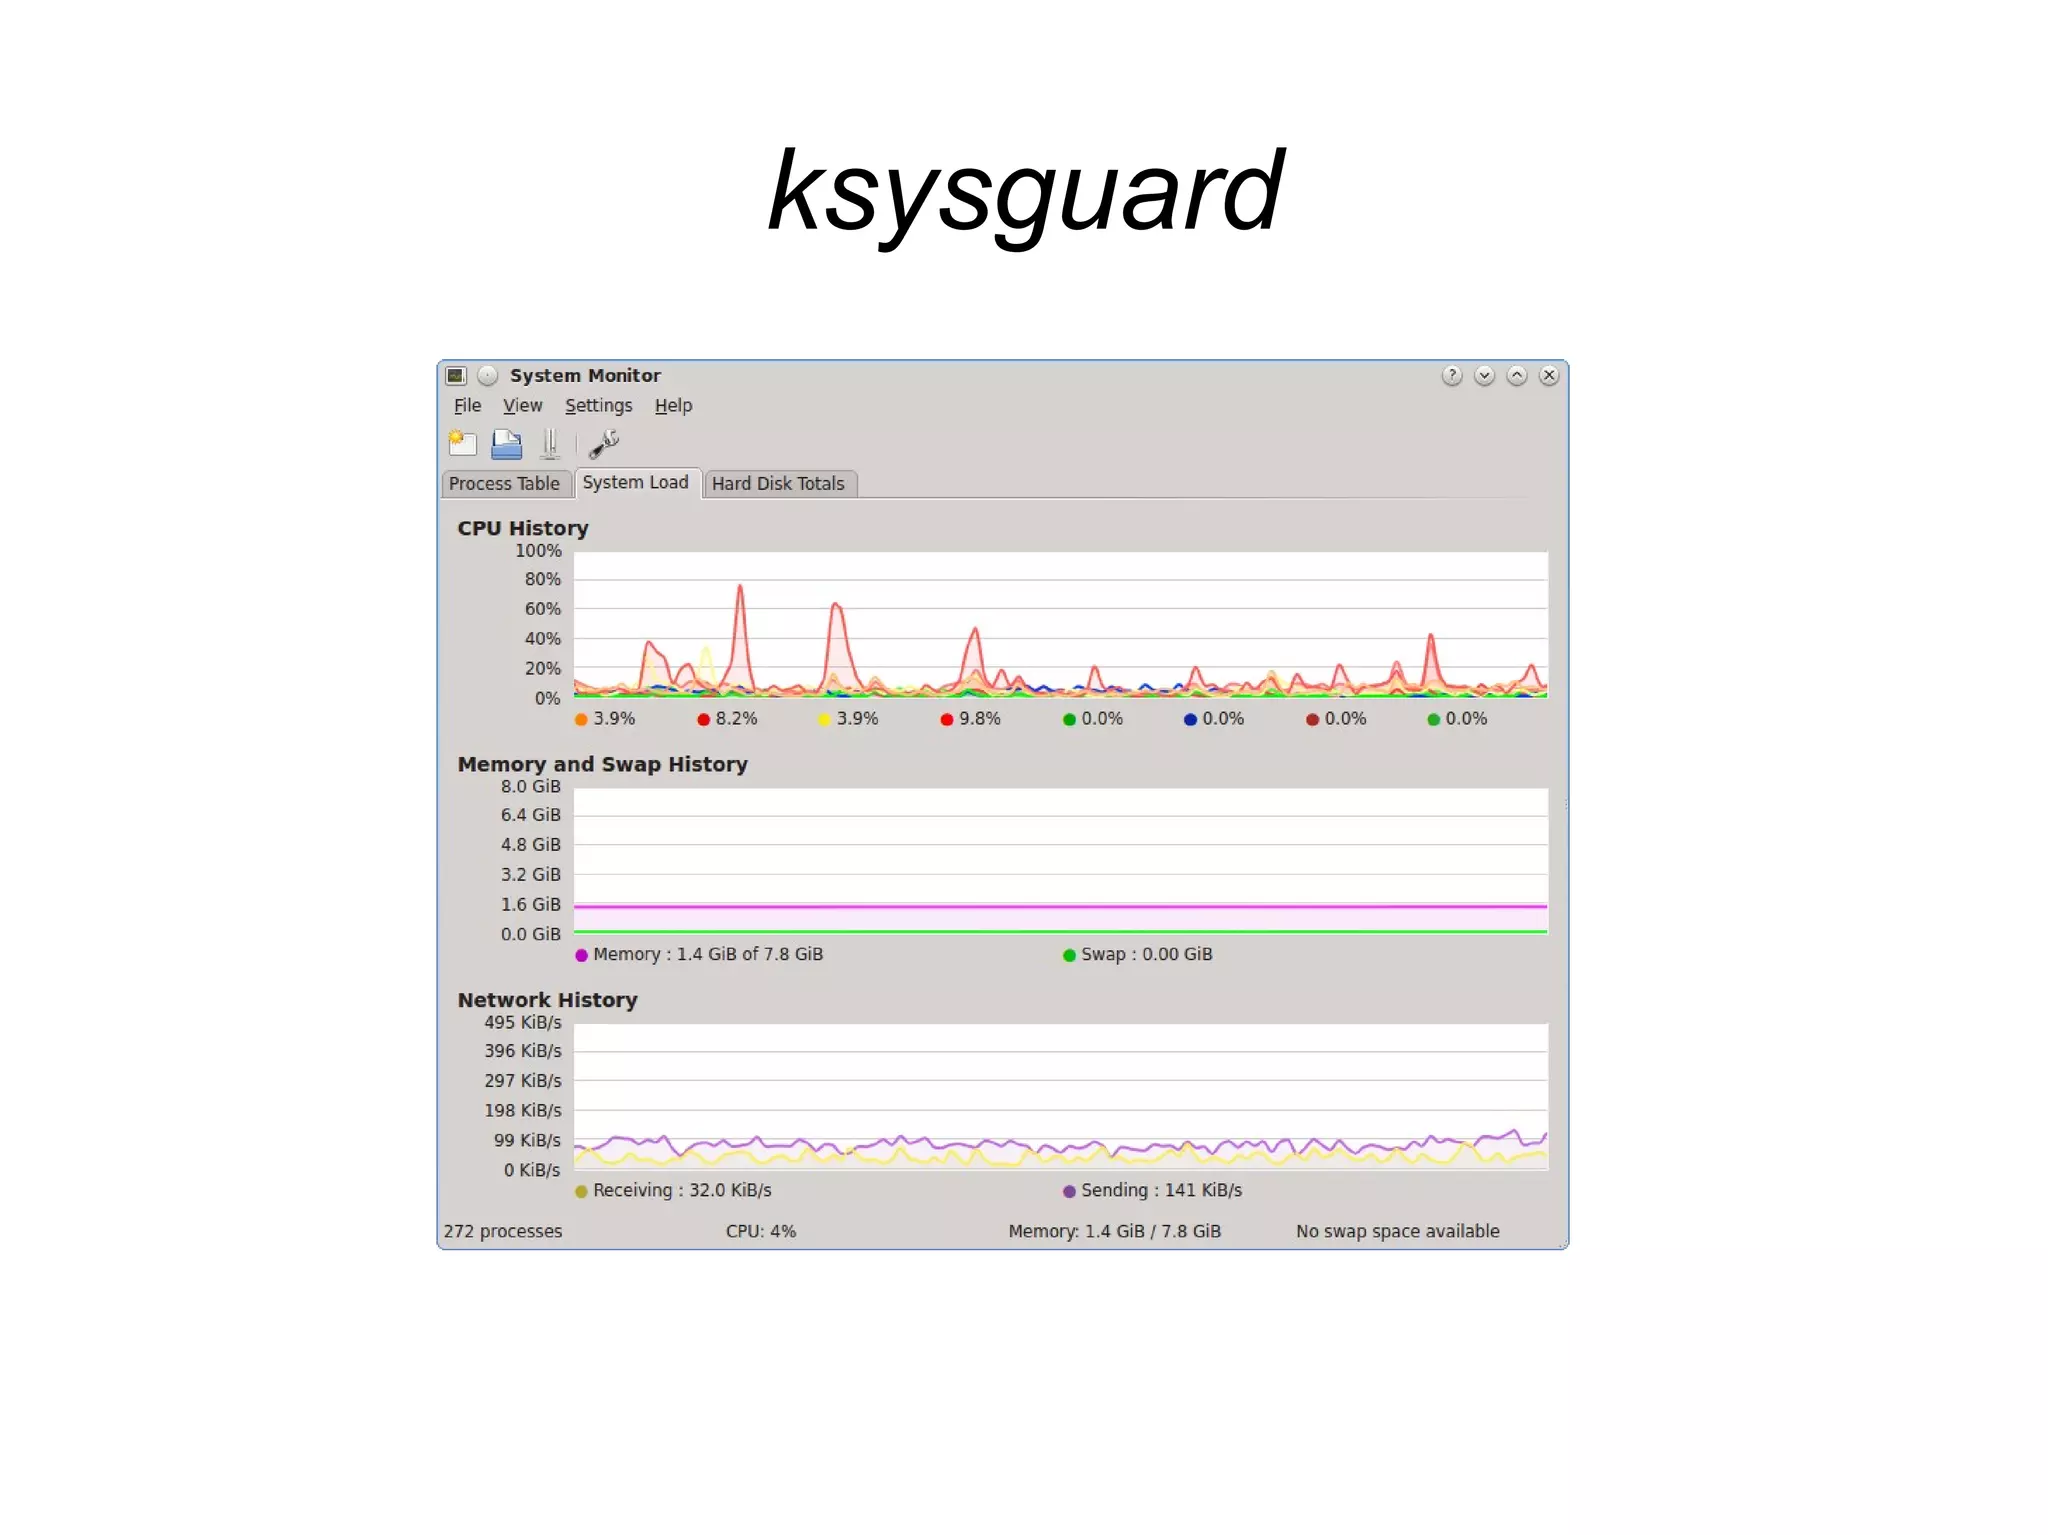
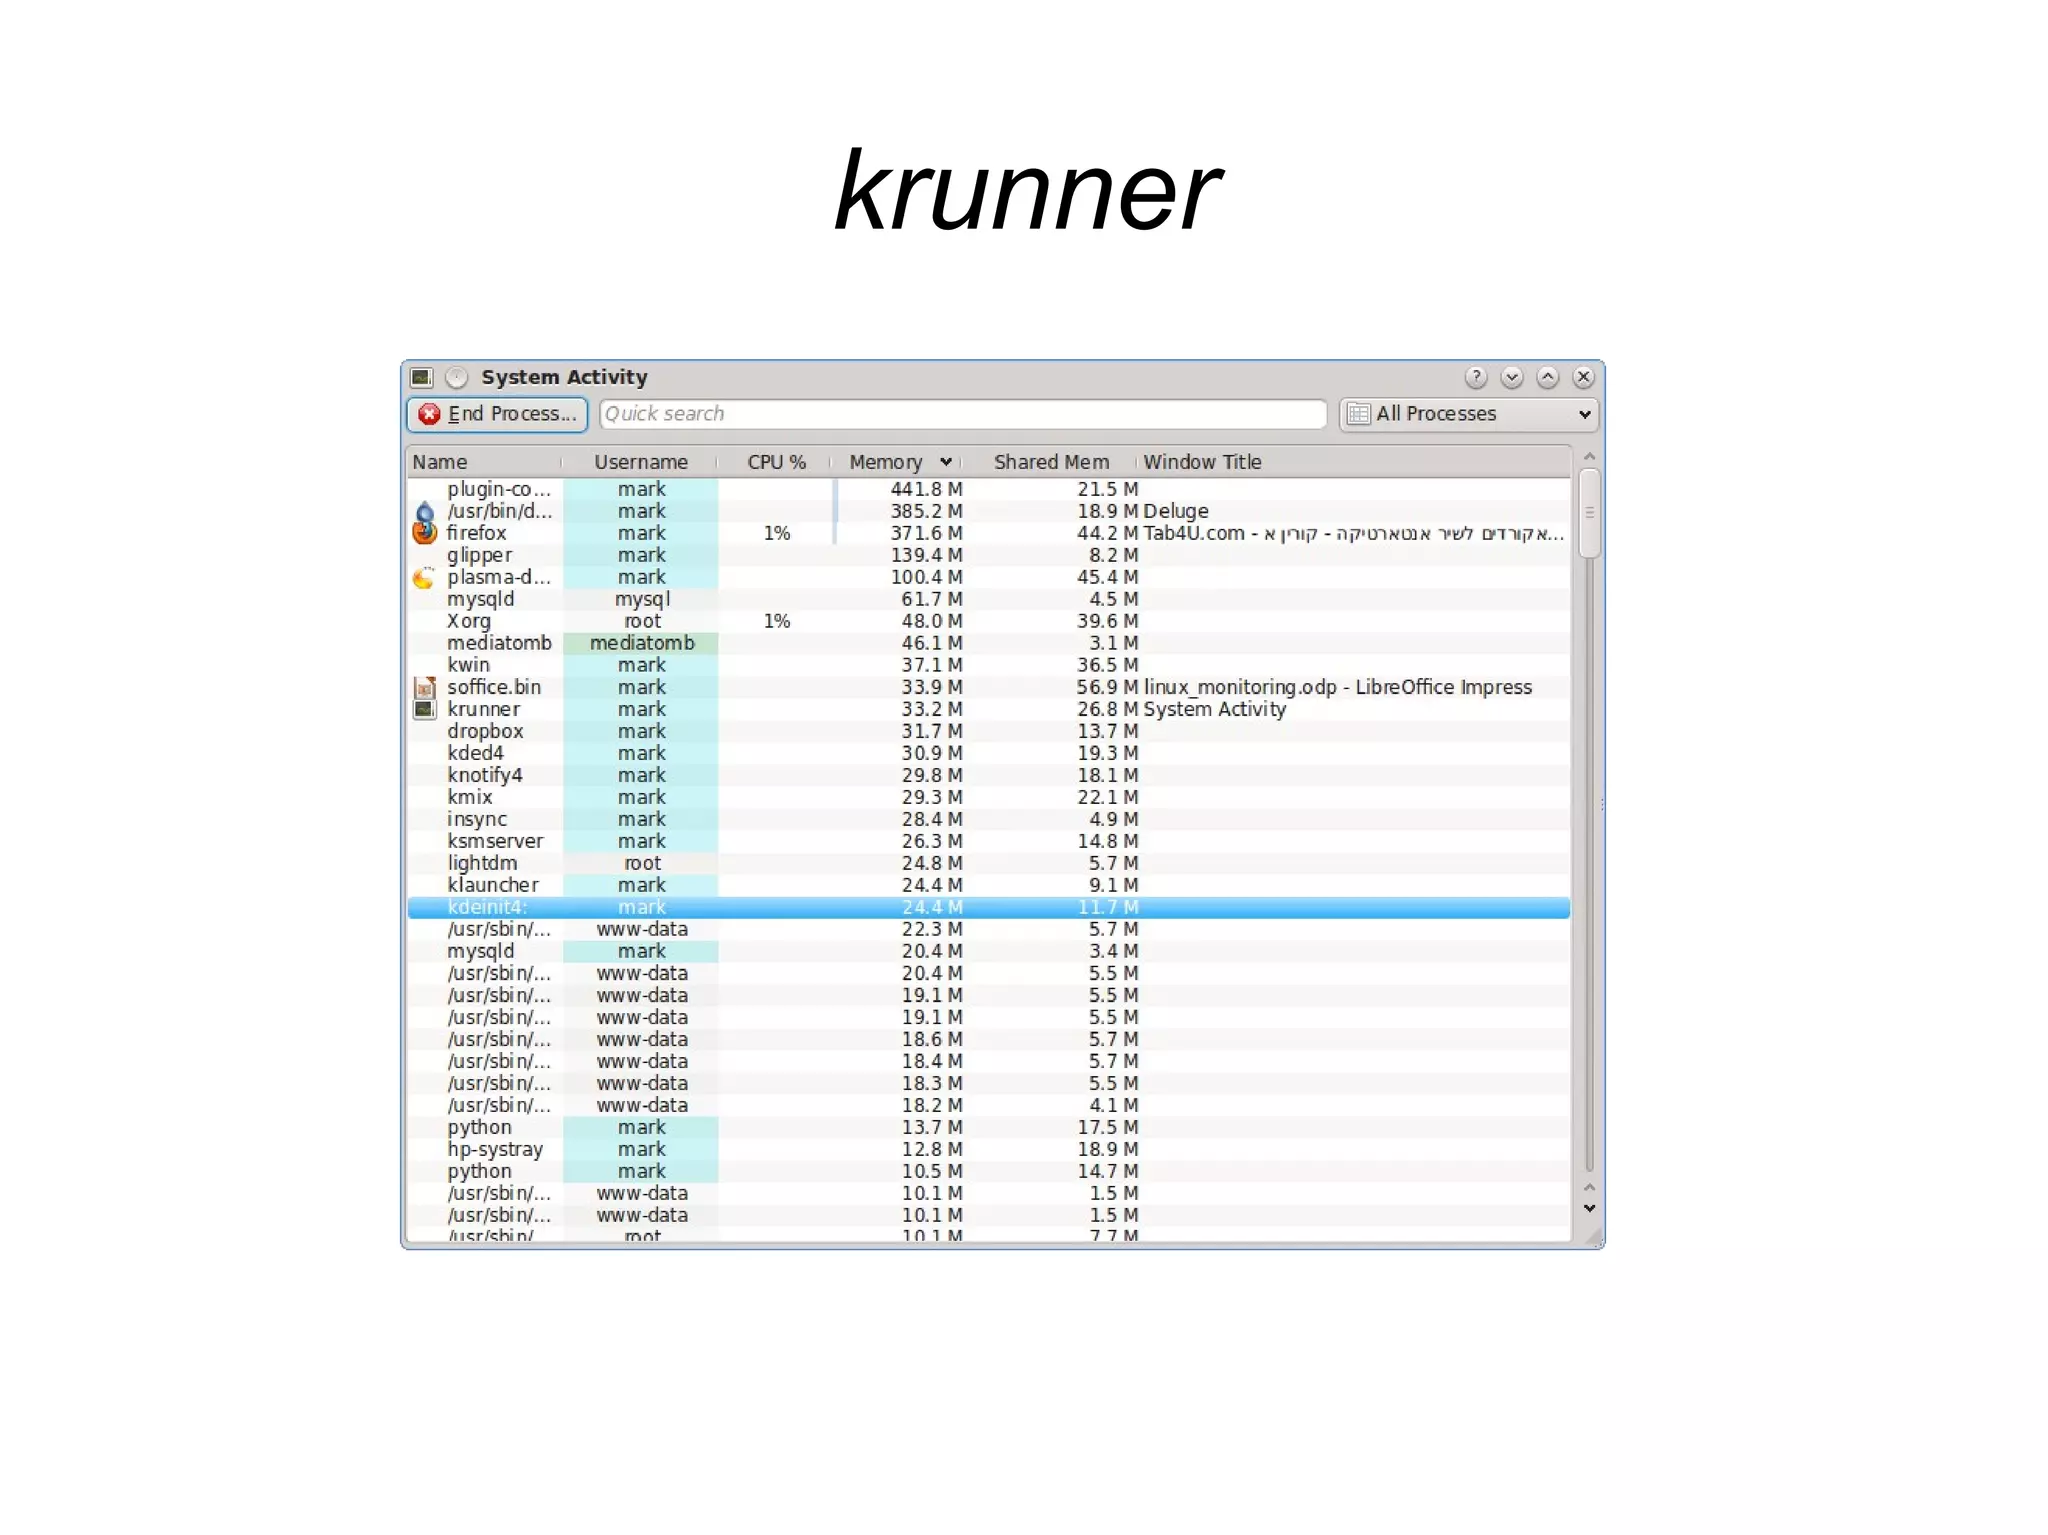
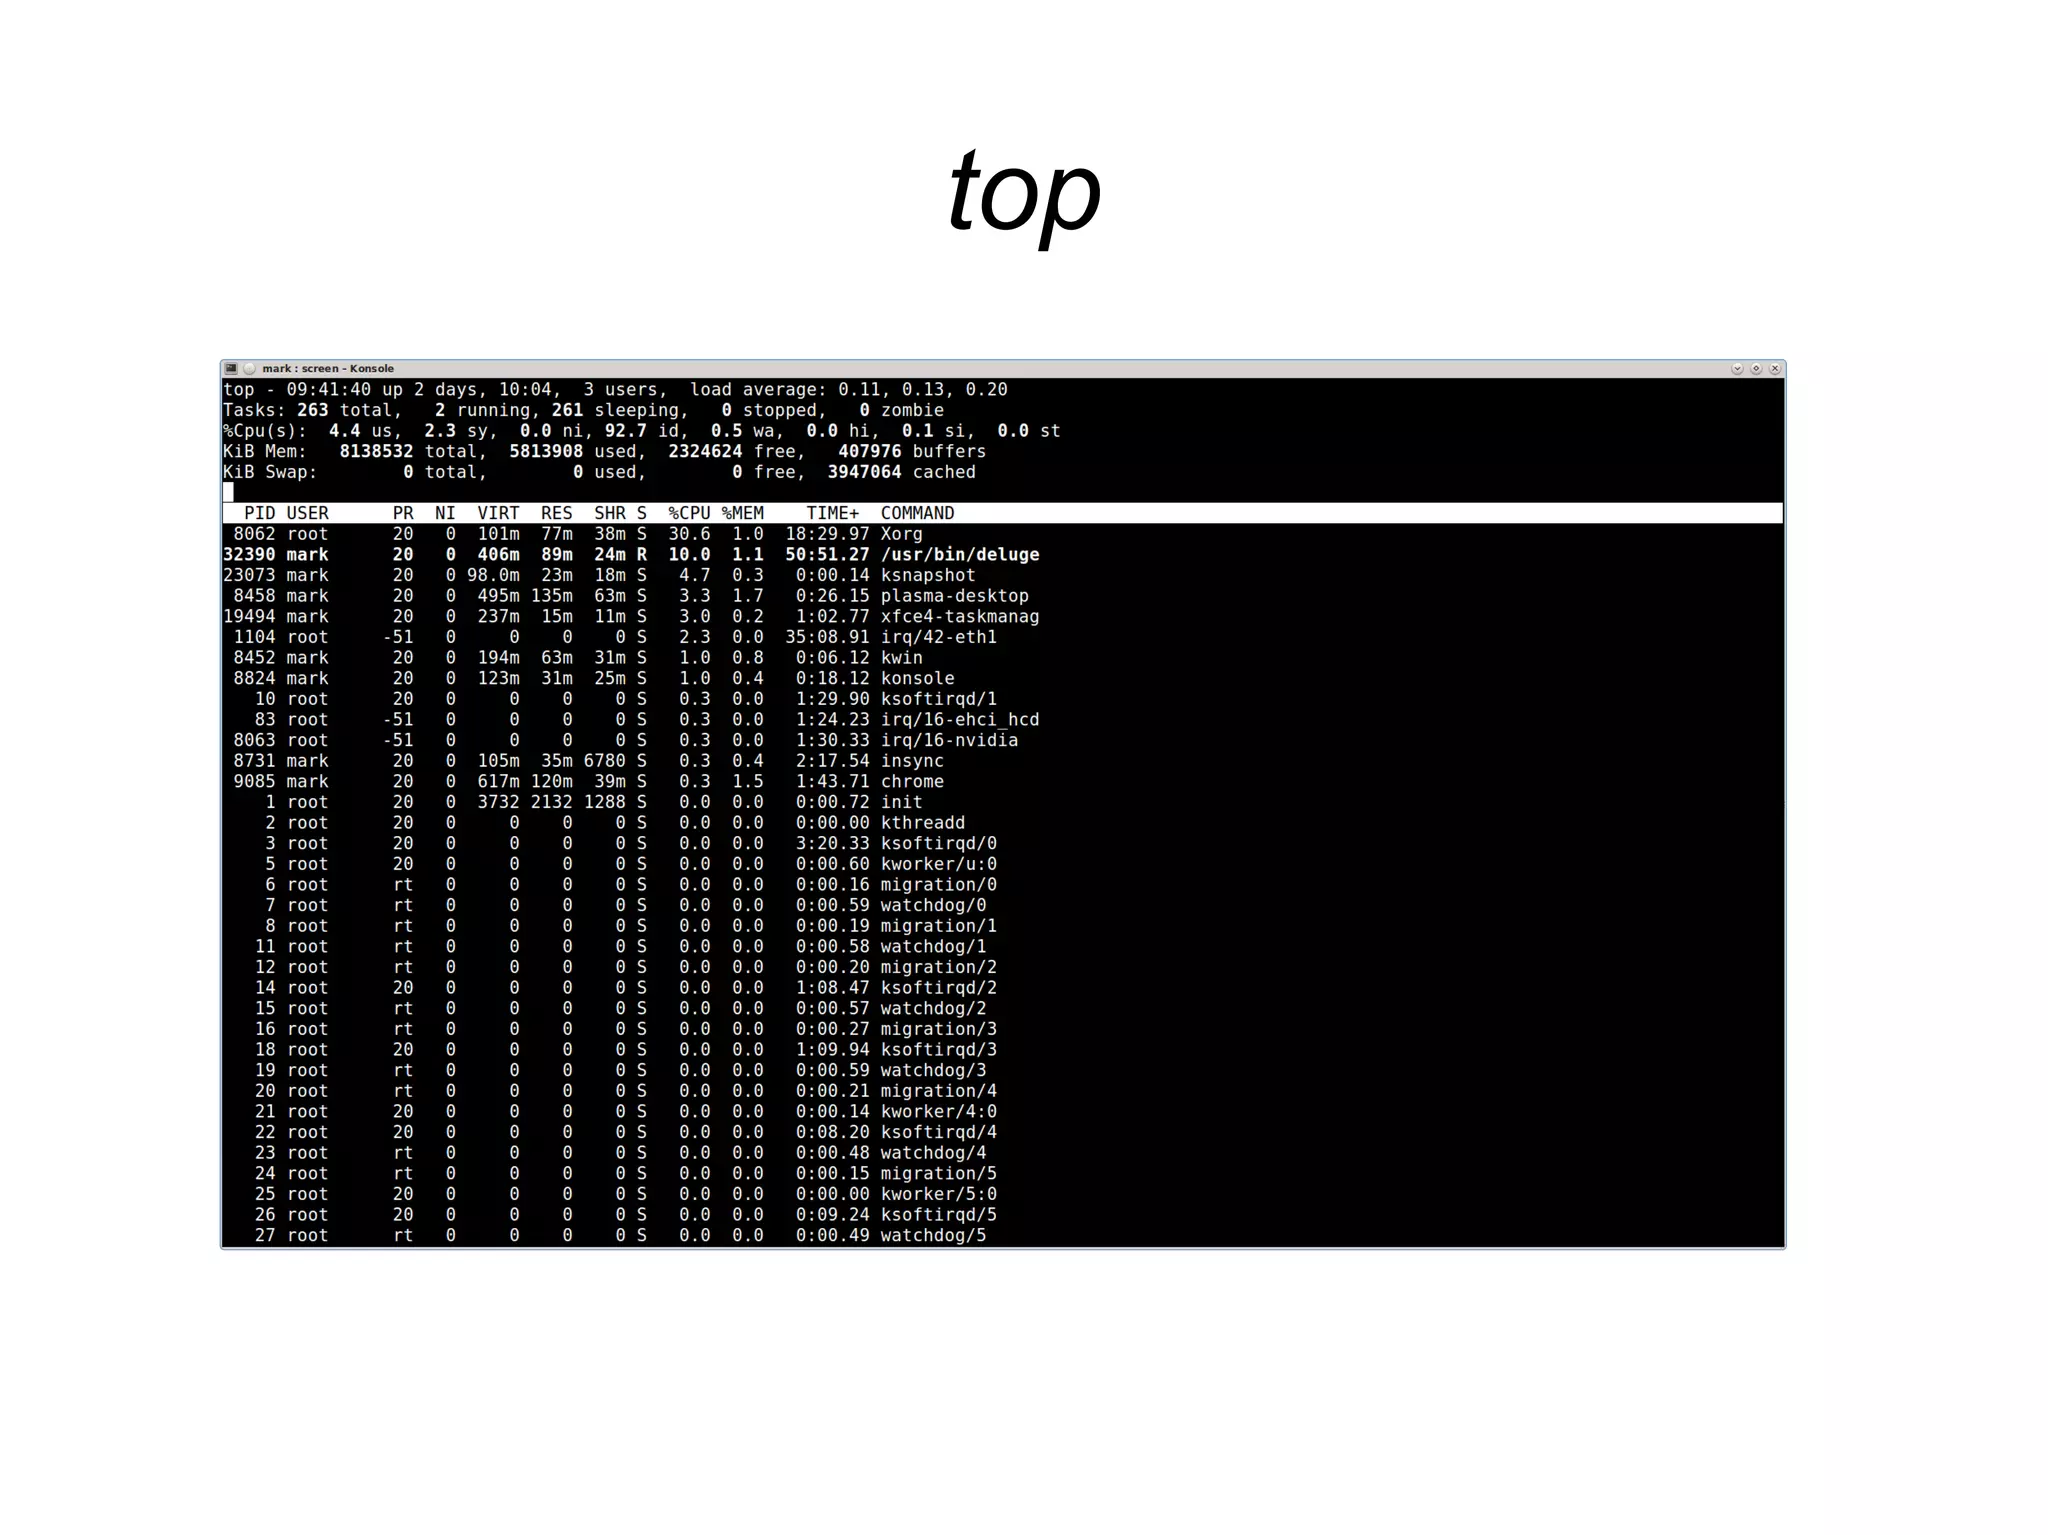
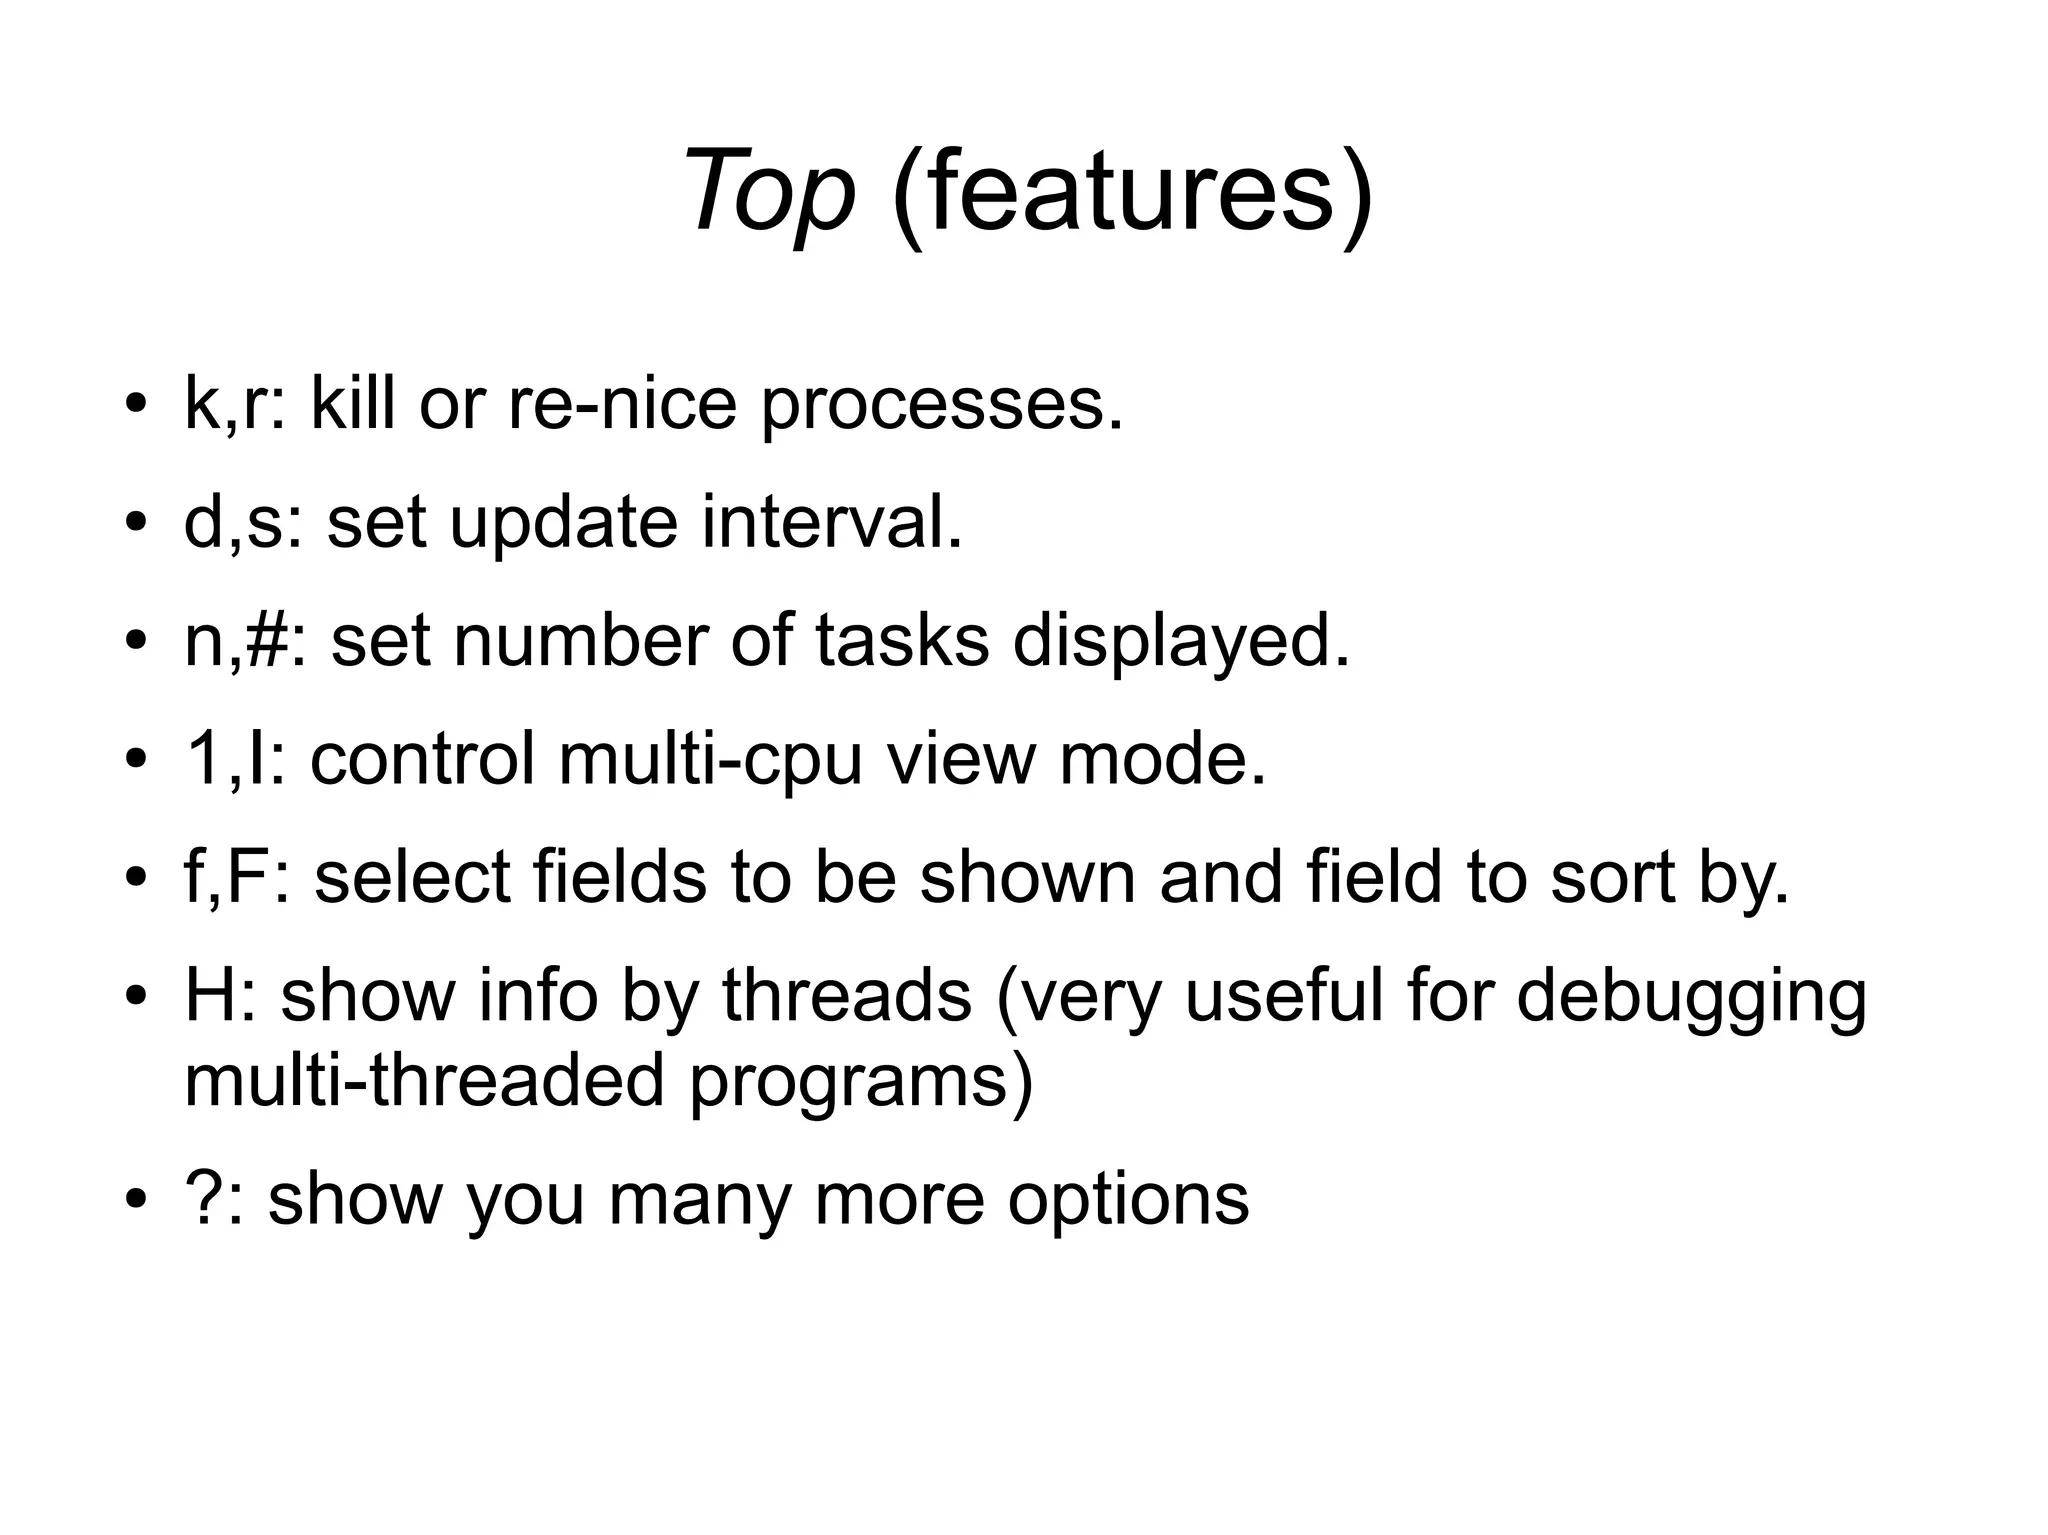
Linux Monitoring
Mark Veltzer
mark@veltzer.net
Monitoring: definition
● Monitoring: The act of observing an application to find
out what it is doing.
● Monitoring can be used for debugging (e.g. it should
not be doing that!)
● Monitoring can be used for performance enhancing an
application (e.g. this part is taking to long, lets optimize
it)
● Monitoring can be used for understanding what an
application does (e.g. I didn't know it opened that file!)
Monitoring in Linux
● Linux has hundreds of tools for monitoring and has
enough facilities to enable you to easily build your own.
● Tools range from GUI tools (much like Windows task
manager) which are OK for beginners, to console GUI
tools which are more sophisticated, to much more
sophisticated command line tools that put to shame
anything you find in windows, to make it on your own
scripts that take data from /proc and other sources.
GUI monitoring tools
● gnome-system-monitor (gnome), ksysguard
(KDE), xfce-task-manager (xfce) and probably
more.
● The one for your desktop is probably already
installed. If not, you may install any of those
using your package manager.
● These can be located in your “start” menu or
could be launched from the command line with
the names above.
gnome-system-monitor
ksysguard
xfce-taskmanager
krunner
The GUI tools
● In all of these you can configure which columns to see for
each task (many columns are available).
● In some of these you can install “plug-ins” that show other
views (like disk usage on each disk in ksysguard).
● In most of these you can kill processes or the like.
● In a lot of the cases you already have a key binding to launch
these when you are logged in to the relevant desktop. For
instance, ksysguard can be launched from the KDE desktop
using CTRL+ESC.
● You can also create your own key bindings to launch these.
Console GUI monitoring tools
● GUI console are applications that have a GUI but
run inside the console.
● This means that you can use them over a terminal
when connecting to a remote machine.
● This makes them favorite amongst system
administrators and programmers since you can
monitor the production environment and your own
environment using the same tool chest.
top(1)
● Top is the most well known monitoring application
for Unix and Linux.
● It is also the one whose hidden features are the
most unknown.
● By default, top shows you the applications
consuming the most CPU at any given point in
time.
● But it can be used for other measurements as
well...
top
Top (features)
● k,r: kill or re-nice processes.
● d,s: set update interval.
● n,#: set number of tasks displayed.
● 1,I: control multi-cpu view mode.
● f,F: select fields to be shown and field to sort by.
● H: show info by threads (very useful for debugging
multi-threaded programs)
● ?: show you many more options
Using the monitoring tools
effectively
● Give your threads/processes names so that
you can understand what you are seeing (see
prctl(2) with PR_SET_NAME).
● Most tools support showing data for just one
thread/process/process group. Use that. e.g.
ps -p
● Use tools like watch(1) or write your own
scripts to automate the tools.

Linux monitoring

  • 1.
  • 2.
    Monitoring: definition ● Monitoring:The act of observing an application to find out what it is doing. ● Monitoring can be used for debugging (e.g. it should not be doing that!) ● Monitoring can be used for performance enhancing an application (e.g. this part is taking to long, lets optimize it) ● Monitoring can be used for understanding what an application does (e.g. I didn't know it opened that file!)
  • 3.
    Monitoring in Linux ●Linux has hundreds of tools for monitoring and has enough facilities to enable you to easily build your own. ● Tools range from GUI tools (much like Windows task manager) which are OK for beginners, to console GUI tools which are more sophisticated, to much more sophisticated command line tools that put to shame anything you find in windows, to make it on your own scripts that take data from /proc and other sources.
  • 4.
    GUI monitoring tools ●gnome-system-monitor (gnome), ksysguard (KDE), xfce-task-manager (xfce) and probably more. ● The one for your desktop is probably already installed. If not, you may install any of those using your package manager. ● These can be located in your “start” menu or could be launched from the command line with the names above.
  • 5.
  • 6.
  • 7.
  • 8.
  • 9.
    The GUI tools ●In all of these you can configure which columns to see for each task (many columns are available). ● In some of these you can install “plug-ins” that show other views (like disk usage on each disk in ksysguard). ● In most of these you can kill processes or the like. ● In a lot of the cases you already have a key binding to launch these when you are logged in to the relevant desktop. For instance, ksysguard can be launched from the KDE desktop using CTRL+ESC. ● You can also create your own key bindings to launch these.
  • 10.
    Console GUI monitoringtools ● GUI console are applications that have a GUI but run inside the console. ● This means that you can use them over a terminal when connecting to a remote machine. ● This makes them favorite amongst system administrators and programmers since you can monitor the production environment and your own environment using the same tool chest.
  • 11.
    top(1) ● Top isthe most well known monitoring application for Unix and Linux. ● It is also the one whose hidden features are the most unknown. ● By default, top shows you the applications consuming the most CPU at any given point in time. ● But it can be used for other measurements as well...
  • 12.
  • 13.
    Top (features) ● k,r:kill or re-nice processes. ● d,s: set update interval. ● n,#: set number of tasks displayed. ● 1,I: control multi-cpu view mode. ● f,F: select fields to be shown and field to sort by. ● H: show info by threads (very useful for debugging multi-threaded programs) ● ?: show you many more options
  • 14.
    Using the monitoringtools effectively ● Give your threads/processes names so that you can understand what you are seeing (see prctl(2) with PR_SET_NAME). ● Most tools support showing data for just one thread/process/process group. Use that. e.g. ps -p ● Use tools like watch(1) or write your own scripts to automate the tools.