Downloaded 182 times


![19
● [1] http://tldp.org - The Linux System Administrator's Guide
● [2] http://www.tecmint.com/command-line-tools-to-monitor-linux-performance/
● [3] http://www.cyberciti.biz/tips/top-linux-monitoring-tools.html/top-output
References](https://image.slidesharecdn.com/monitoring920626-130917064207-phpapp01/85/Linux-System-Monitoring-basic-commands-19-320.jpg)

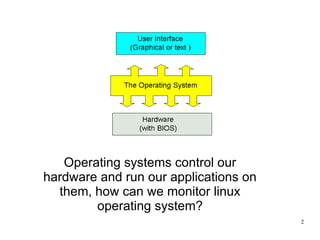
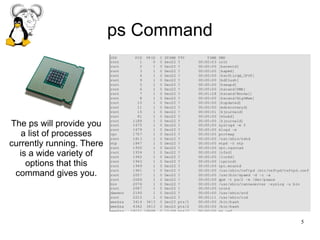
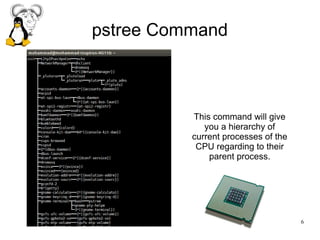
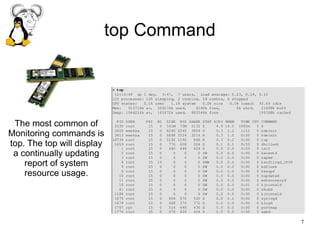
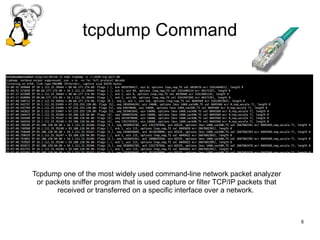
The document discusses various command line tools for monitoring the Linux operating system and its hardware components, including CPU, memory, and network performance. It provides an overview of key commands such as ps, top, tcpdump, and others, explaining their functionalities in assessing system resources and performance. Additionally, it includes links to further resources for Linux system administration and monitoring tools.