Downloaded 20 times
![Performance and Statistics Collector (Perfstat 7-mode)
7.36 UNIX/Linux, 7.36 Windows
Windows
rsh may hang if there are no remaining ports on the filer for the stderr socket. The filer will indicate "couldn't
connect second port". Perfstat should detect and abort the command, but output from the command is lost, and in
rare circumstances the command may have to be killed by hand.
Aborted instances of rsh may cause console warnings about inaccessible files.
Windows disk performance counters are assumed to be enabled. Older versions of windows may require explicit
activation with diskperf -y and a reboot.
Perfstat on Windows XP Service Pack 2 will display "Terminal read..." errors. This is a problem in rsh.exe - see
Microsoft KB article: KB892099.
Perfstat: Version 7.36 4-2011
- perfstat.exe is a tool for capturing performance
and configuration statistics.
- Output from perfstat is sent to standard out and
is typically captured in an output file for
later analysis.
- perfstat.exe is capable of capturing info from one Windows host and
multiple NetApp storage controllers simultaneously.
- For controller data capture, the user must have RSH or
SSH privileges to the controller. Unless instructed otherwise,
perfstat will use 'root' as the default username to communicate
remotely with storage controllers.
Usage: (basic options list)
perfstat [-f controllername] [-t time] > perfstat.out
perfstat –f akfiler7.ak.providence.org -t 5 -I 5 -I > perfstat"Date_%date:~4,2%%date:~7,2%%date:~10,4%Time_%time:~0,2%h%time:~3,2%m%time:~6,2%s"
H:NAUtilyperfstat7_20110411.exe -f NAS2854 -t 5 -I 5 -I > perfstat"NAS2854_Date_%date:~4,2%%date:~7,2%%date:~10,4%Time_%time:~0,2%h%time:~3,2%m%time:~6,2%s"
where:
-f controllername - host name or IP address of target controller
-t time - collect performance data for 'time' minutes
Simple Example:
Capture data on local host and one controller for 5 minutes:
perfstat -f controller1 -t 5 > perfstat.out
Capture data on multiple hosts and controllers for 10 minutes:
perfstat -f controller1,controller2 -t 10 > perfstat.out
Capture data for five 1 minute iterations, with 10 minutes between
successive iterations:
perfstat -f controller1 -t 1 -i 5,10 > perfstat.out](https://image.slidesharecdn.com/perfstatwindows-131208114628-phpapp01/85/Perf-stat-windows-1-320.jpg)
![Performance and Statistics Collector (Perfstat 7-mode)
7.36 UNIX/Linux, 7.36 Windows
Windows
rsh may hang if there are no remaining ports on the filer for the stderr socket. The filer will indicate "couldn't
connect second port". Perfstat should detect and abort the command, but output from the command is lost, and in
rare circumstances the command may have to be killed by hand.
Aborted instances of rsh may cause console warnings about inaccessible files.
Windows disk performance counters are assumed to be enabled. Older versions of windows may require explicit
activation with diskperf -y and a reboot.
Perfstat on Windows XP Service Pack 2 will display "Terminal read..." errors. This is a problem in rsh.exe - see
Microsoft KB article: KB892099.
Perfstat: Version 7.36 4-2011
- perfstat.exe is a tool for capturing performance
and configuration statistics.
- Output from perfstat is sent to standard out and
is typically captured in an output file for
later analysis.
- perfstat.exe is capable of capturing info from one Windows host and
multiple NetApp storage controllers simultaneously.
- For controller data capture, the user must have RSH or
SSH privileges to the controller. Unless instructed otherwise,
perfstat will use 'root' as the default username to communicate
remotely with storage controllers.
Usage: (basic options list)
perfstat [-f controllername] [-t time] > perfstat.out
perfstat –f akfiler7.ak.providence.org -t 5 -I 5 -I > perfstat"Date_%date:~4,2%%date:~7,2%%date:~10,4%Time_%time:~0,2%h%time:~3,2%m%time:~6,2%s"
H:NAUtilyperfstat7_20110411.exe -f NAS2854 -t 5 -I 5 -I > perfstat"NAS2854_Date_%date:~4,2%%date:~7,2%%date:~10,4%Time_%time:~0,2%h%time:~3,2%m%time:~6,2%s"
where:
-f controllername - host name or IP address of target controller
-t time - collect performance data for 'time' minutes
Simple Example:
Capture data on local host and one controller for 5 minutes:
perfstat -f controller1 -t 5 > perfstat.out
Capture data on multiple hosts and controllers for 10 minutes:
perfstat -f controller1,controller2 -t 10 > perfstat.out
Capture data for five 1 minute iterations, with 10 minutes between
successive iterations:
perfstat -f controller1 -t 1 -i 5,10 > perfstat.out](https://image.slidesharecdn.com/perfstatwindows-131208114628-phpapp01/75/Perf-stat-windows-1-2048.jpg)
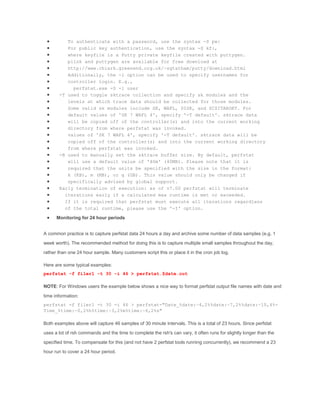
![Usage: (more
perfstat
[-f
[-t
[-i
complete options list)
controllername[,controllername1,controllername2,...]]
time] (sample time per iteration, default 2)
n[,m]] (repeat n times with m minutes between samples,
defaults: n=1,m=0)
[-I] (force perfstat to execute all iterations)
[-l login[:password]] (rsh/ssh login and password for rsh only)
[-F] (do not capture information from local host)
[-V] (do not capture vfiler data)
[-p] (capture performance data only, no config info
[-c] (capture config info only, no performance data
[-L] (capture logs - beware verbose output
[-E cmd[,cmd2,cmd3]... (exclude commands)
[-P domain1[,domain2,domain3...] (capture profiles,
use "-P flat" to capture complete profile)
[-v] (print version info only)
[-q] (quiet mode - suppress all console input)
[-x] (print what commands will be issued without actually
issuing them
[-d] (debug mode - beware verbose output)
[-m msinfo_path] (path to msinfo32.exe)
[-S pw:|kf:] (use ssh instead of rsh)
[-k] (disable collection of "stutter" statit; i.e.,
collect 1 statit report that covers the entire
iteration)
[-K] (collect only "stutter" statit reports over
the entire iteration)
[-T default | sk_mod,level[,sk_mod2,level,...]] (collect sktrace)
[-B sk_buffer_size] (specify sktrace buffer size)
[-C seconds] (the number of seconds to wait on command processesdefault is 70 seconds)
[-w minutes] (total number of minutes to wait for perfstat
execution to complete. Default will be 5 minutes)
Notes:
-P saves profiling data in a subdirectory 'gmon' of the current working
directory and deletes any existing gmon files on the controller
-E exludes all foreground commands that have at least the cmd as a
substring; E.g.
-E snap,vol
- excludes all 'snap*' and 'vol*' commands
-E "snap list -v" - excludes only the command 'snap list -v'
-S requires the plink ssh client to be available in the working path](https://image.slidesharecdn.com/perfstatwindows-131208114628-phpapp01/85/Perf-stat-windows-2-320.jpg)


Perfstat is a tool for capturing performance and configuration statistics from Windows hosts and NetApp storage controllers. It uses rsh/ssh to remotely collect data. Perfstat can capture data from one Windows system and multiple controllers simultaneously over a specified time period. It is commonly used to monitor systems for 24 hours by running multiple short samples throughout the day rather than one long sample.