The document covers measures of central tendency including mean, median, and mode, explaining their calculation methods and when to use each measure. It also discusses measures of variation such as variance, standard deviation, and coefficient of variation, highlighting their importance in describing data distributions. Additionally, the relationships between mean, median, and mode in different distributions are illustrated with examples.

![Find the mean of the following data:
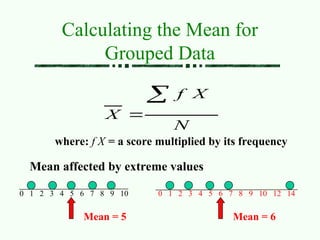
Mean =
[3(10)+10(9)+9(8)+8(7)+10(6)+
2(5)]/42 = 7.57
Score Number of
students
10 3
9 10
8 9
7 8
6 10
5 2
Calculating the Mean for
Grouped Data](https://image.slidesharecdn.com/measuresofcentraltendency-240919093904-41bf687a/85/Measures-of-Central-Tendency-Presentation-ppt-8-320.jpg)


![제 23회 보아즈(BOAZ) 빅데이터 컨퍼런스 - [MBOAX] : ABSA를 활용한 소비자 반응 분석 기반 운영 효율화 대시보드 설계](https://cdn.slidesharecdn.com/ss_thumbnails/3-1boaz23rdconferencemboax-260203102709-9d519923-thumbnail.jpg?width=640&height=640&fit=bounds)


