Downloaded 27 times
![Distributed Energy Investment as an Alternative to Distribution Upgrades in Rural Areas
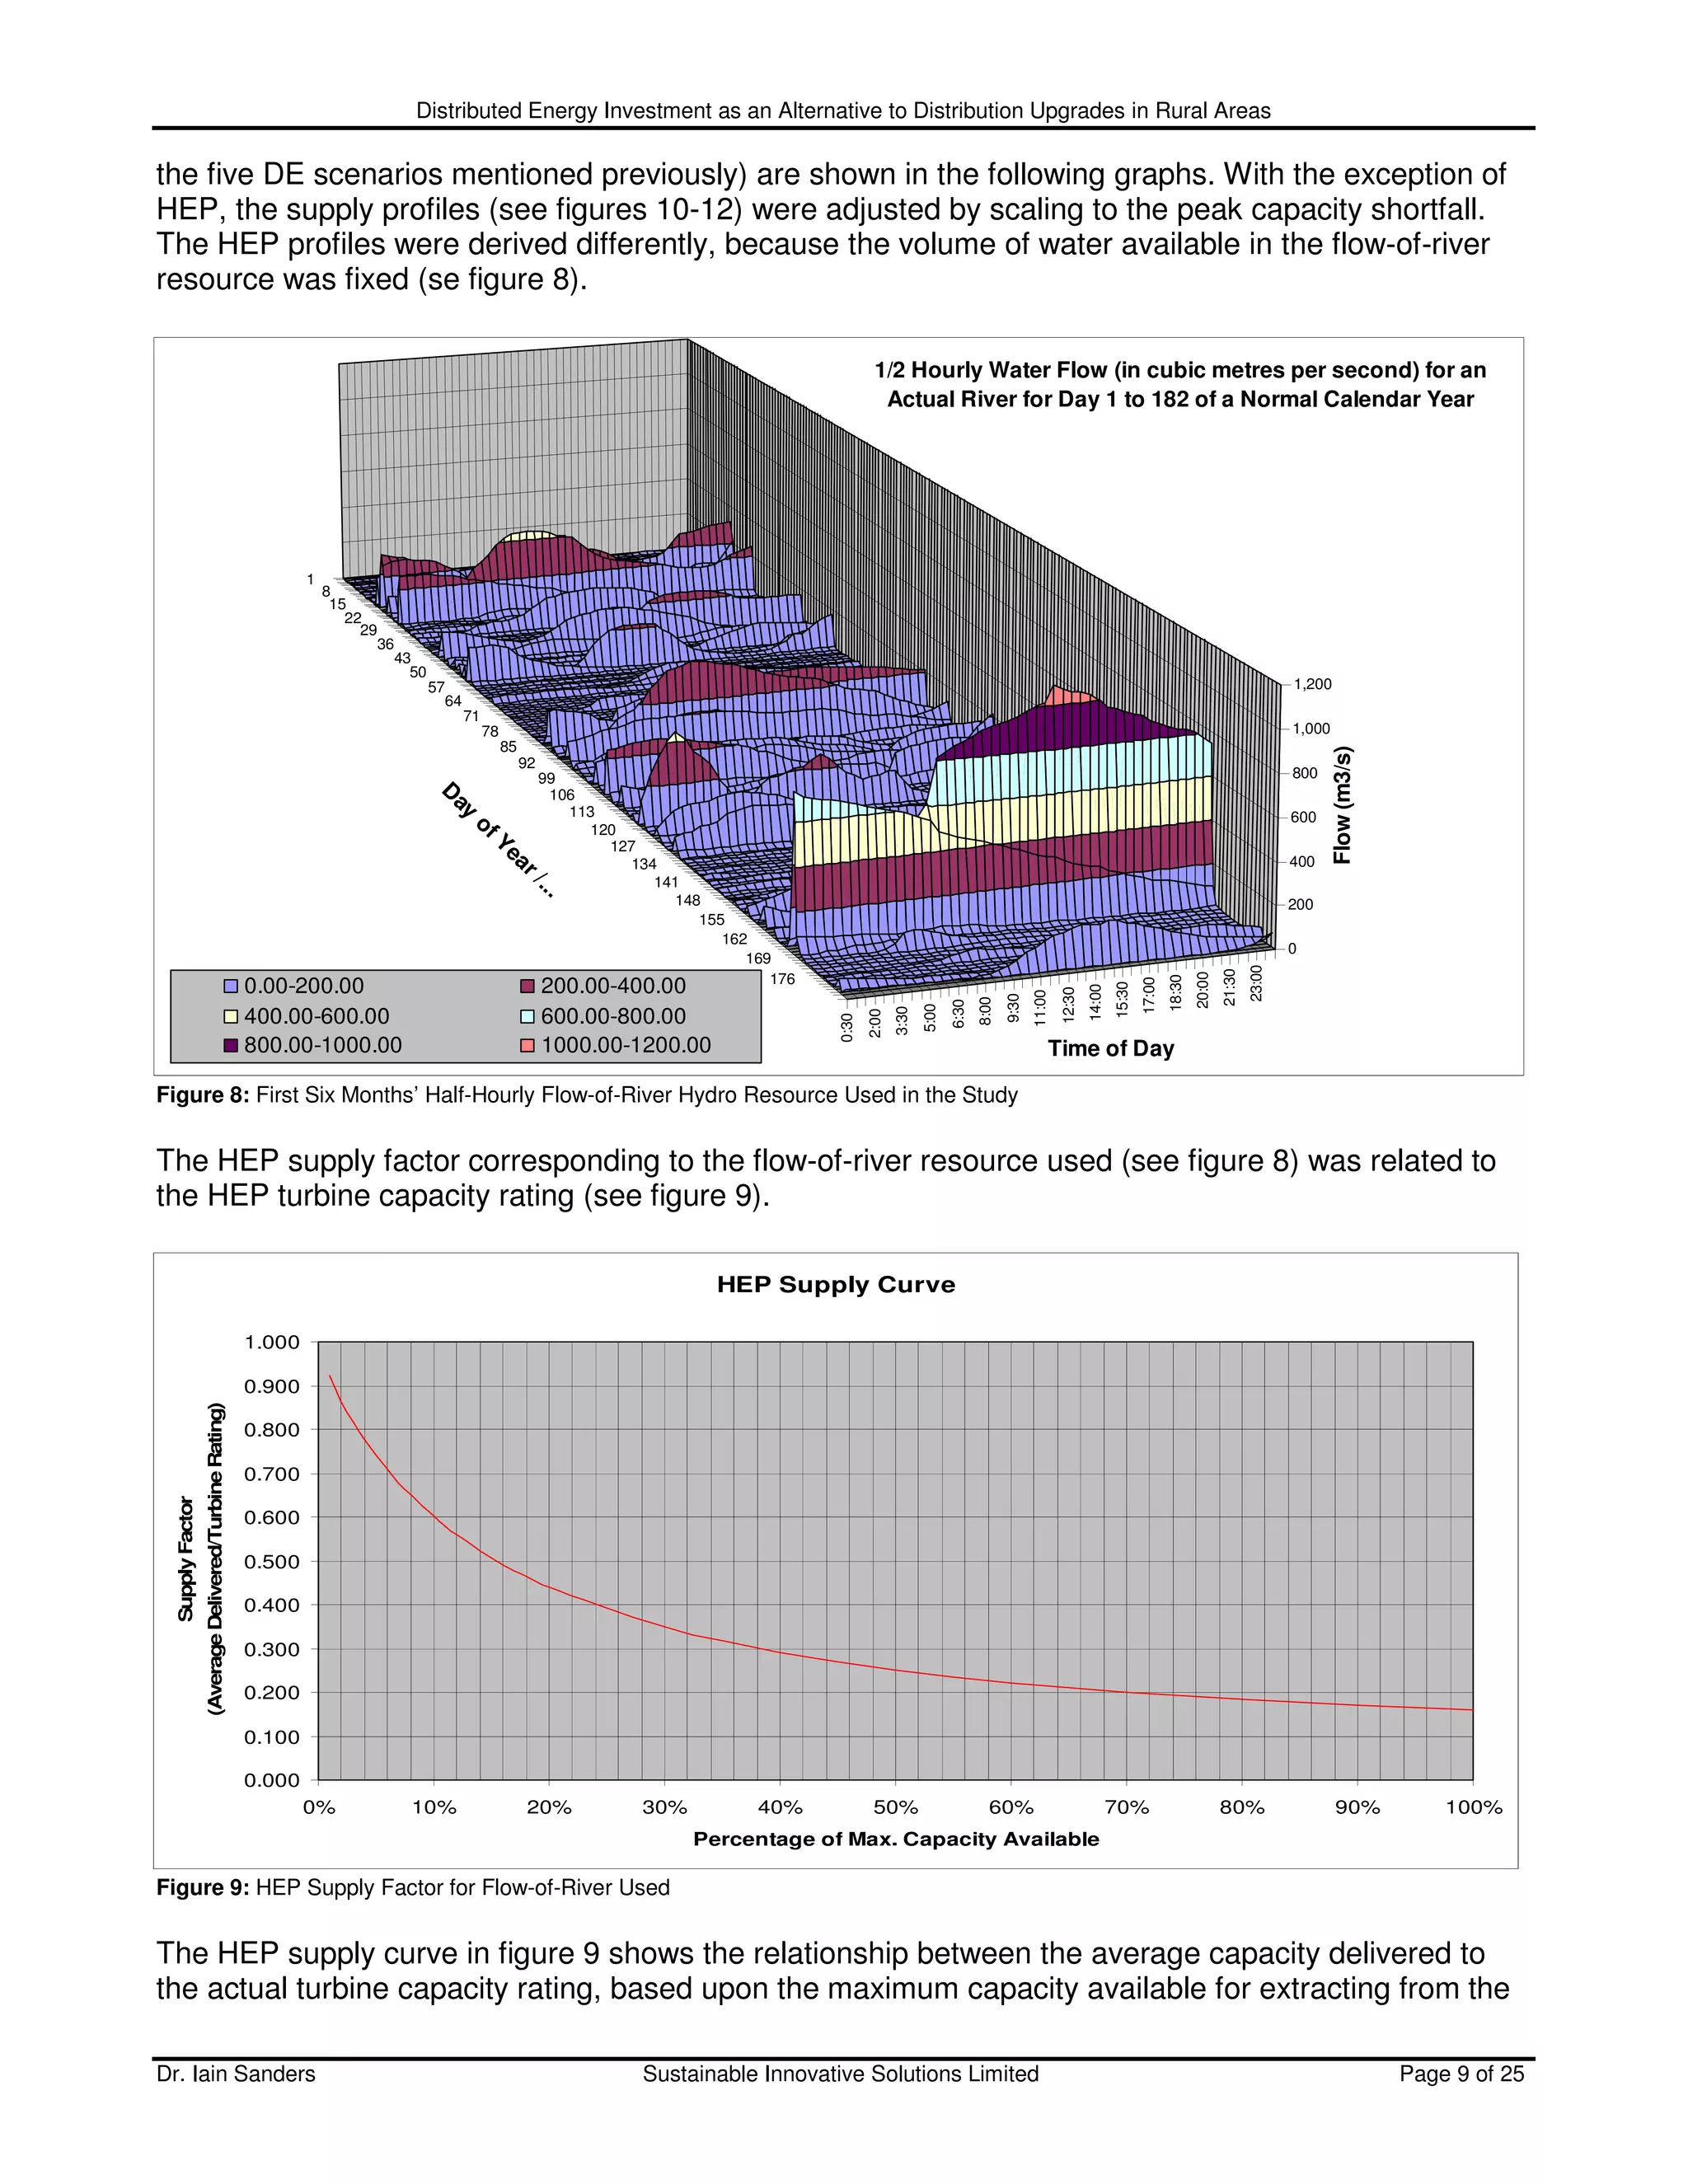
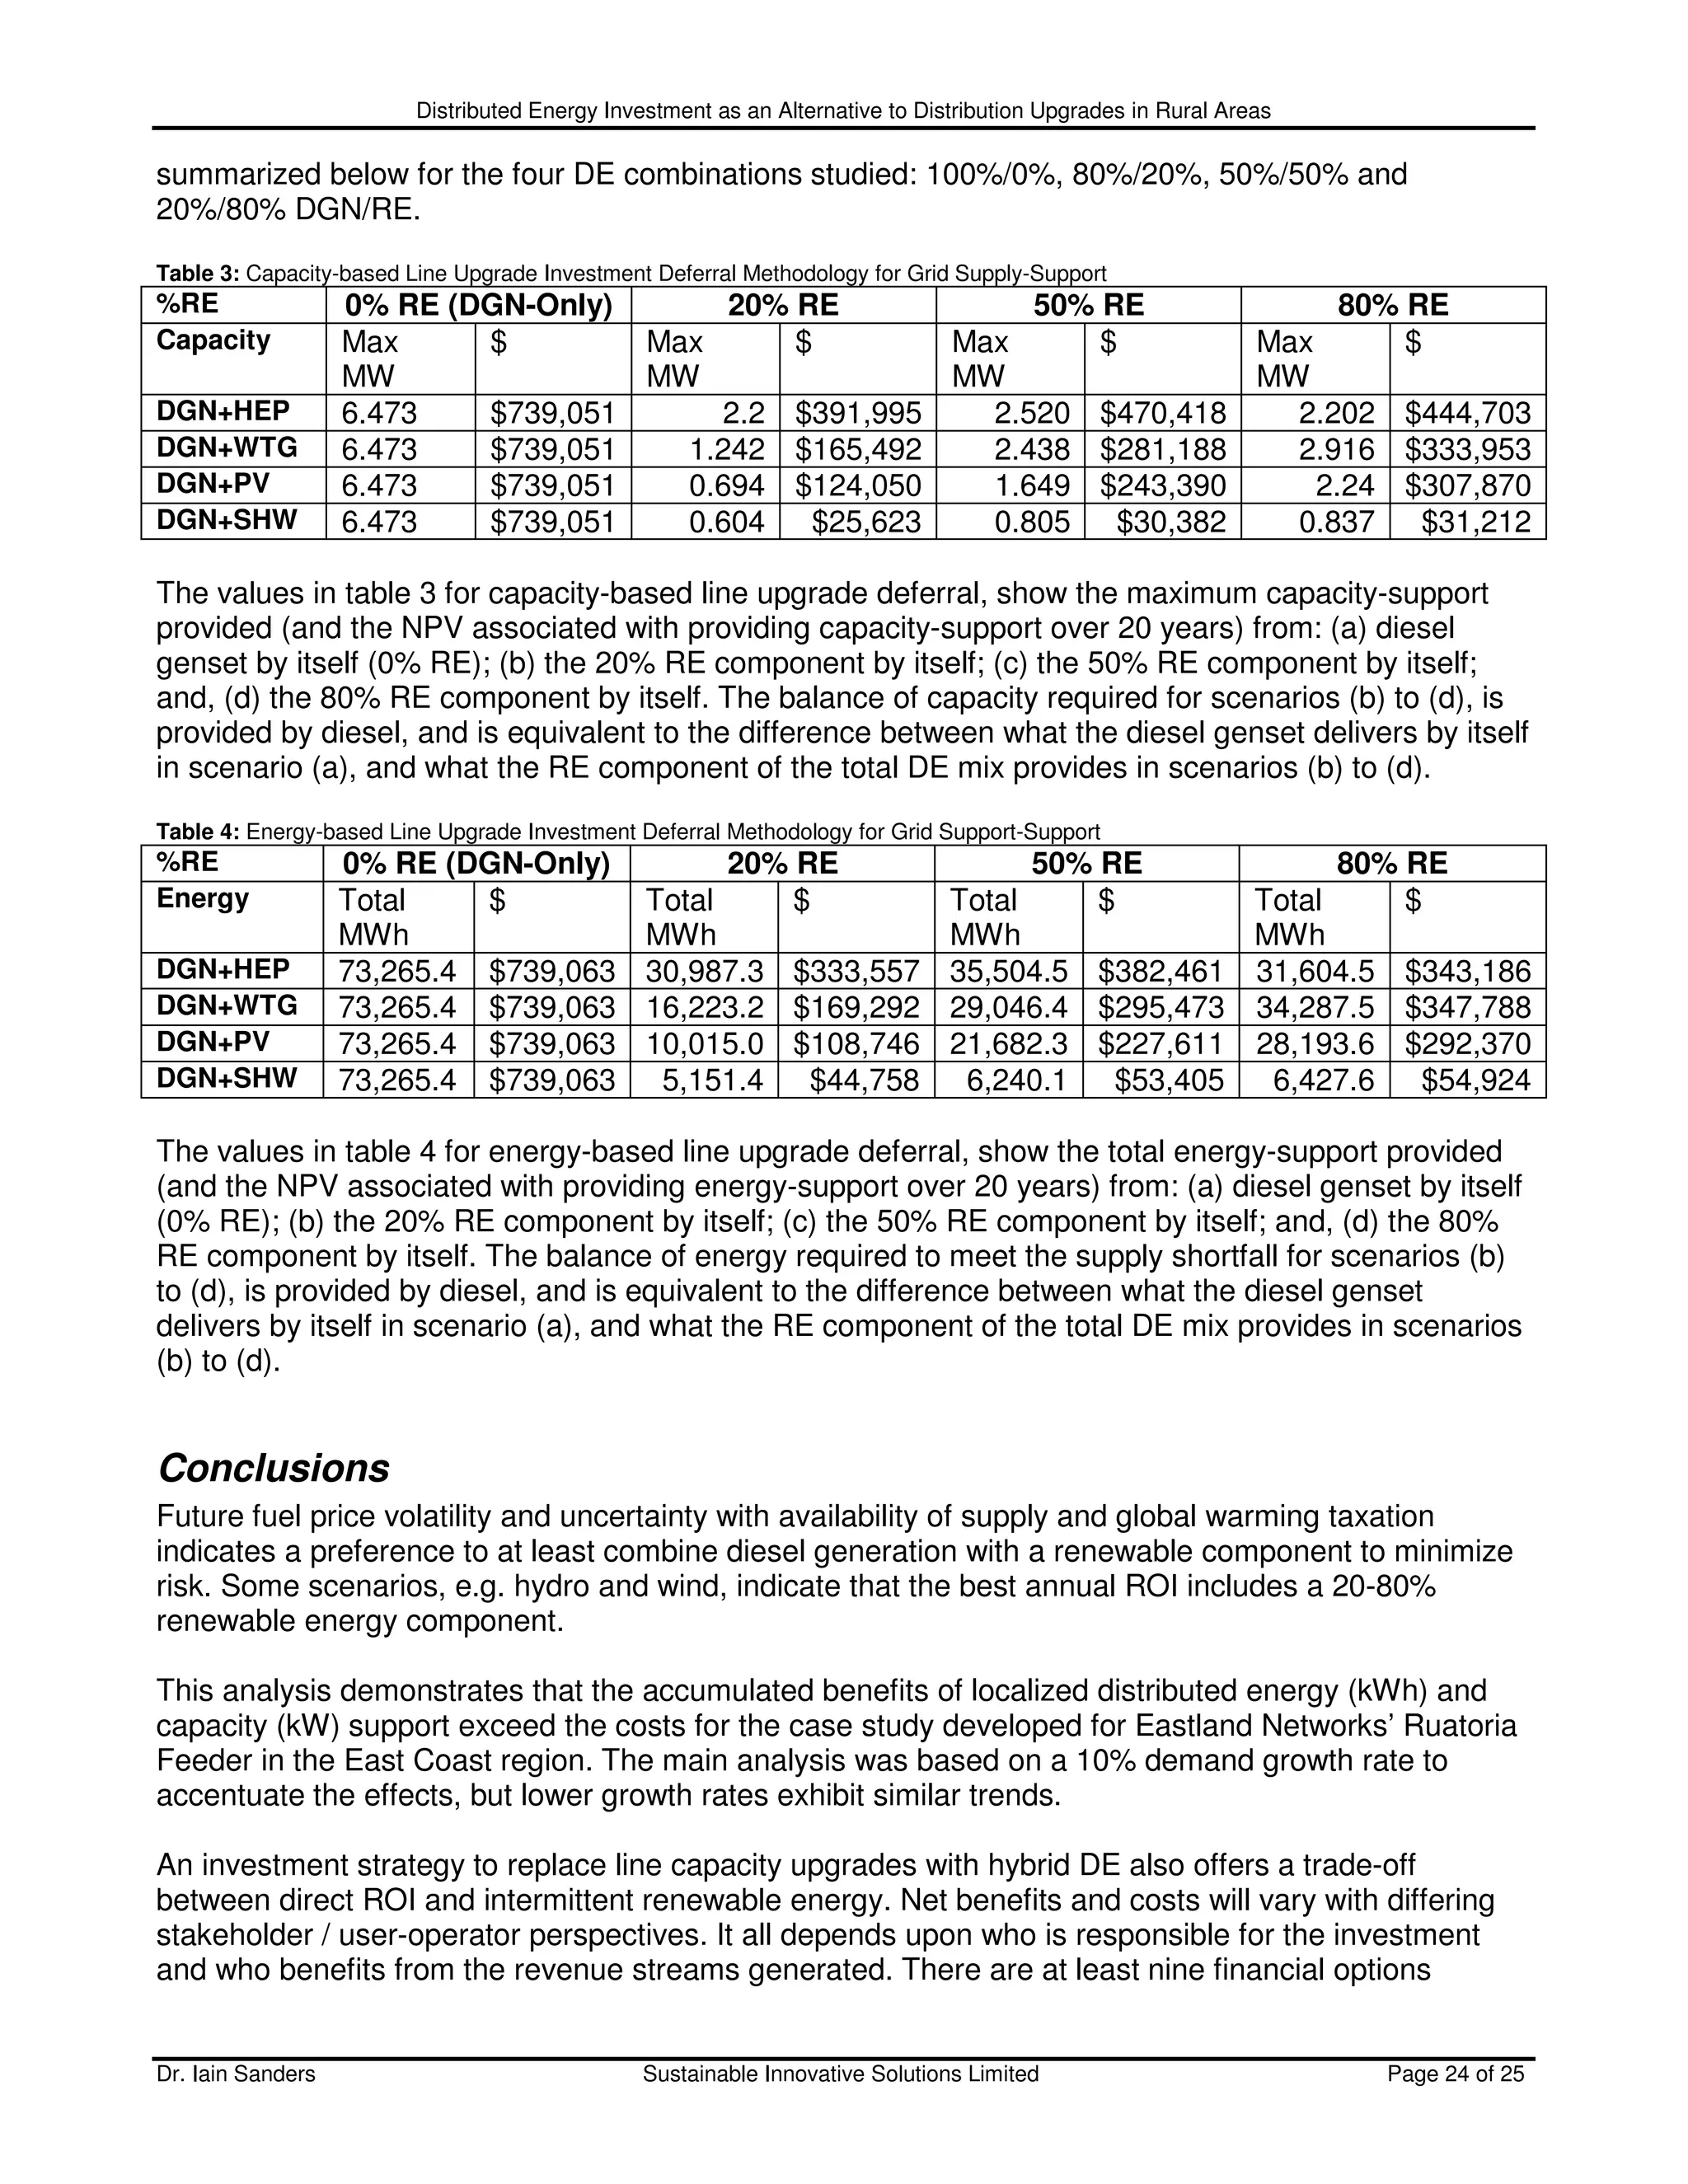
capacity supplied is increased. The net cost increases because the size of the HEP, WTG, PVS or
SHW system increases, and the capital cost is directly proportional to the name plate capacity rating
of each RE system. However, overall, the % ROI reduces for a larger investment in renewables
because small scale renewables at present show a lower ROI than diesel gensets. This is the cost
one must pay if wishing to maintain or increase the renewable component of a strategic DG policy.
The HEP-DGN benefit scenario in figure 16 is unusual, in that at about 50%/50% HEP/DGN the return
becomes negative (cost is greater than the benefit). The explanation for this is tied to the HEP supply
factor graph given in figure 9. The larger HEP system in figure 16 has a lower supply factor (see figure
9), implying that less peak capacity is available to match the peak demand required for line upgrade
deferral.
Net DE [RE+Genset] Cost-Benefit from Different Renewable Ratios in the Genset-Renewable DE Mix
$11,000,000
$10,000,000
Benefit
Net Cost-Benefit in NPV (Over 20 Years)
$9,000,000
$8,000,000
Cost
Hydro-DE Cost
$7,000,000 Wind-DE Cost
PV-DE Cost
$6,000,000
SHW-DE Cost
$5,000,000 Hydro-Benefit
Wind-Benefit
$4,000,000
PV-Benefit
$3,000,000 SHW-Benefit
$2,000,000
$1,000,000
$0
0% 10% 20% 30% 40% 50% 60% 70% 80% 90%
Percentage of Renewable Present
Figure 17: Combined RE-DGN Cost-Benefit Analysis for Various RE-DGN ratios
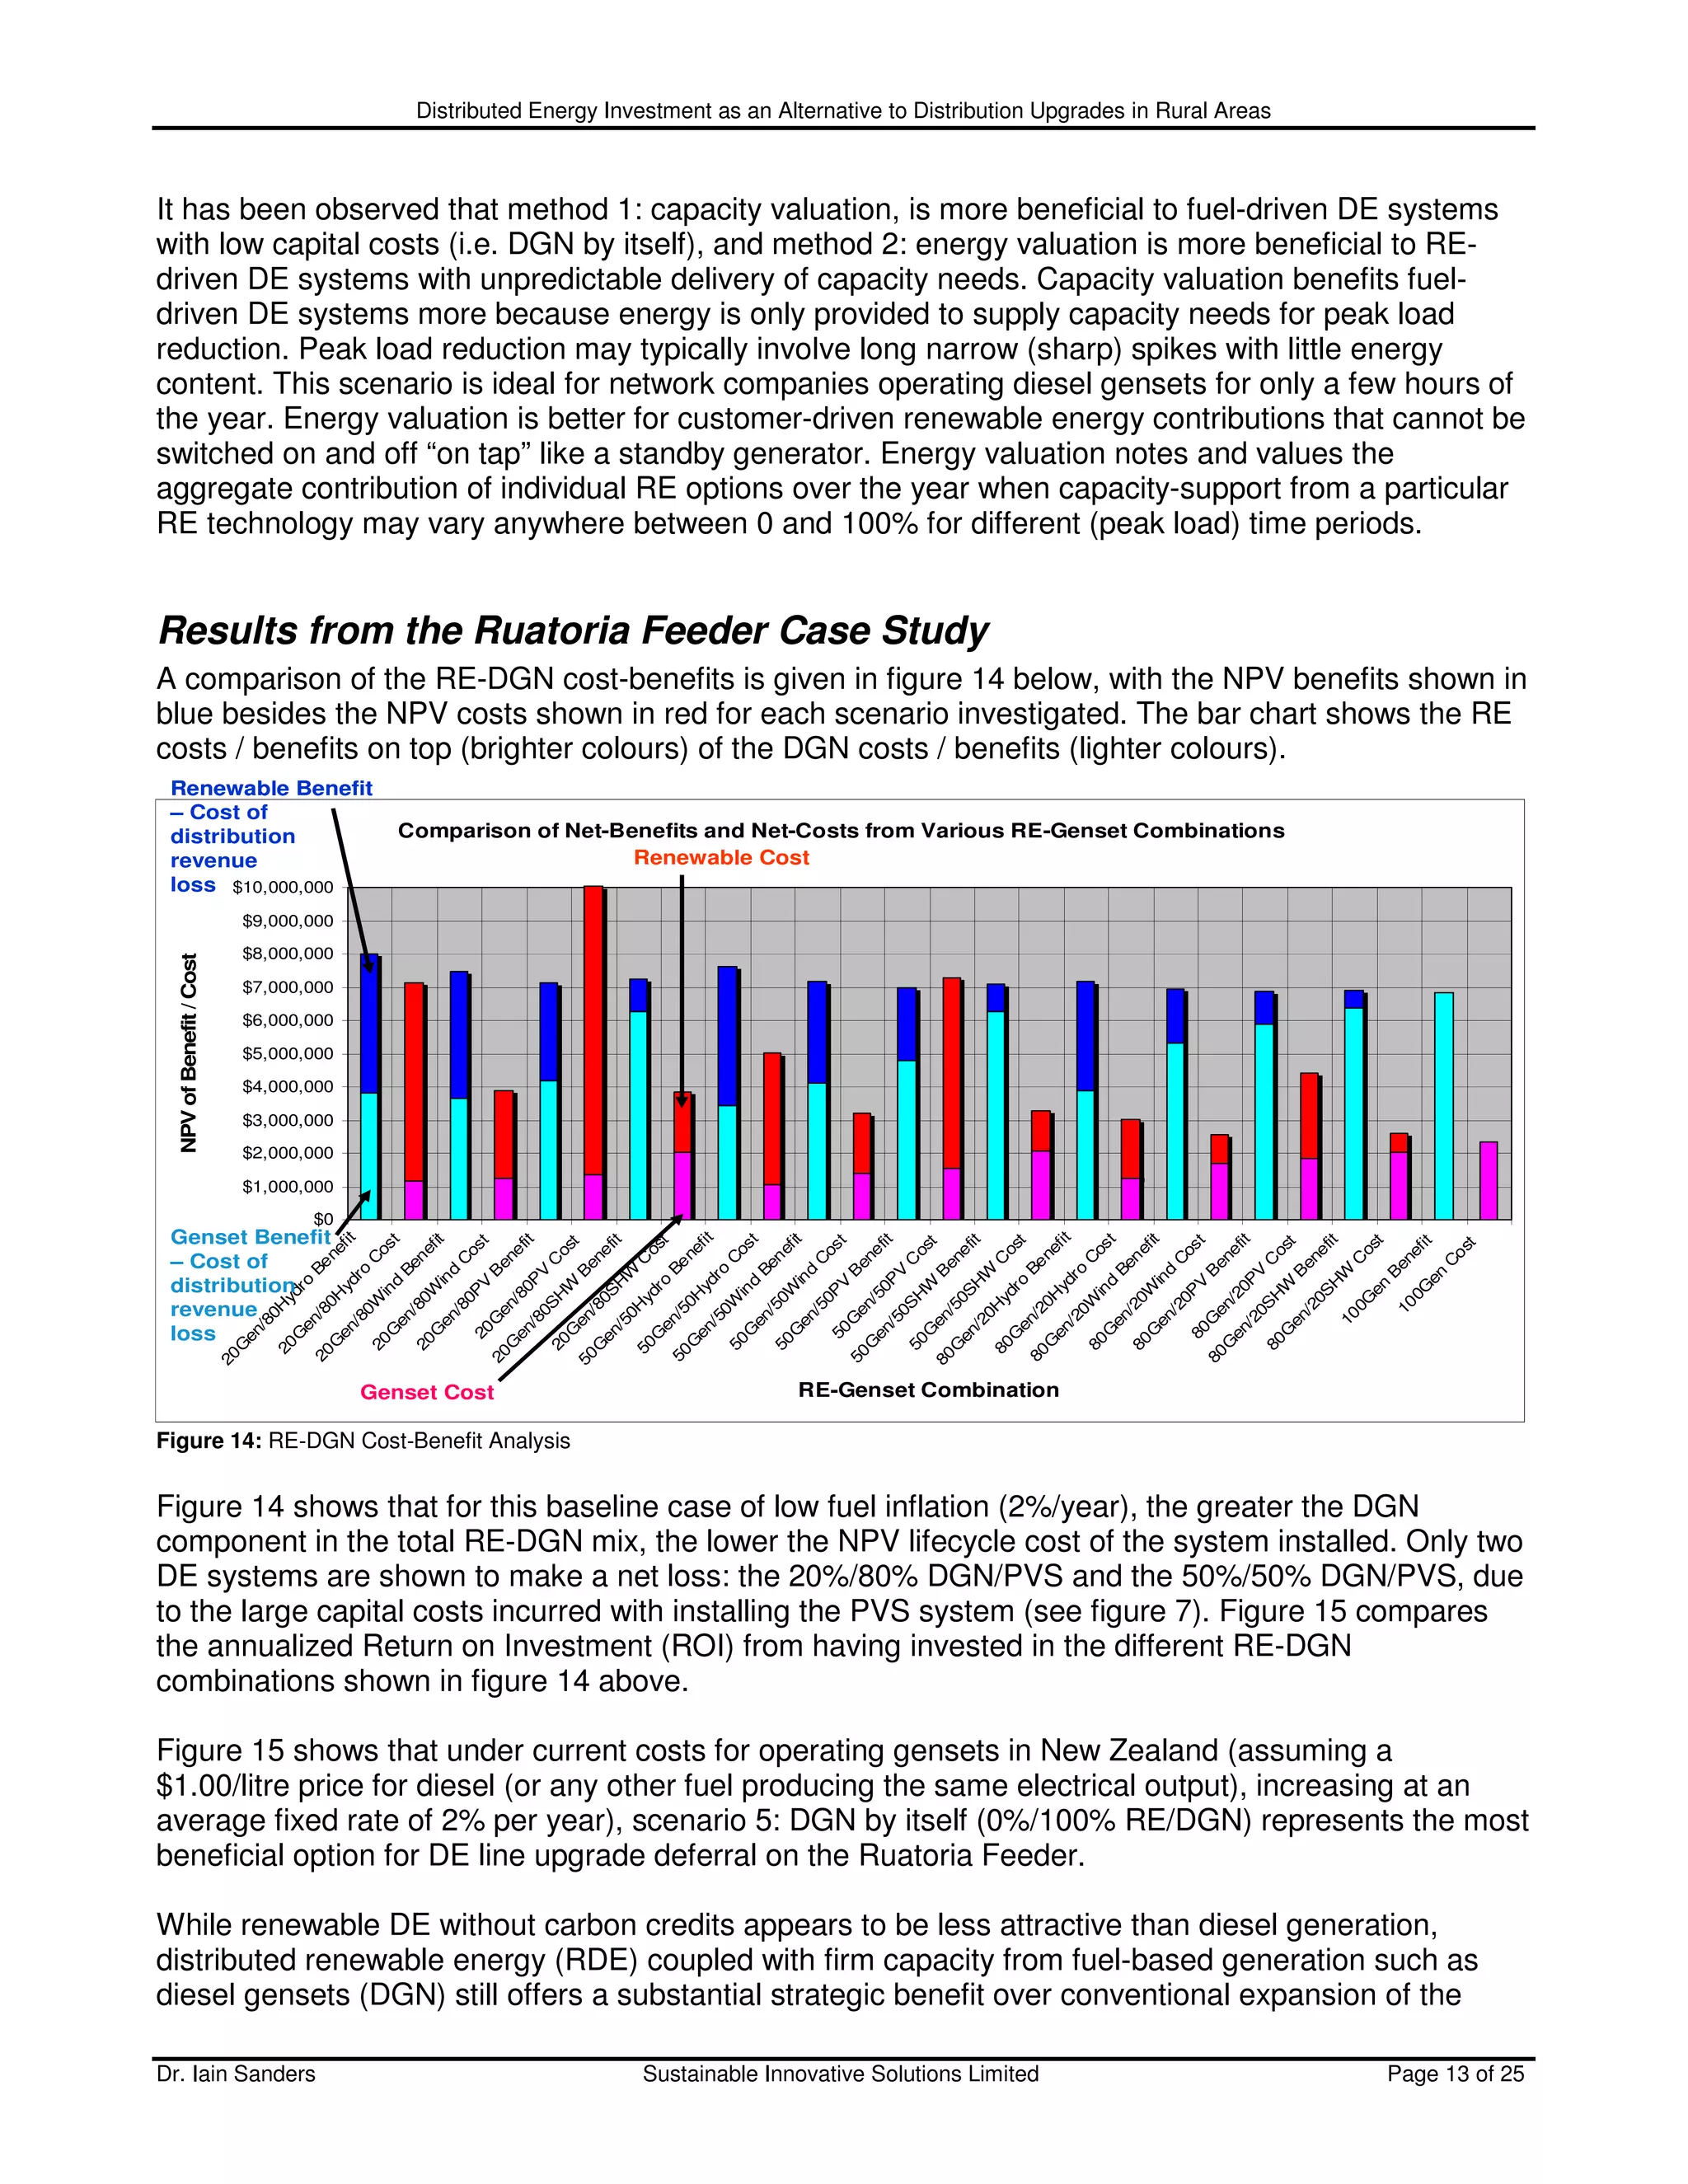
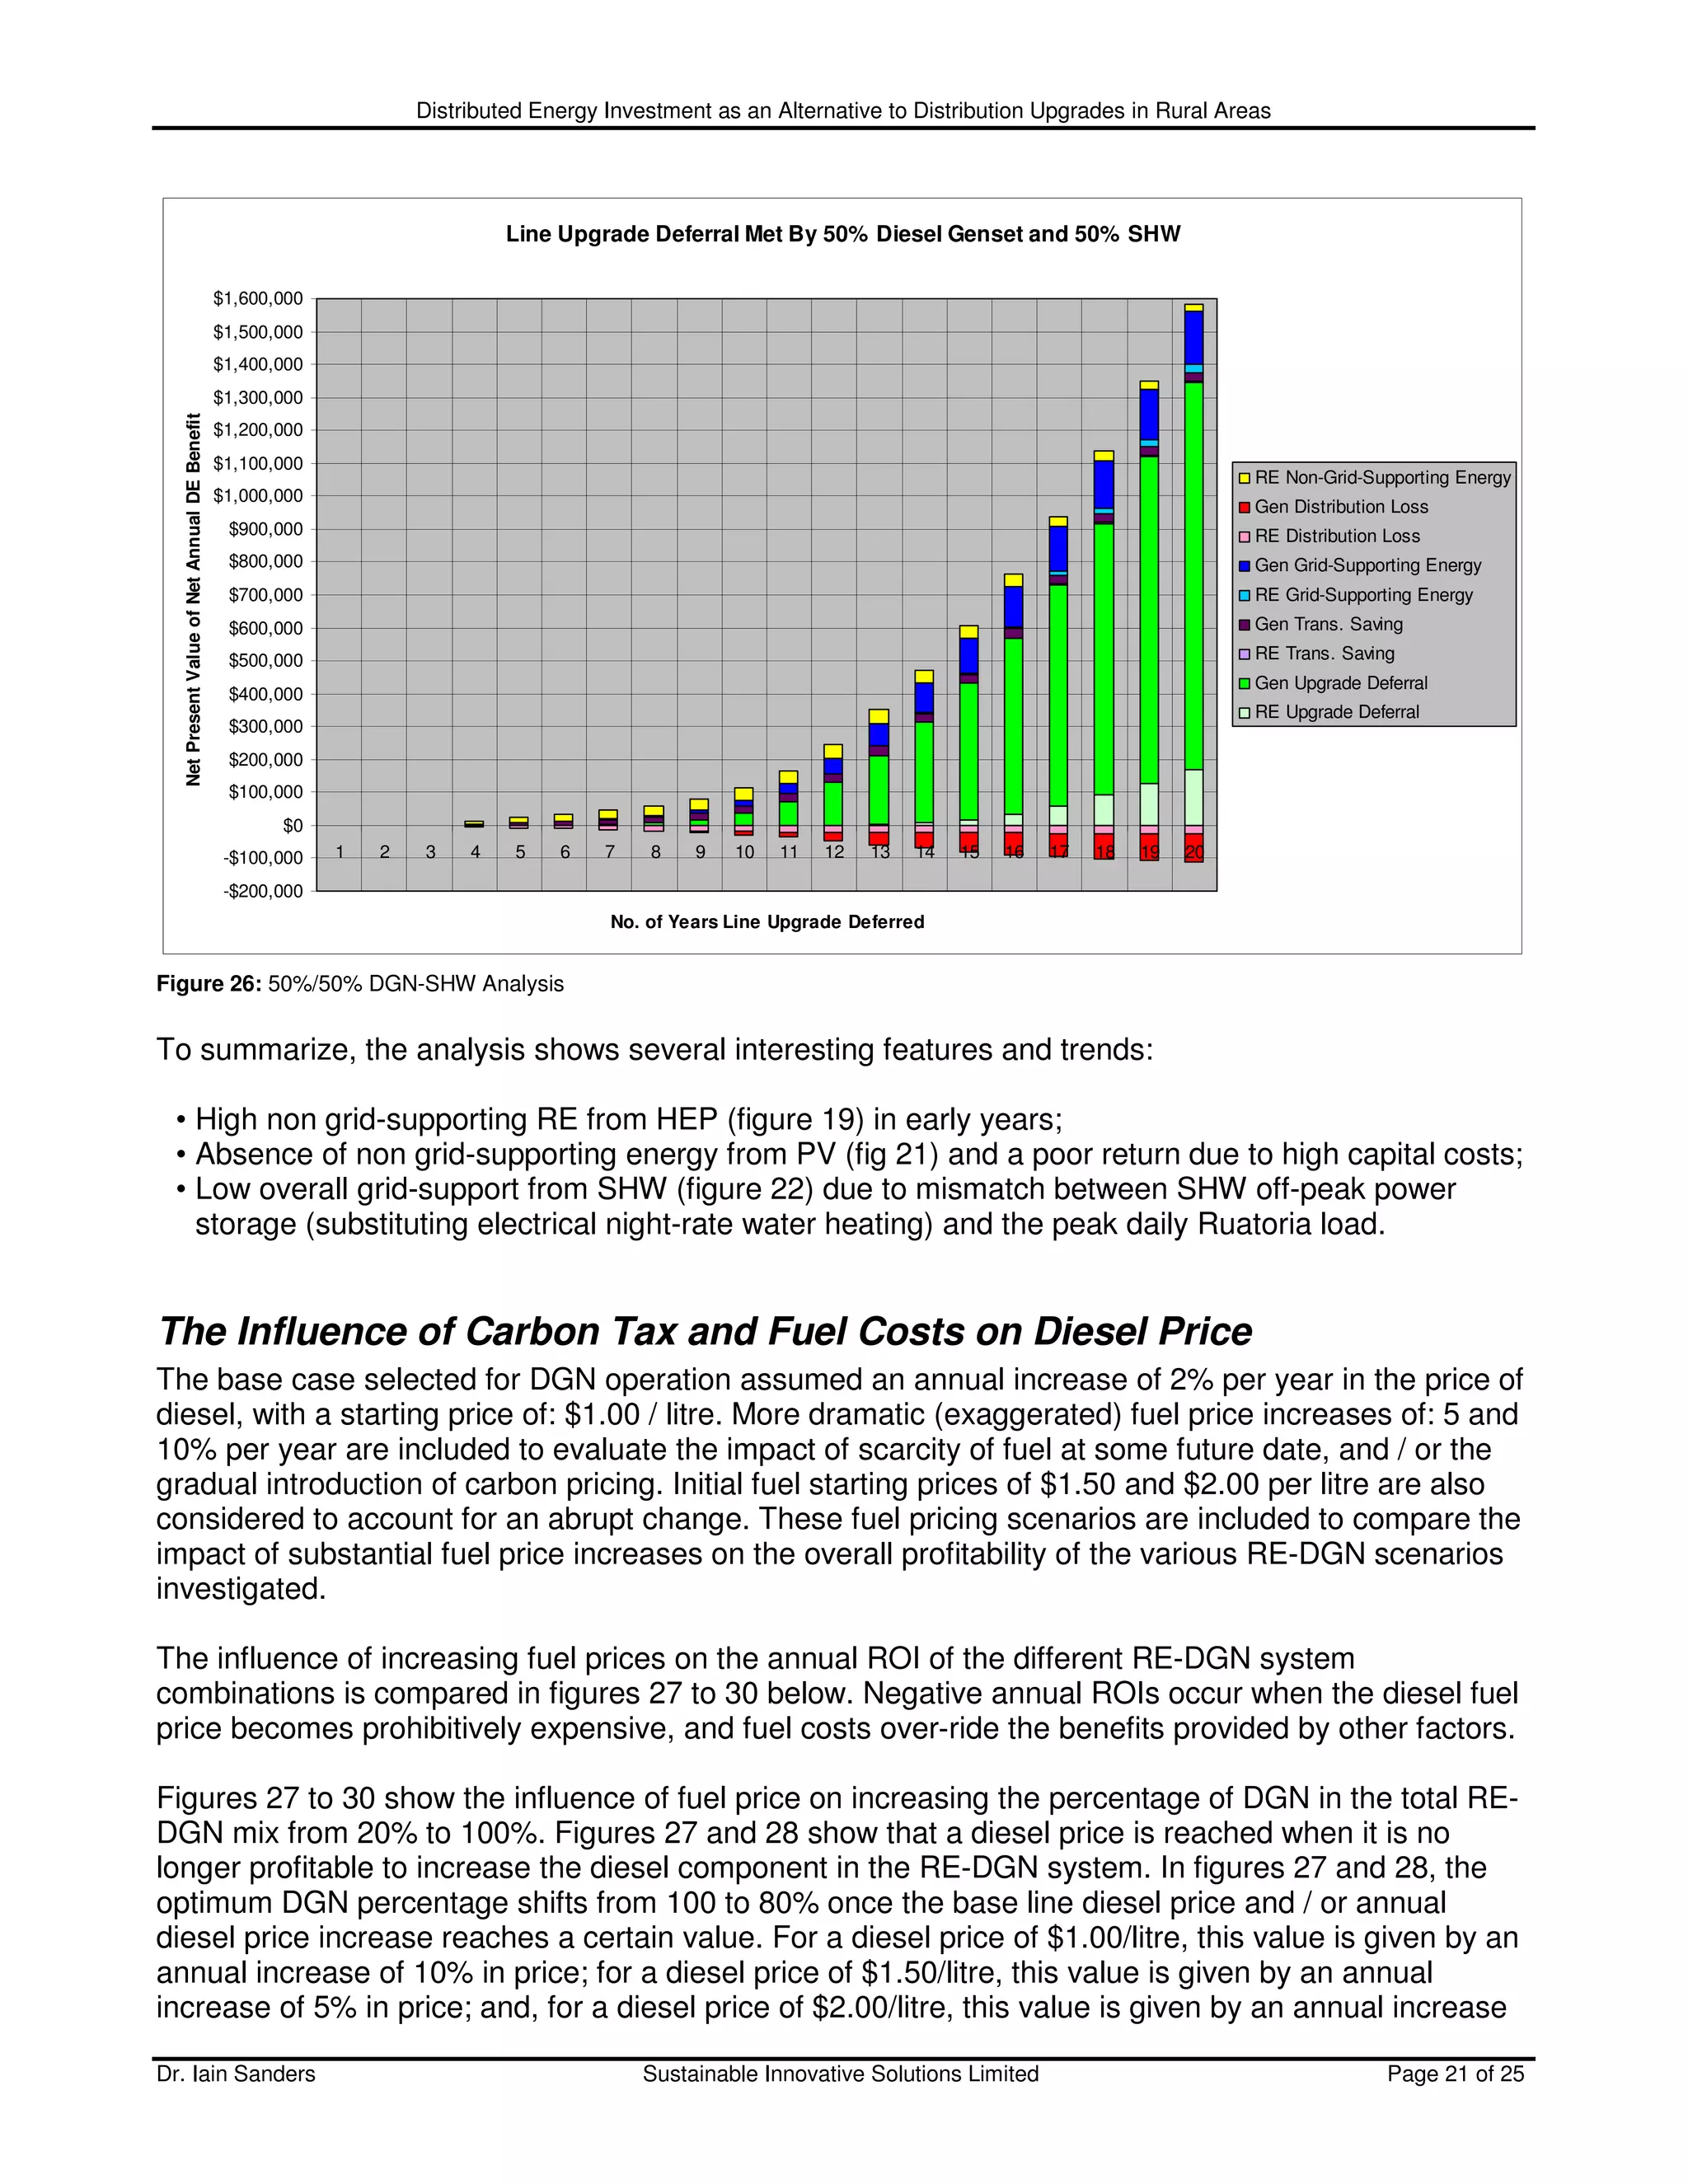
The PV scenarios show negative financial benefit for all ratios, as do the SHW scenarios. Only the
wind scenarios show a positive financial benefit for all levels of penetration. The negative SHW benefit
may appear odd. This analysis however, is only for the benefit of avoiding network upgrades. The
energy value to the owner is not included. Hence, because SHW is assumed to offset a controlled
load (electric hot water storage heating) this analysis illustrates a very important outcome: SHW
investment will not reduce the need for network investment in regions of demand growth.
Figure 17 contains the combined RE-DGN cost-benefits derived for the different ratios examined. The
DGN cost / benefit component makes up the balance of the RE results given in figure 16 and has the
effect of smoothing out the NPV change between different percentages of RE in the combined RE-
DGN system.
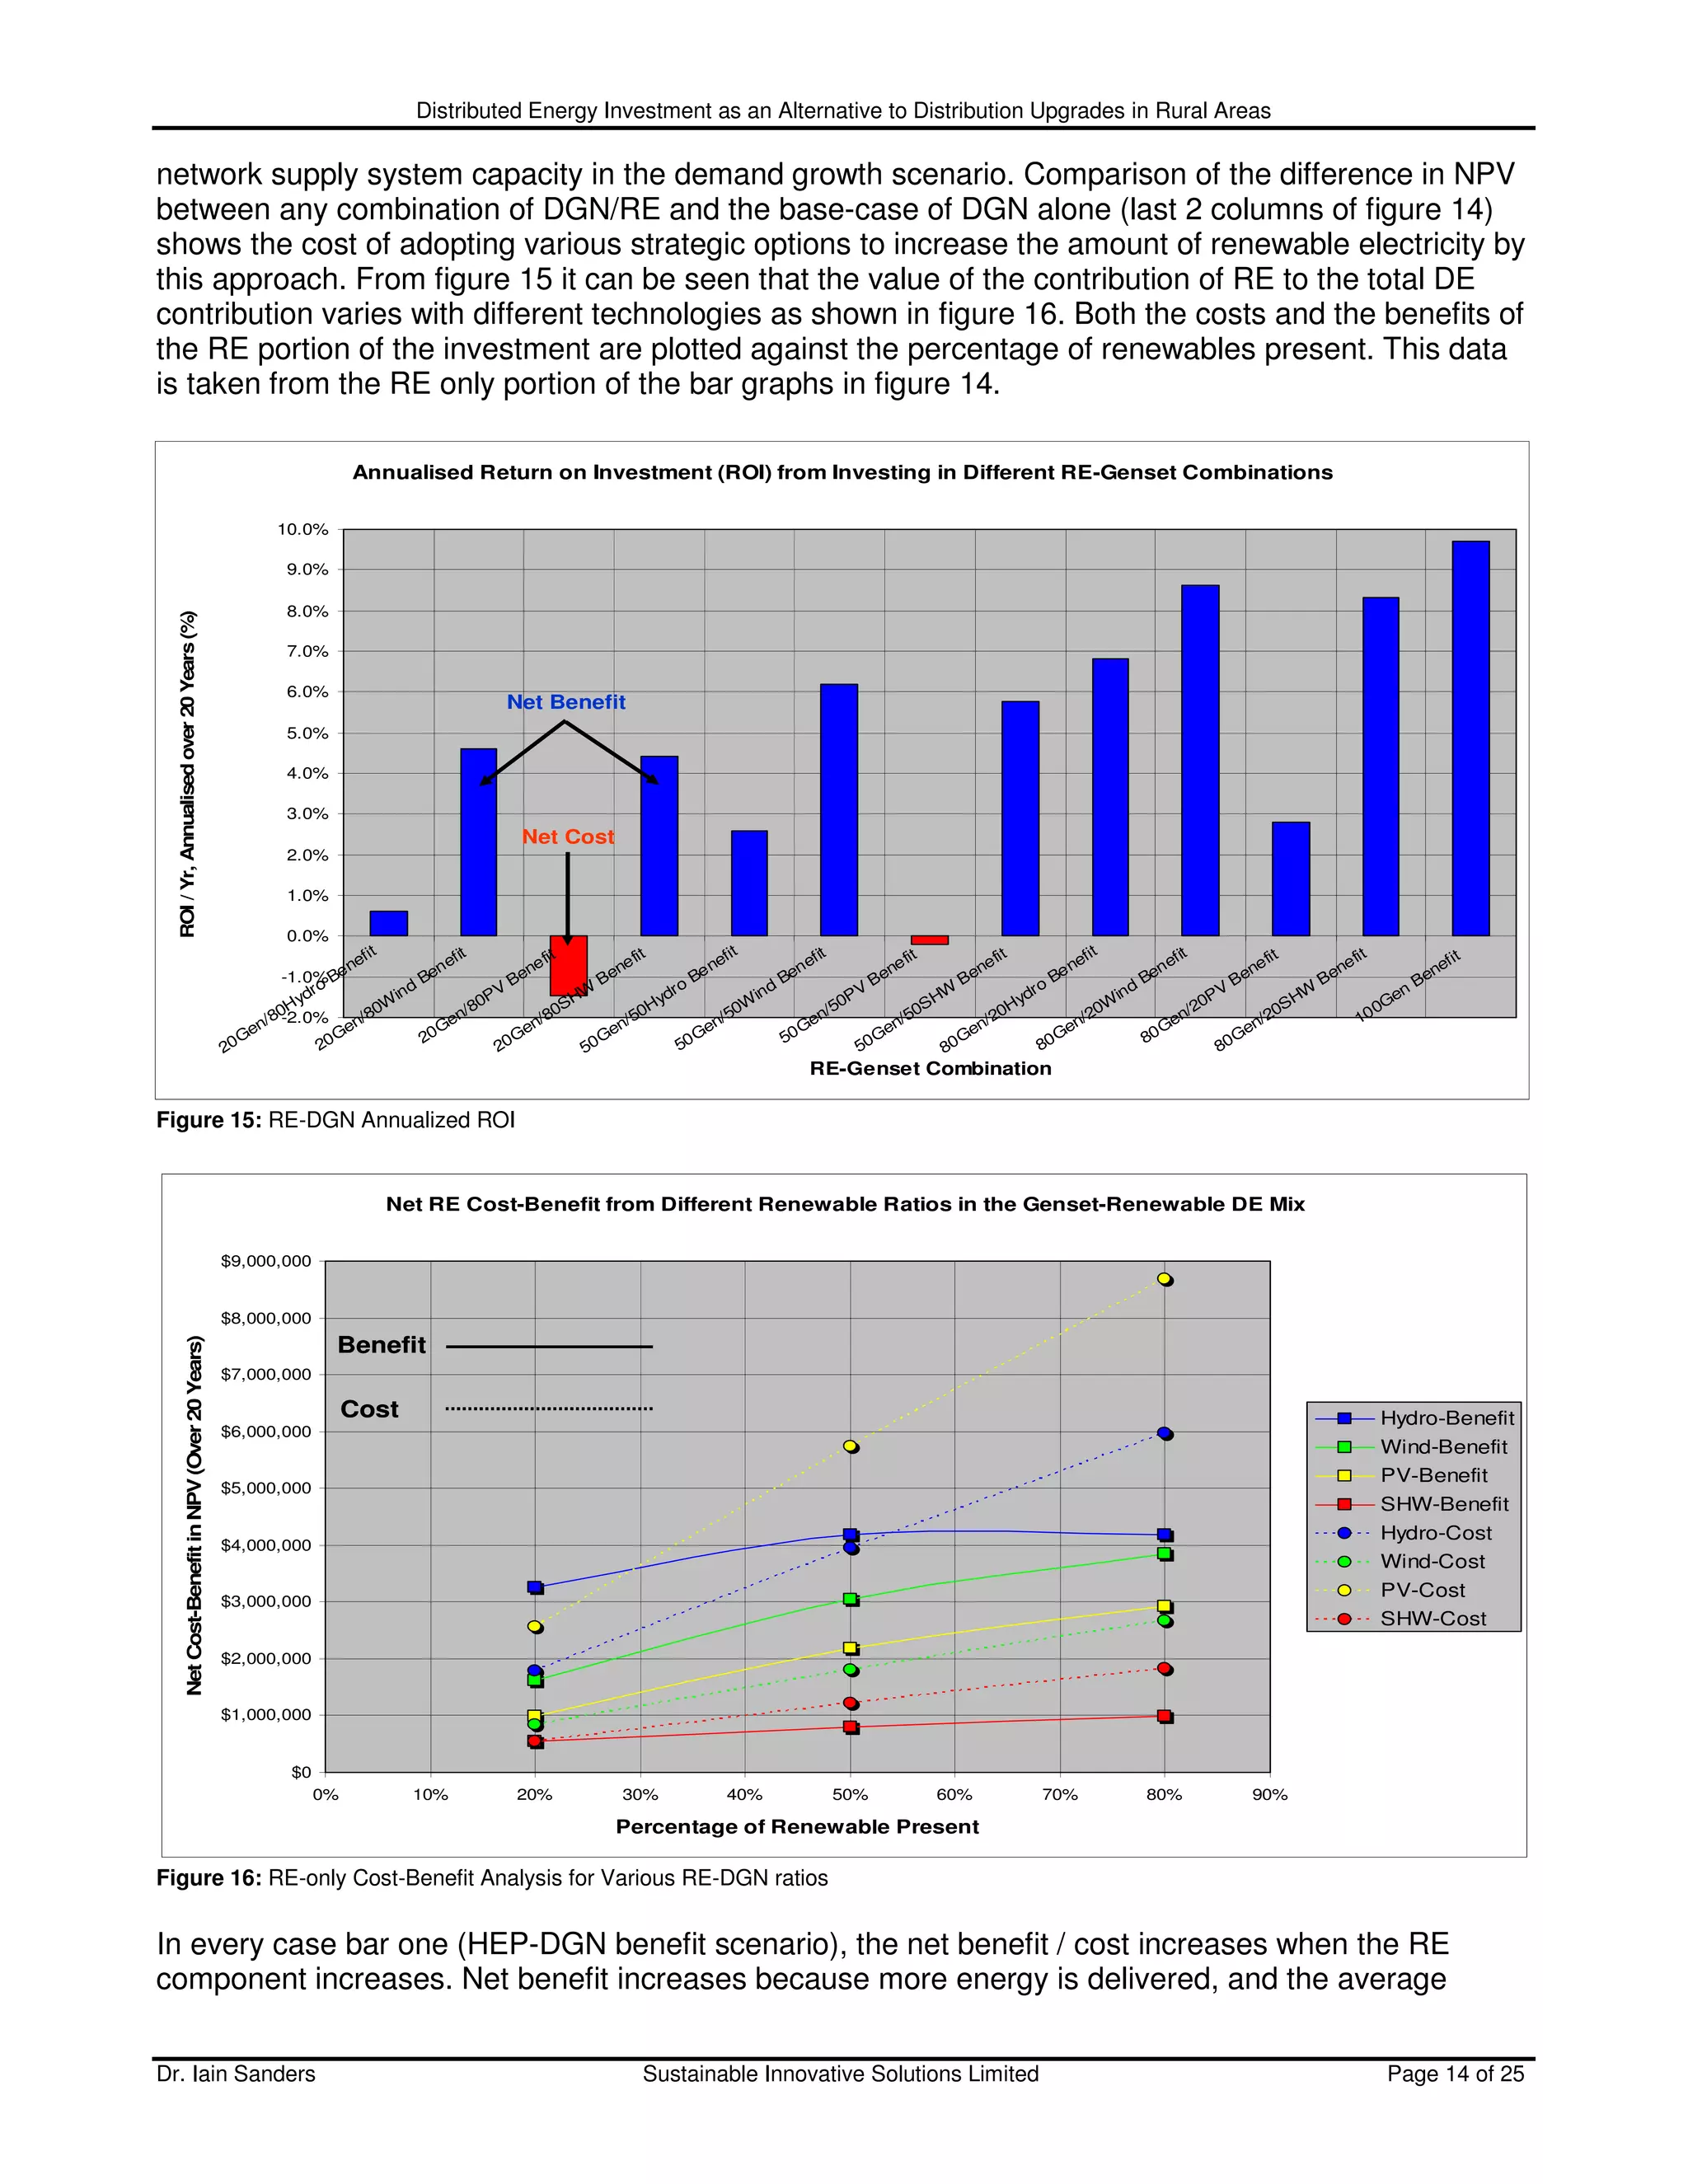
The NPV of energy delivered for line upgrade deferral (refer to figure 13 for comparison with the
capacity valuation method), transmission savings at the Grid Exit Point (GXP), wholesale energy sold
(providing grid-support) and loss of distribution earnings, were calculated and compared for each year,
using 100% DGN as the base case (scenario 5). Figure18 shows the NPV energy valuation time-
series for line upgrade deferral for scenario 5: 100%/0% DGN/RE with a 10% / year peak load growth
scenario.
The other DE systems with a RE component: scenarios 1-4, also include a NPV of surplus wholesale
Dr. Iain Sanders Sustainable Innovative Solutions Limited Page 15 of 25](https://image.slidesharecdn.com/rde4web-090802230158-phpapp01/75/Line-Upgrade-Deferral-Scenarios-for-Distributed-Renewable-Energy-Resources-15-2048.jpg)
![Distributed Energy Investment as an Alternative to Distribution Upgrades in Rural Areas
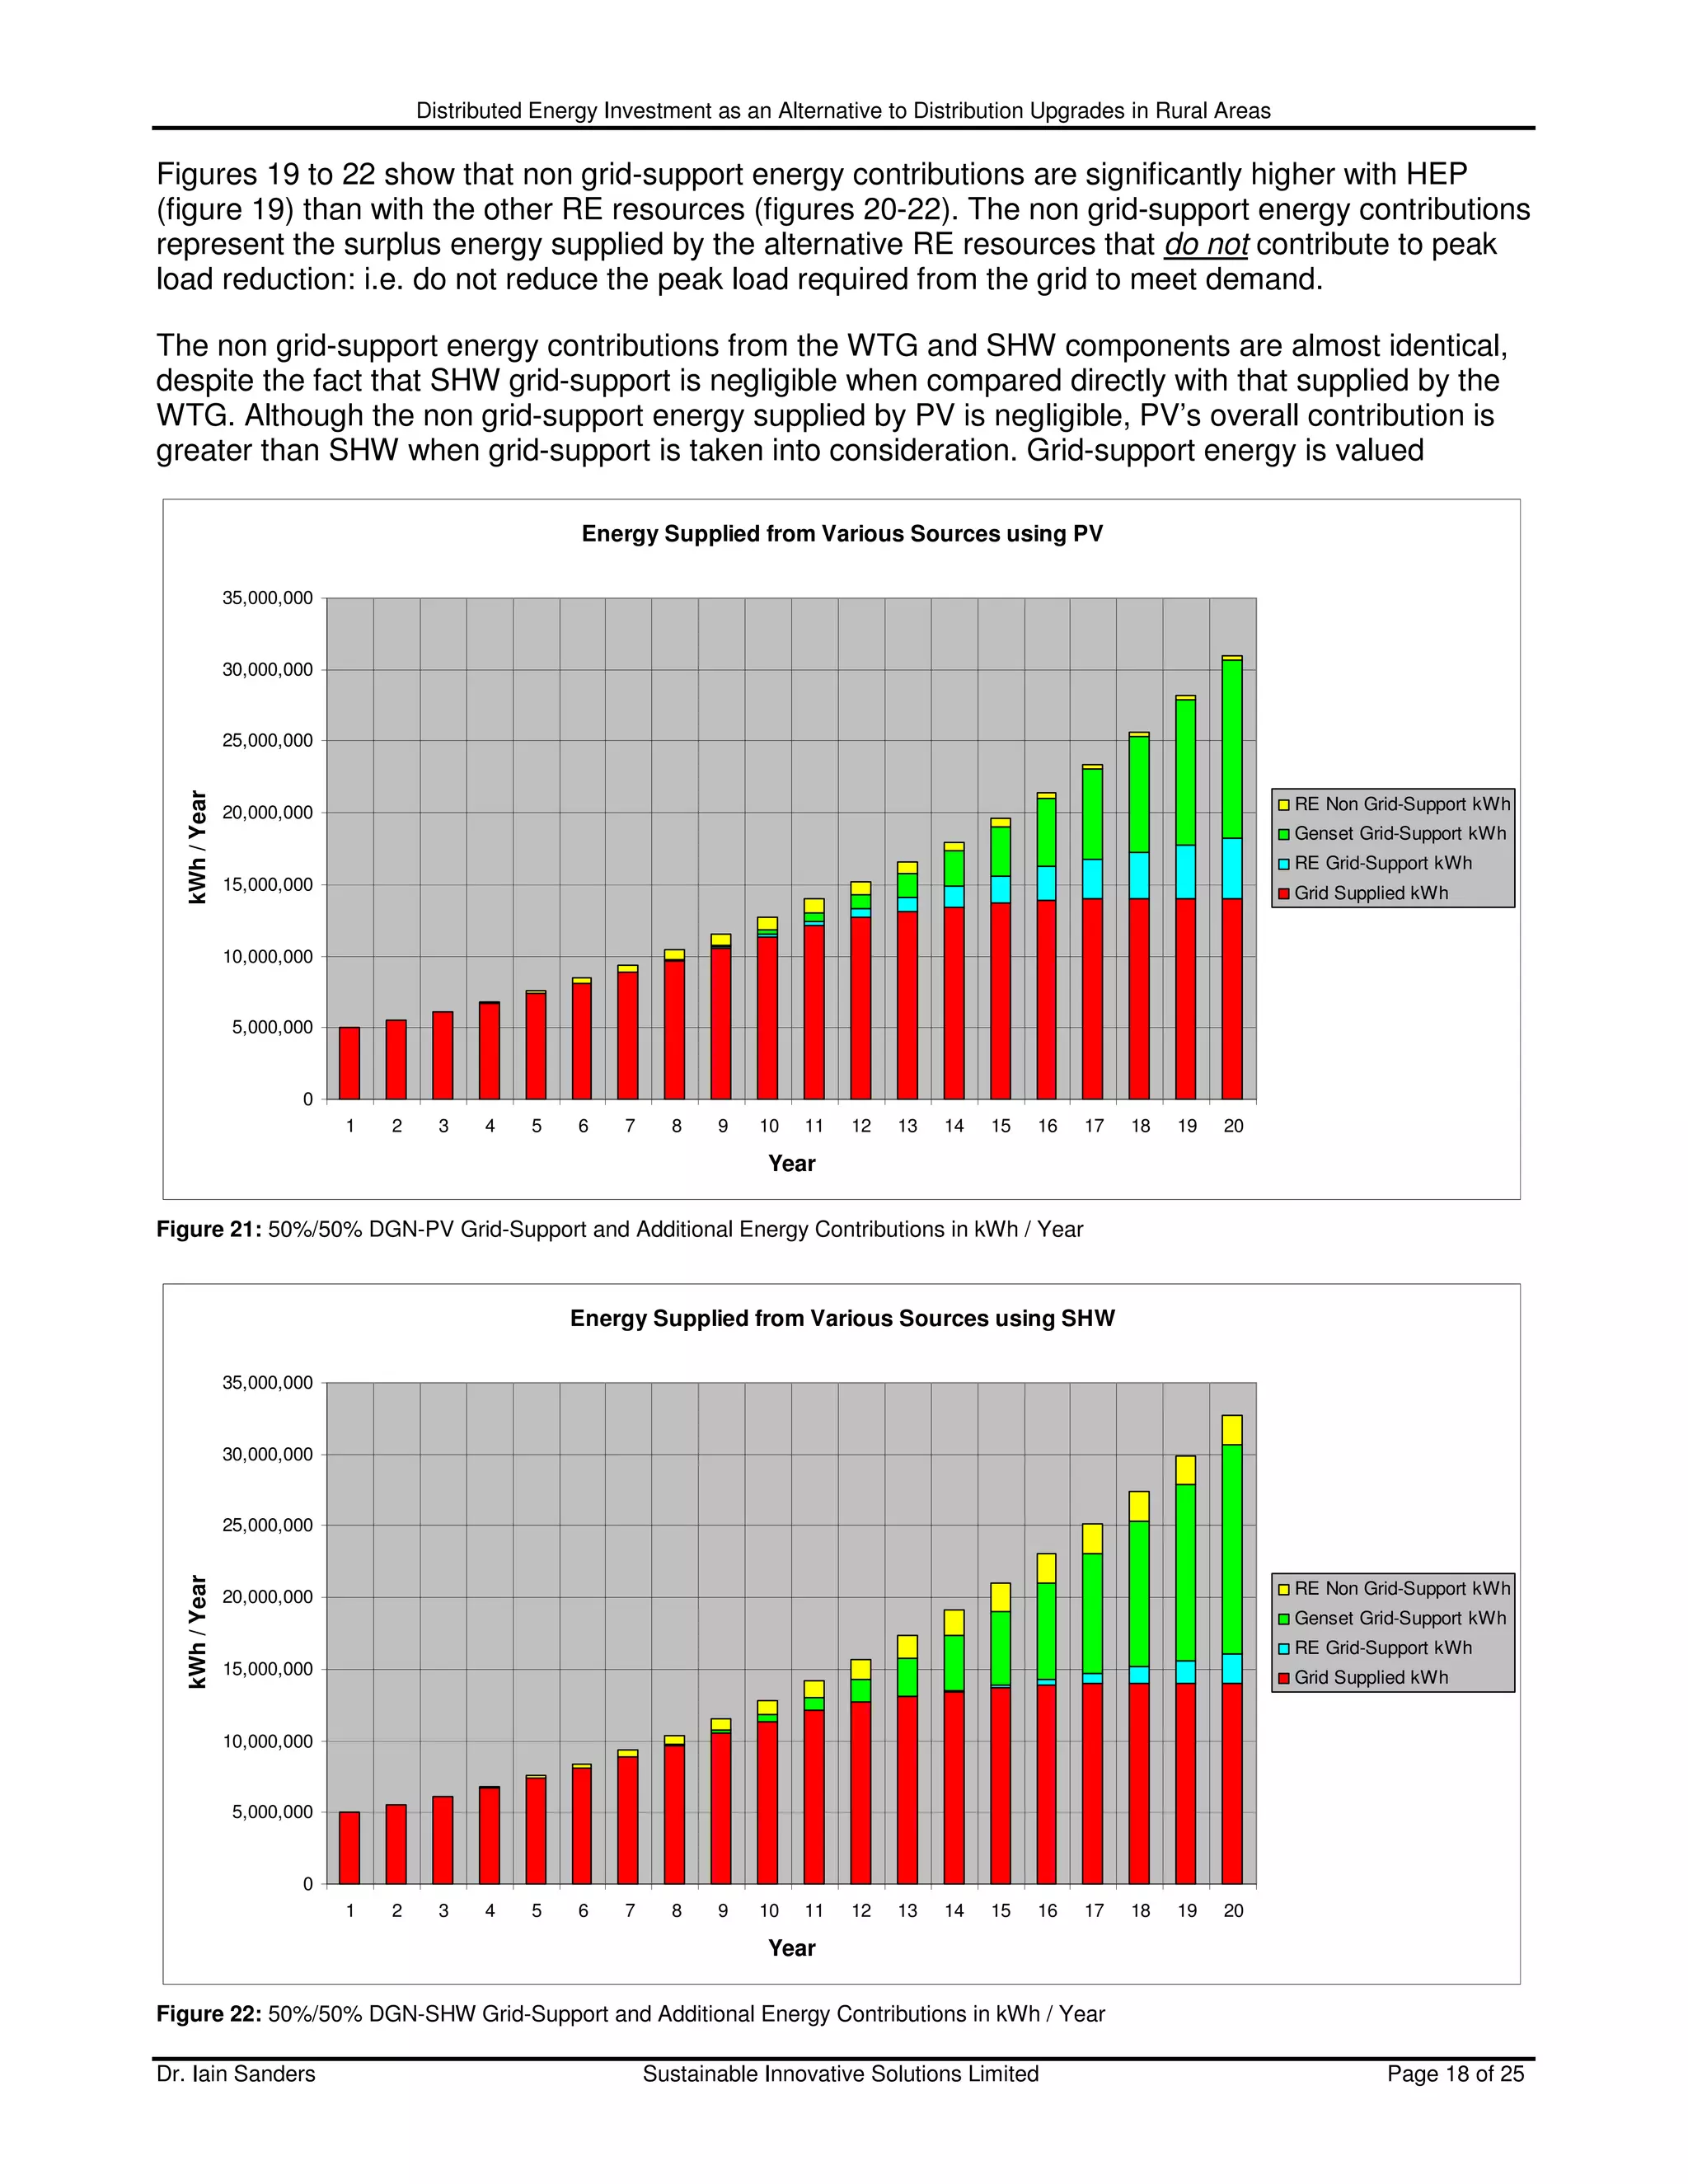
substantially higher than non grid-support energy, as illustrated by comparing the NPV of energy
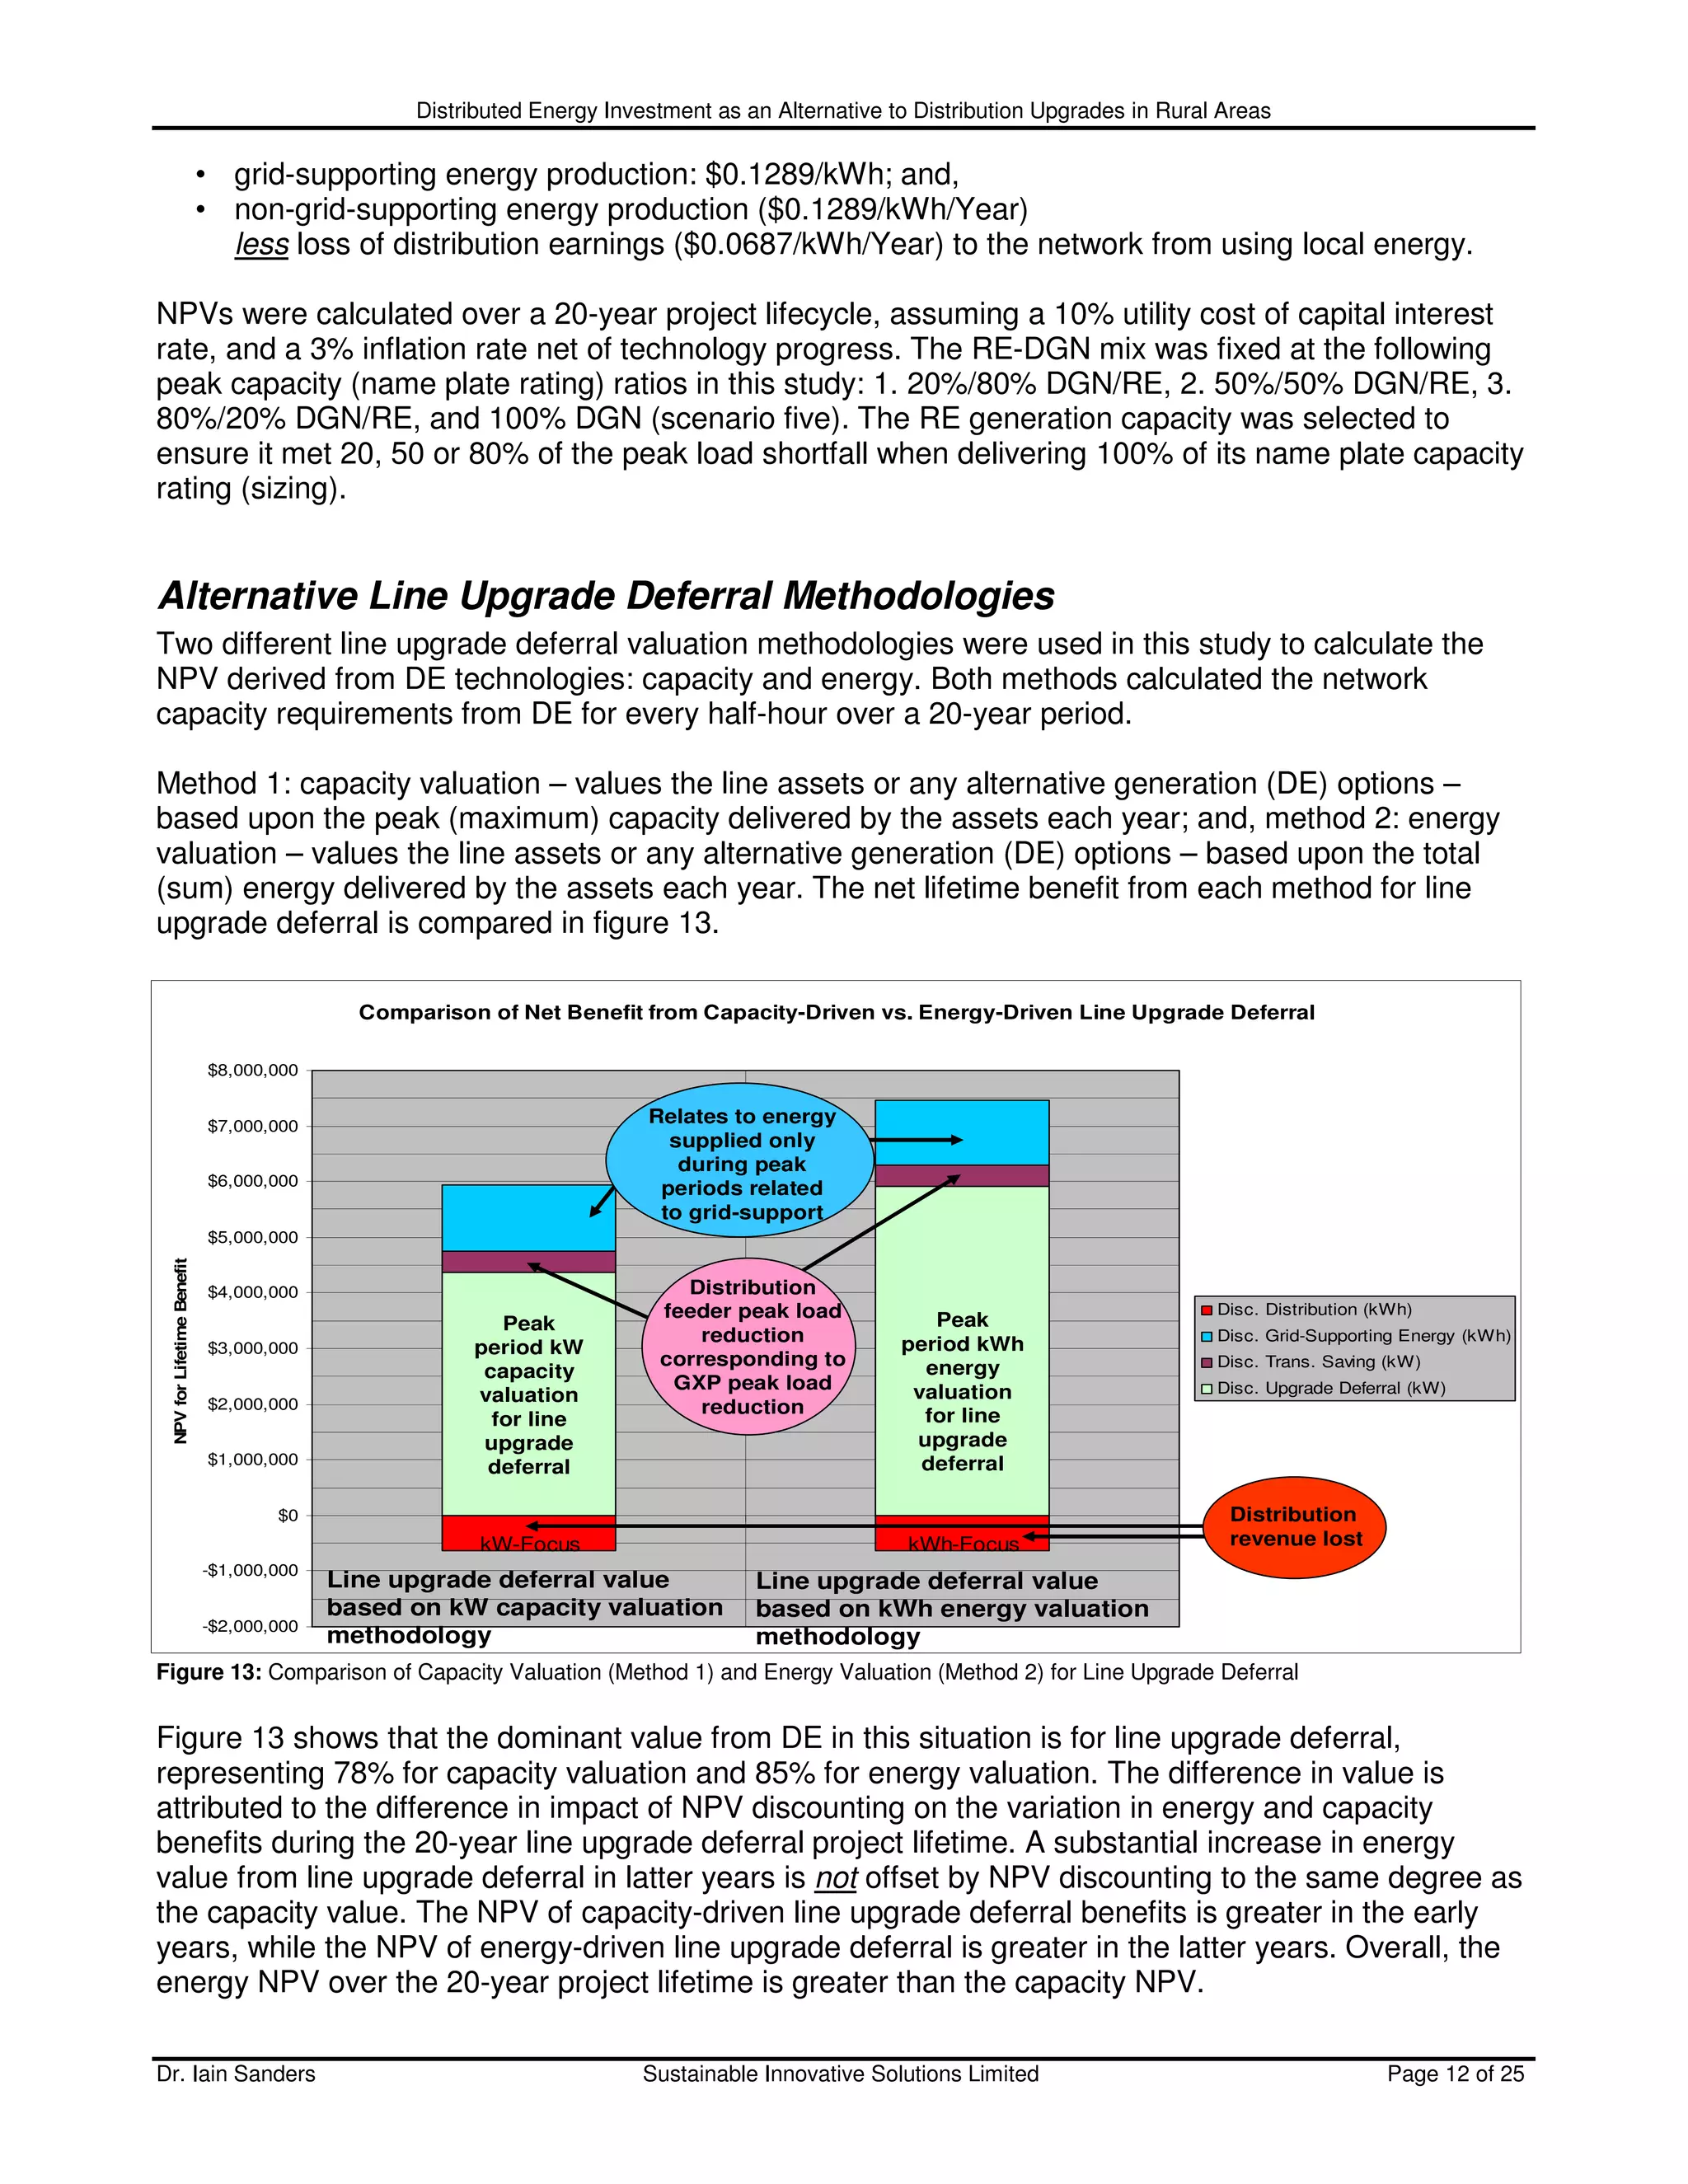
supplied by PV (figure 25) and SHW (figure 26).
Despite the fact that grid-support and non grid-support energy contributions from PV are less than
those from WTG, there is still a significant contribution from PV, due to the close match between the
solar energy profile supplied and the peak load of the Ruatoria feeder needing to be reduced. The
SHW scenario does not support peak load reduction on the Ruatoria feeder, because solar energy is
stored as hot water to substitute electrical heating of water cylinder at night. There is a poor correlation
between the profile for night-rate water heating and the Ruatoria peak load reduction required in the
middle of the day. SHW replaces night-rate water heating and does not offset the daily peak load.
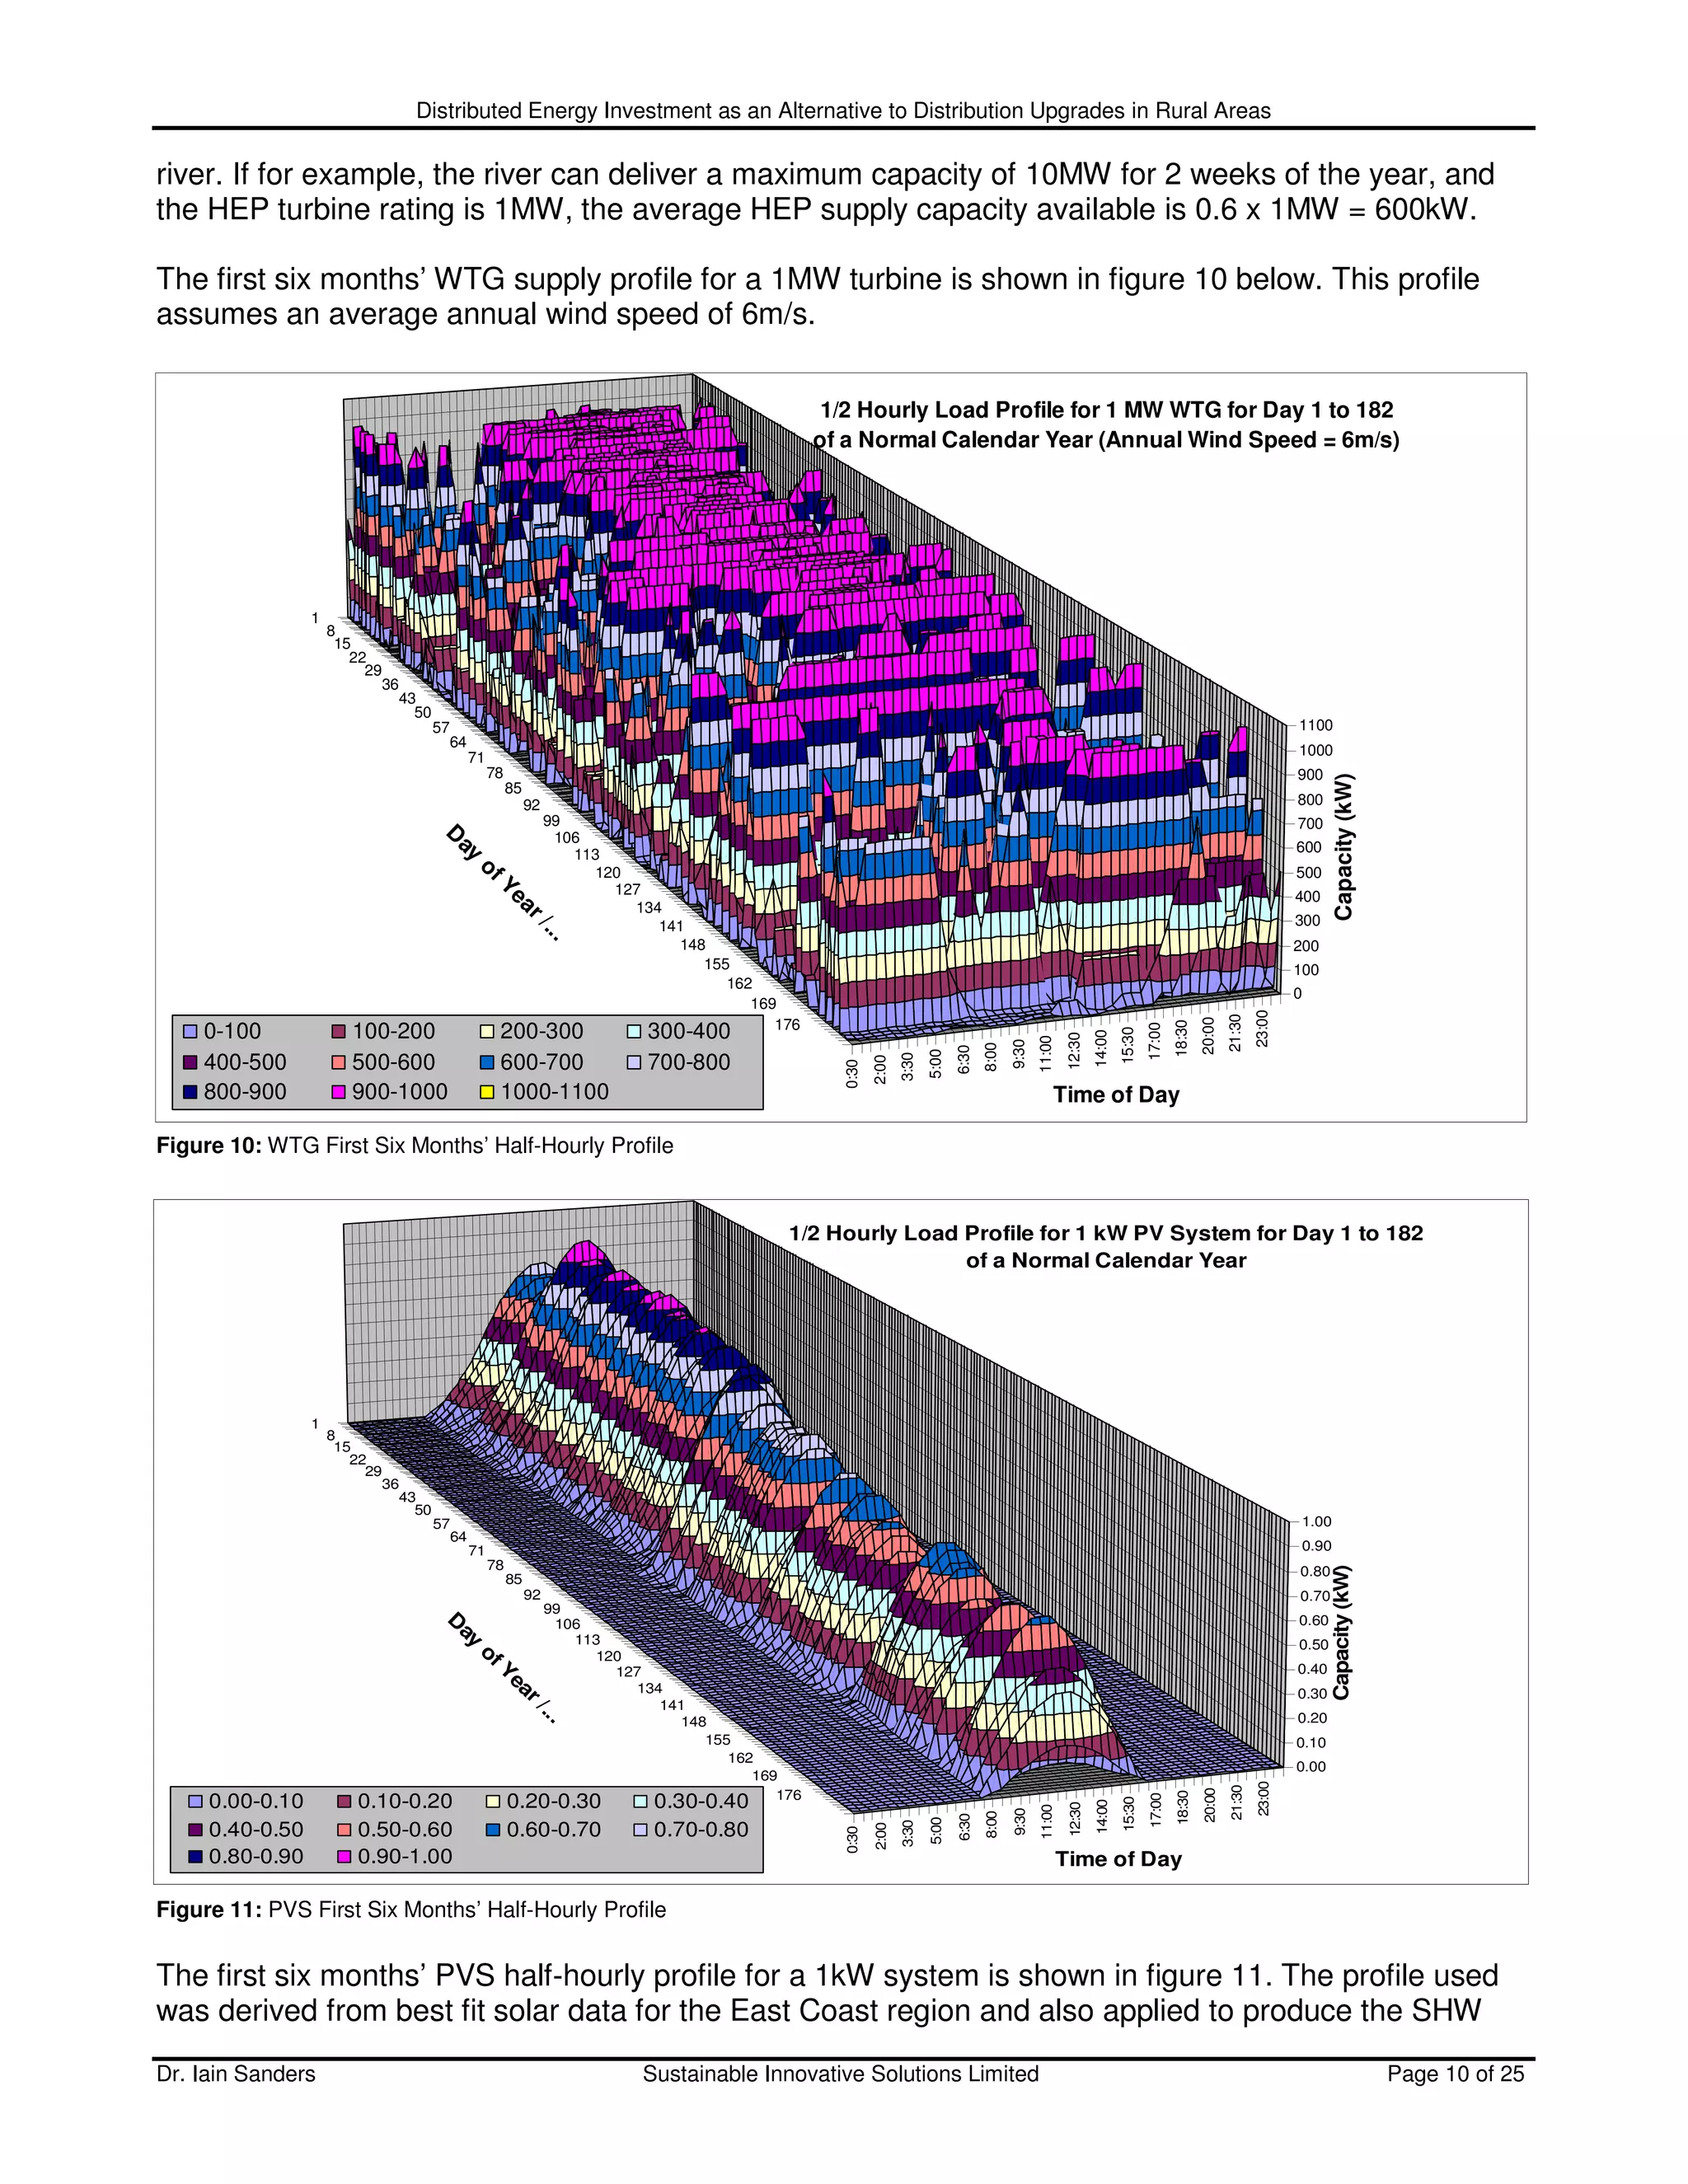
Valuation of the 50%/50% DGN/RE Ratio Mix
A summary of the results obtained for the 50%/50% DGN/RE Ratio are shown in figures 23 to 26.
Line Upgrade Deferral Met By 50% Diesel Genset and 50% HEP
$1,600,000
$1,500,000
$1,400,000
$1,300,000
Net Present Value of Net Annual DE Benefit
$1,200,000
$1,100,000
RE Non-Grid-Supporting Energy
$1,000,000
Gen Distribution Loss
$900,000 RE Distribution Loss
$800,000 Gen Grid-Supporting Energy
$700,000 RE Grid-Supporting Energy
$600,000 Gen Trans. Saving
$500,000 RE Trans. Saving
Gen Upgrade Deferral
$400,000
RE Upgrade Deferral
$300,000
$200,000
$100,000
$0
-$100,000 1 2 3 4 5 6 7 8 9 10 11 12 13 14 15 16 17 18 19 20
-$200,000
No. of Years Line Upgrade Deferred
Figure 23: 50%/50% DGN-HEP Analysis
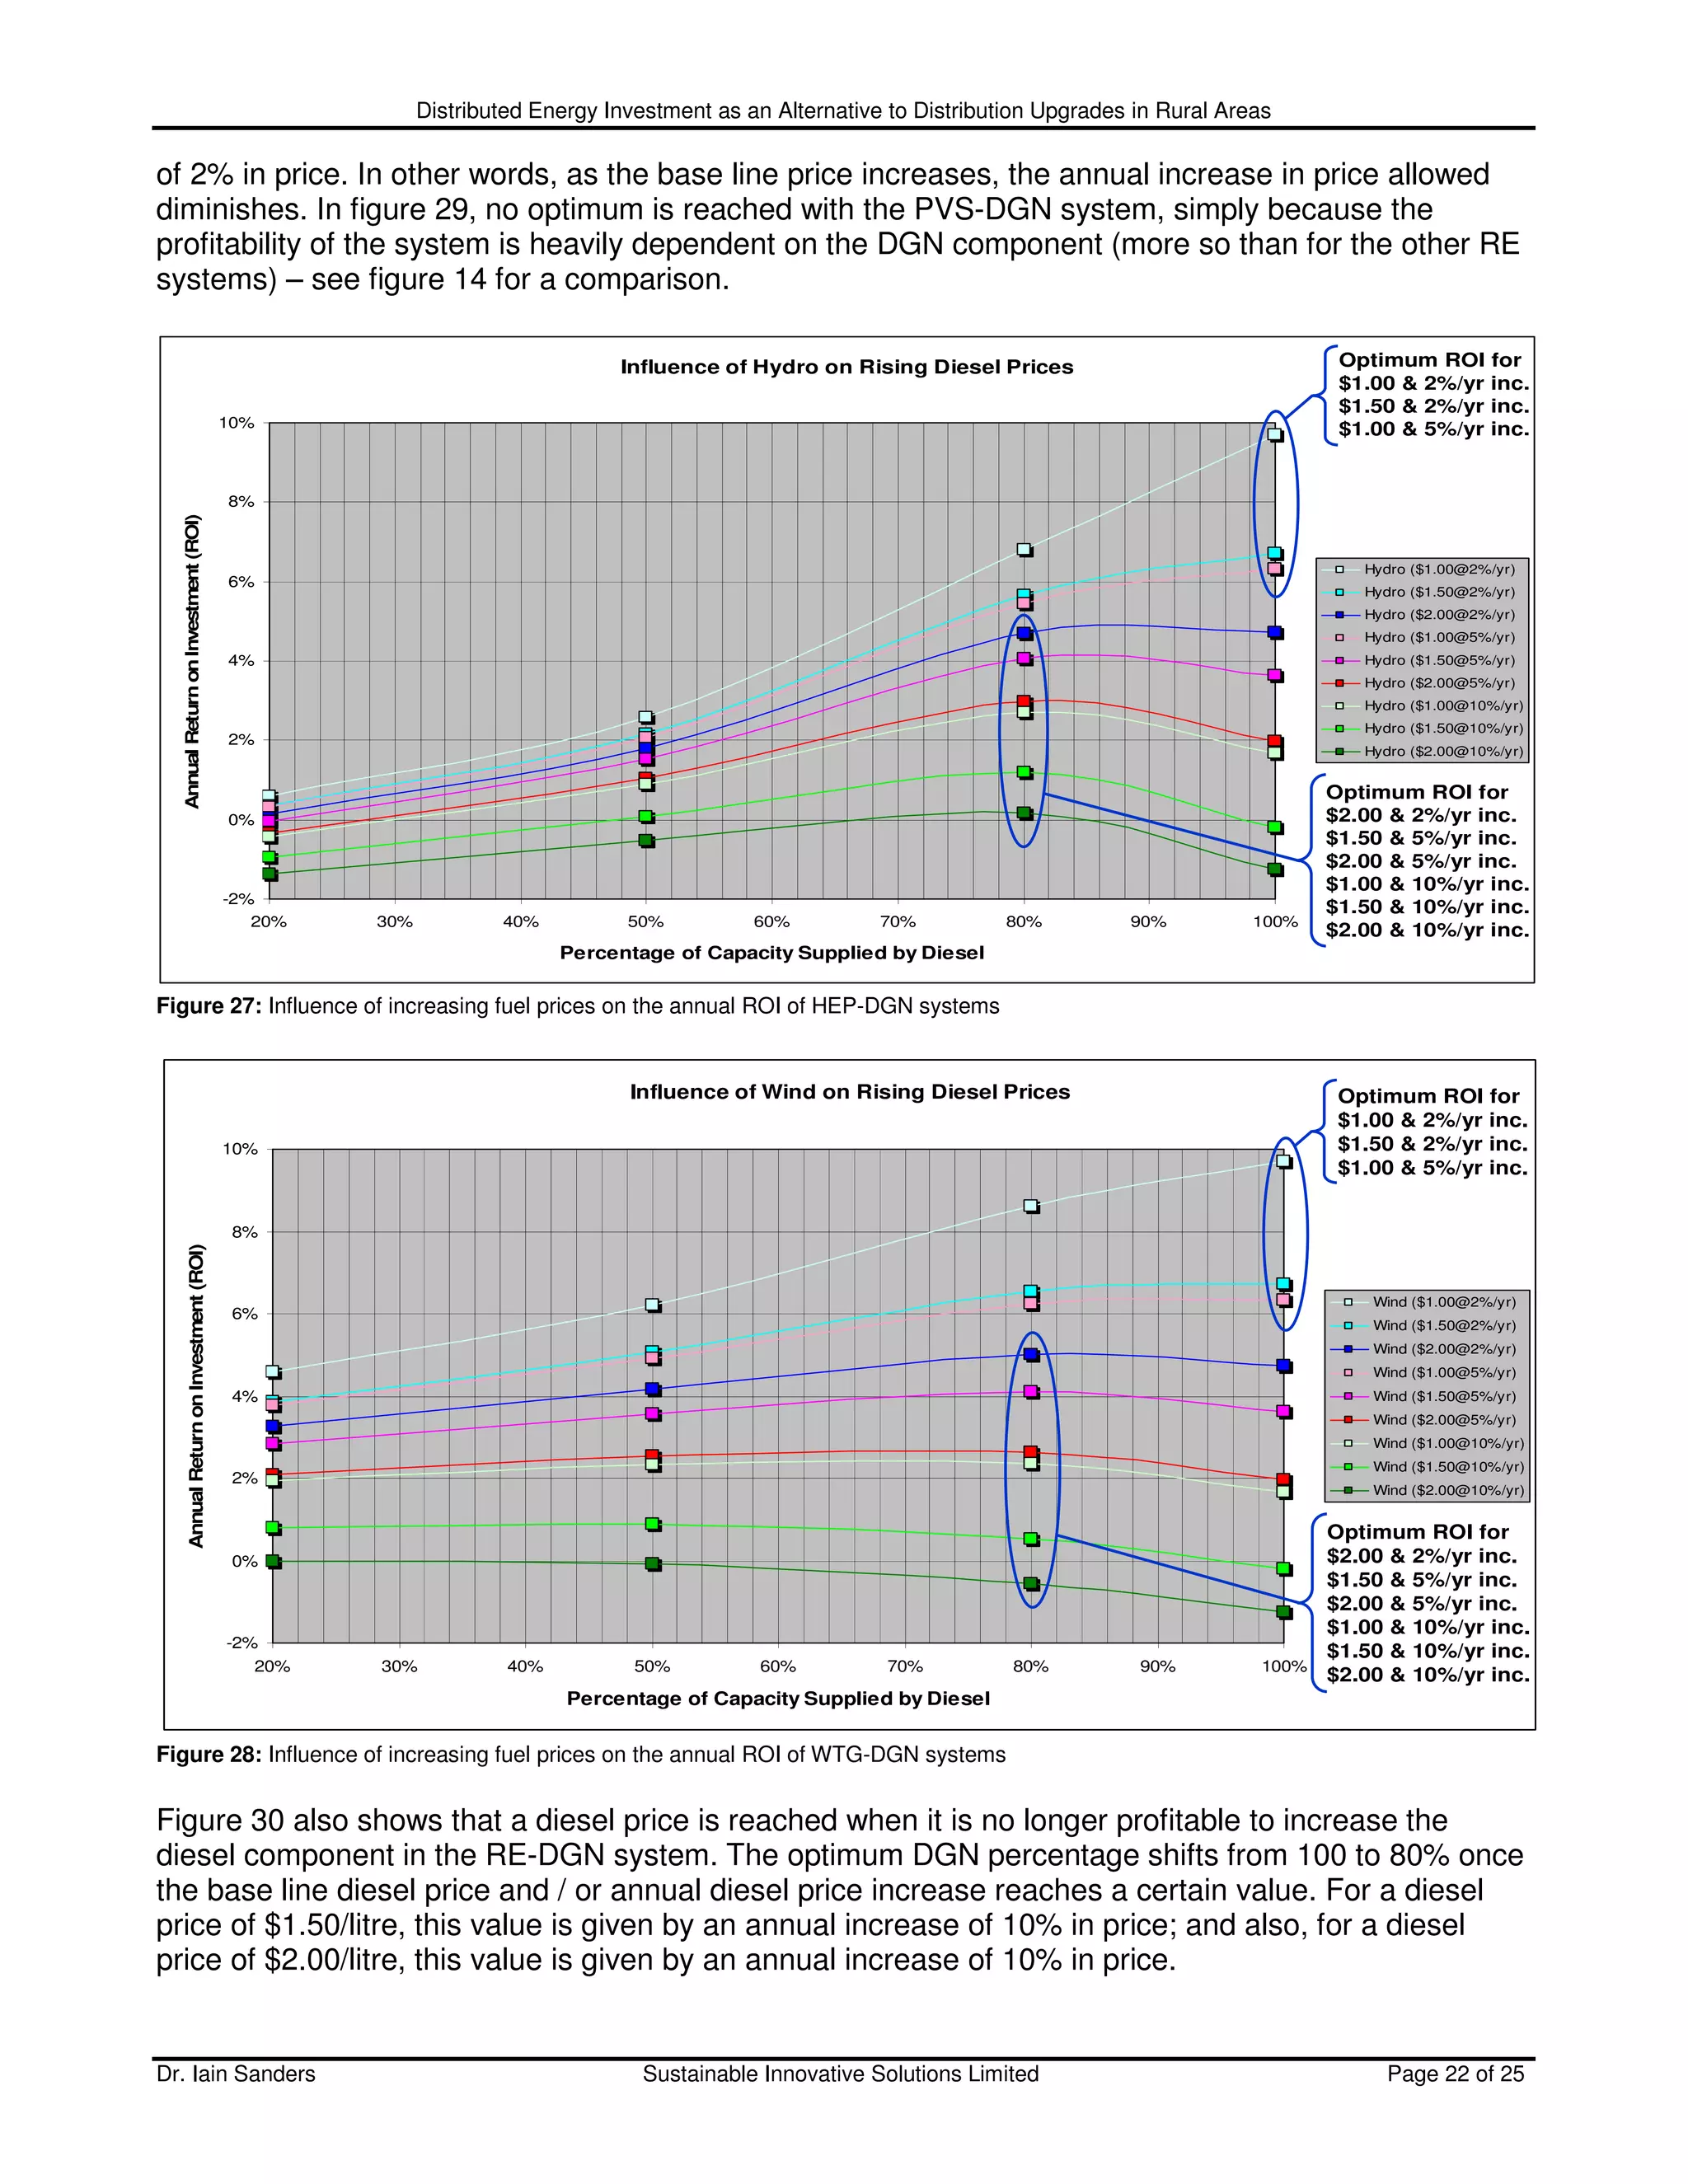
In each scenario, the NPV of the net annual DE benefit remains constant, because the capacity and
energy requirement that has to be met by DE for line upgrade deferral to take place has been defined
as the same for all scenarios. However, as can been seen from figures 23 to 26, the contribution to the
net benefit varies, based upon the year and the RE-DGN mix selected. The only exception to this rule,
is provided by the non grid-supporting RE contributions, as these are surplus to requirement for line
upgrade deferral, and do not cost anymore to produce – unlike diesel fuel which is only used to meet
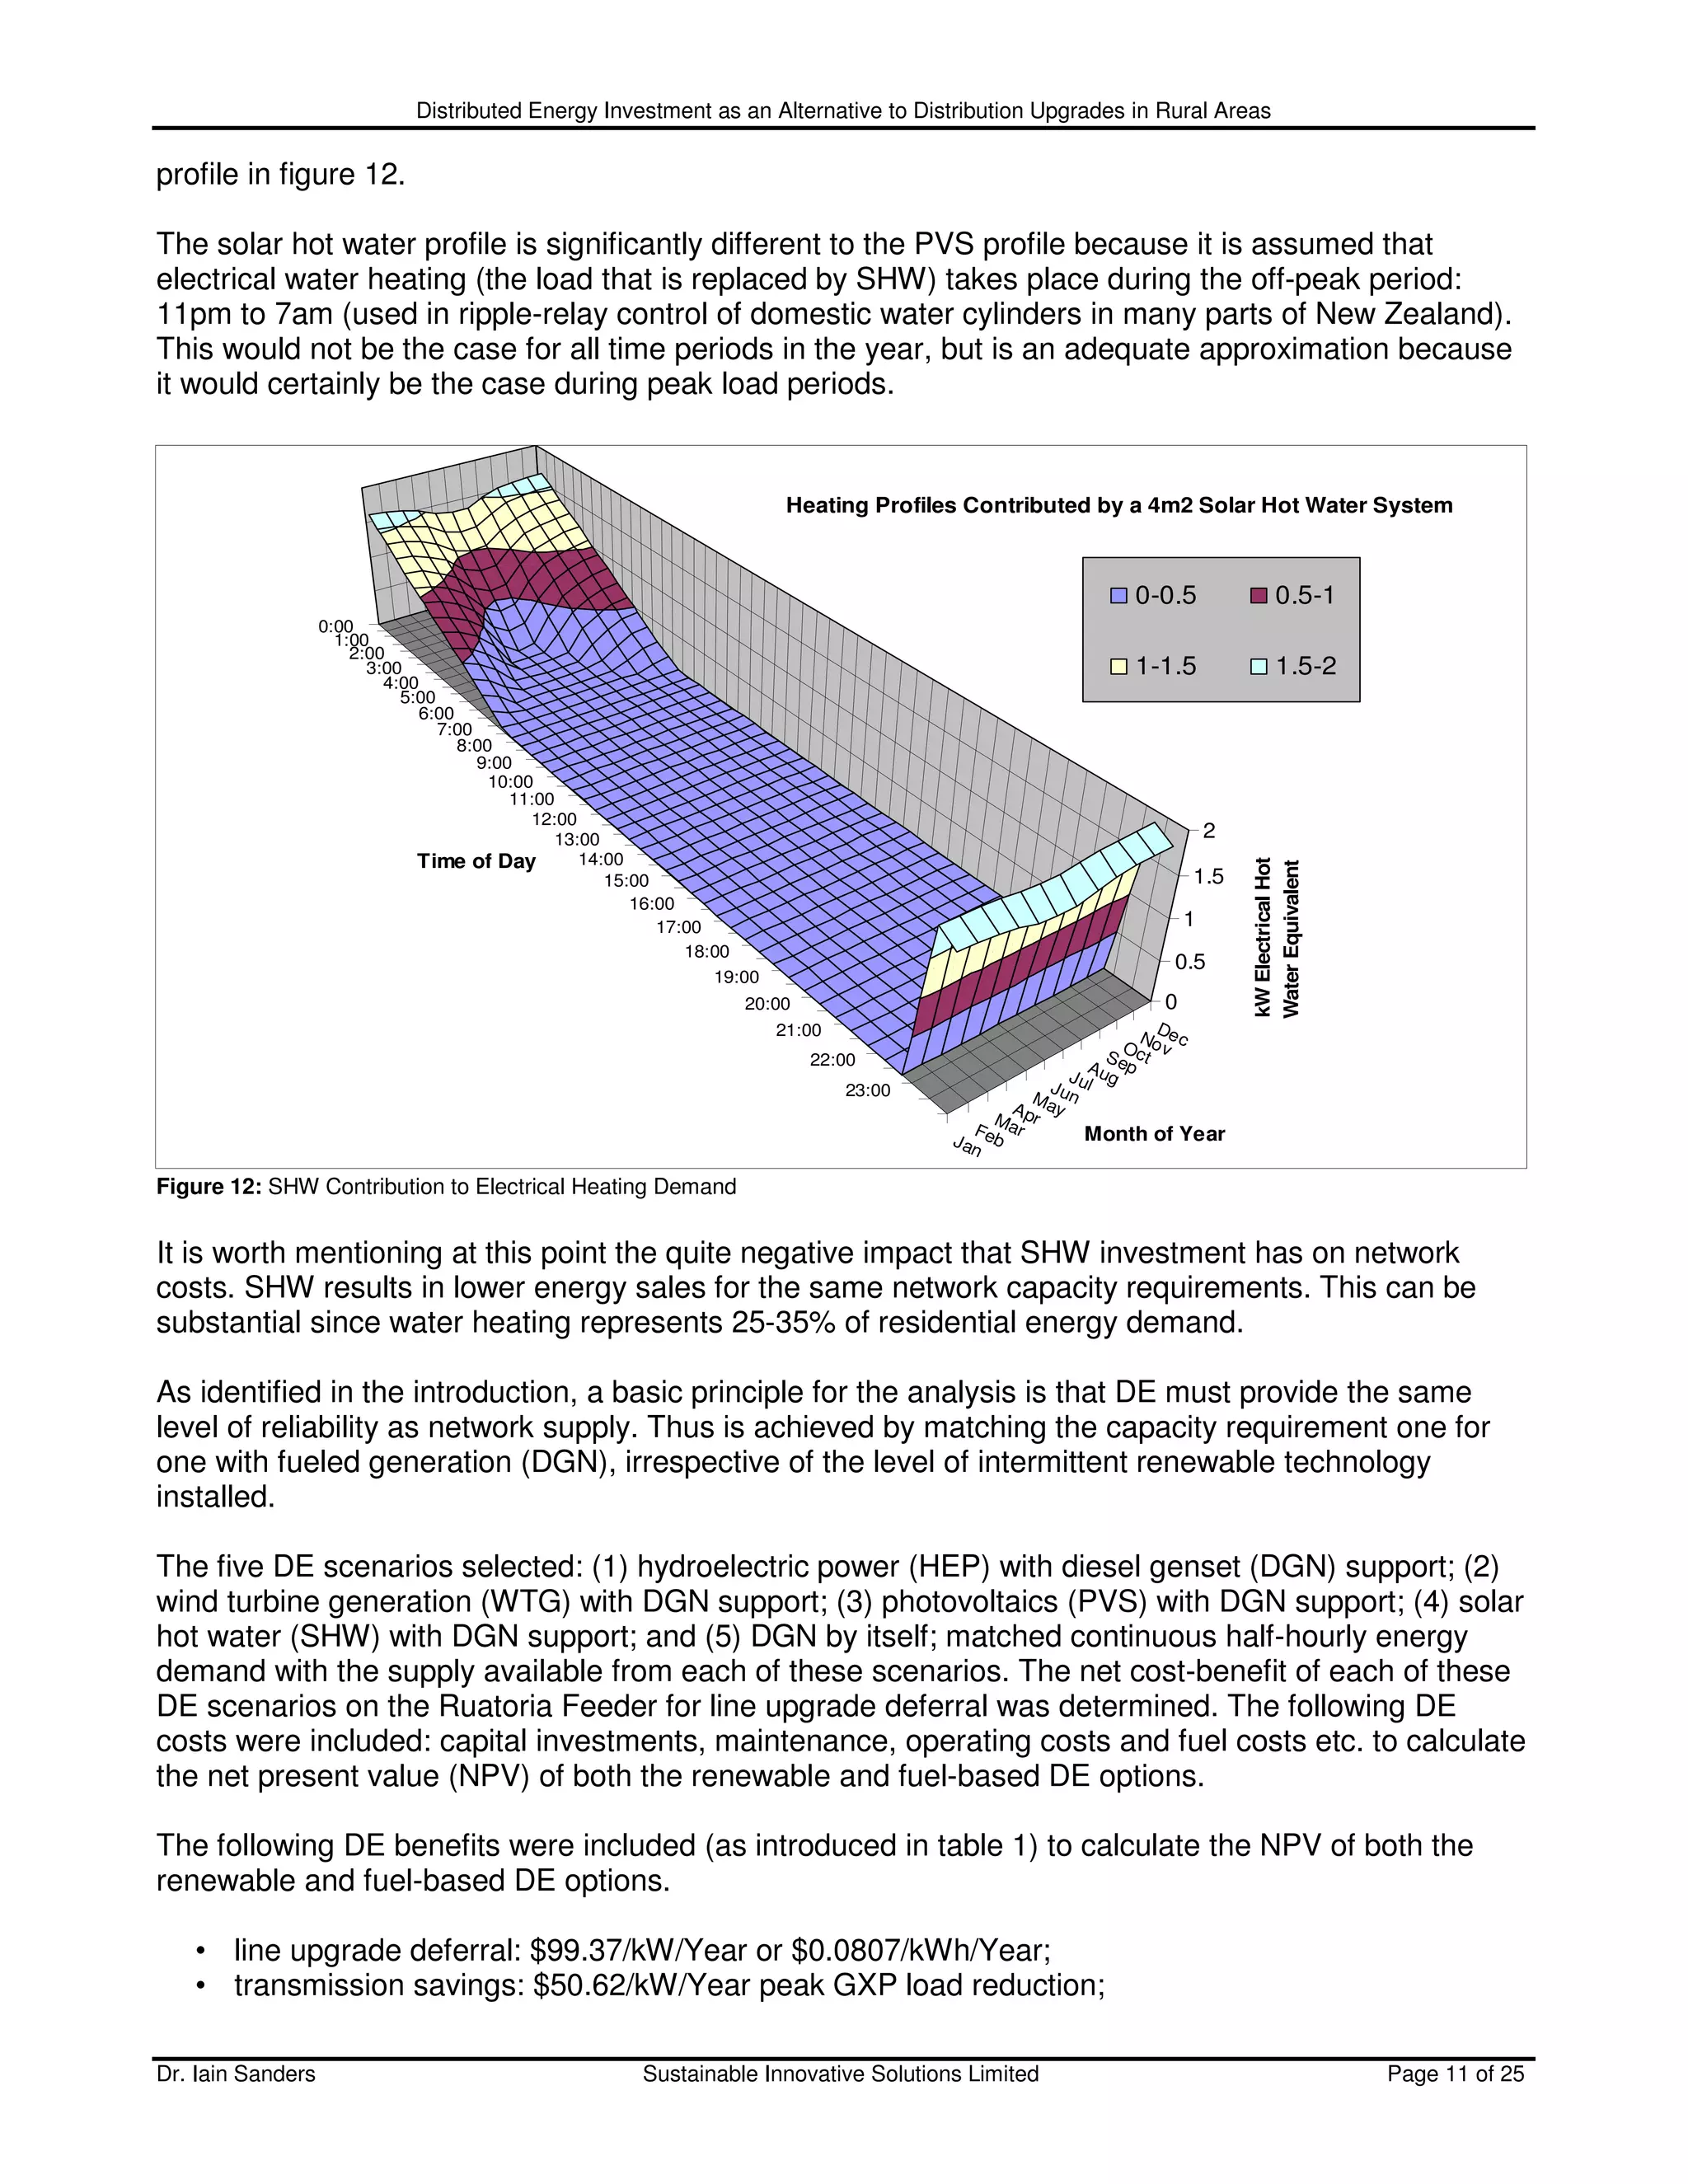
RE capacity-support shortfalls for line upgrade deferral. HEP provides the most additional non grid-
supporting energy (figure 23), followed by WTG (figure 24), then SHW (figure 26) and finally PV (figure
25). The reason why PV provides so little non grid-supporting energy, is because most of the energy
produced by PV is actually grid-supporting: the PV supply profile closely matches the Ruatoria
demand profile and the periods when peak load reduction is required.
The break down of components contributing to the Net Present Value of the diesel fuel and renewable
energy mix in figures 23 to 26 is as follows: NPV of DE benefits [DGN+RE] = [DGN+RE] line upgrade
deferral providing capacity-support, plus [DGN+RE] grid-supporting energy corresponding to line
Dr. Iain Sanders Sustainable Innovative Solutions Limited Page 19 of 25](https://image.slidesharecdn.com/rde4web-090802230158-phpapp01/75/Line-Upgrade-Deferral-Scenarios-for-Distributed-Renewable-Energy-Resources-19-2048.jpg)
![Distributed Energy Investment as an Alternative to Distribution Upgrades in Rural Areas
upgrade deferral capacity-support periods, plus [RE] non-grid-supporting energy produced outside
line upgrade deferral capacity-support periods, plus [DGN+RE] transmission saving from GXP peak
load reduction from capacity-support, minus [DGN+RE] distribution losses in revenue to the lines
company, from less energy distributed by the lines company to the end-user from the GXP, because
the energy is supplied locally by distributed generation [DGN+RE] instead.
Line Upgrade Deferral Met By 50% Genset and 50% WTG DE
$1,800,000
$1,700,000
$1,600,000
$1,500,000
$1,400,000
Net Present Value of Net Annual DE Benefit
$1,300,000
$1,200,000 RE Non-Grid-Supporting Energy
$1,100,000 Gen Distribution Loss
$1,000,000 RE Distribution Loss
$900,000 Gen Grid-Supporting Energy
$800,000 RE Grid-Supporting Energy
$700,000 Gen Trans. Saving
$600,000 RE Trans. Saving
$500,000 Gen Upgrade Deferral
$400,000 RE Upgrade Deferral
$300,000
$200,000
$100,000
$0
-$100,000 1 2 3 4 5 6 7 8 9 10 11 12 13 14 15 16 17 18 19 20
-$200,000
No. of Years Line Upgrade Deferred
Figure 24: 50%/50% DGN-WTG Analysis
Line Upgrade Deferral Met By 50% Diesel Genset and 50% PV
$1,600,000
$1,500,000
$1,400,000
$1,300,000
Net Present Value of Net Annual DE Benefit
$1,200,000
$1,100,000
RE Non-Grid-Supporting Energy
$1,000,000
Gen Distribution Loss
$900,000 RE Distribution Loss
$800,000 Gen Grid-Supporting Energy
$700,000 RE Grid-Supporting Energy
$600,000 Gen Trans. Saving
$500,000 RE Trans. Saving
Gen Upgrade Deferral
$400,000
RE Upgrade Deferral
$300,000
$200,000
$100,000
$0
-$100,000 1 2 3 4 5 6 7 8 9 10 11 12 13 14 15 16 17 18 19 20
-$200,000
No. of Years Line Upgrade Deferred
Figure 25: 50%/50% DGN-PVS Analysis
Dr. Iain Sanders Sustainable Innovative Solutions Limited Page 20 of 25](https://image.slidesharecdn.com/rde4web-090802230158-phpapp01/75/Line-Upgrade-Deferral-Scenarios-for-Distributed-Renewable-Energy-Resources-20-2048.jpg)

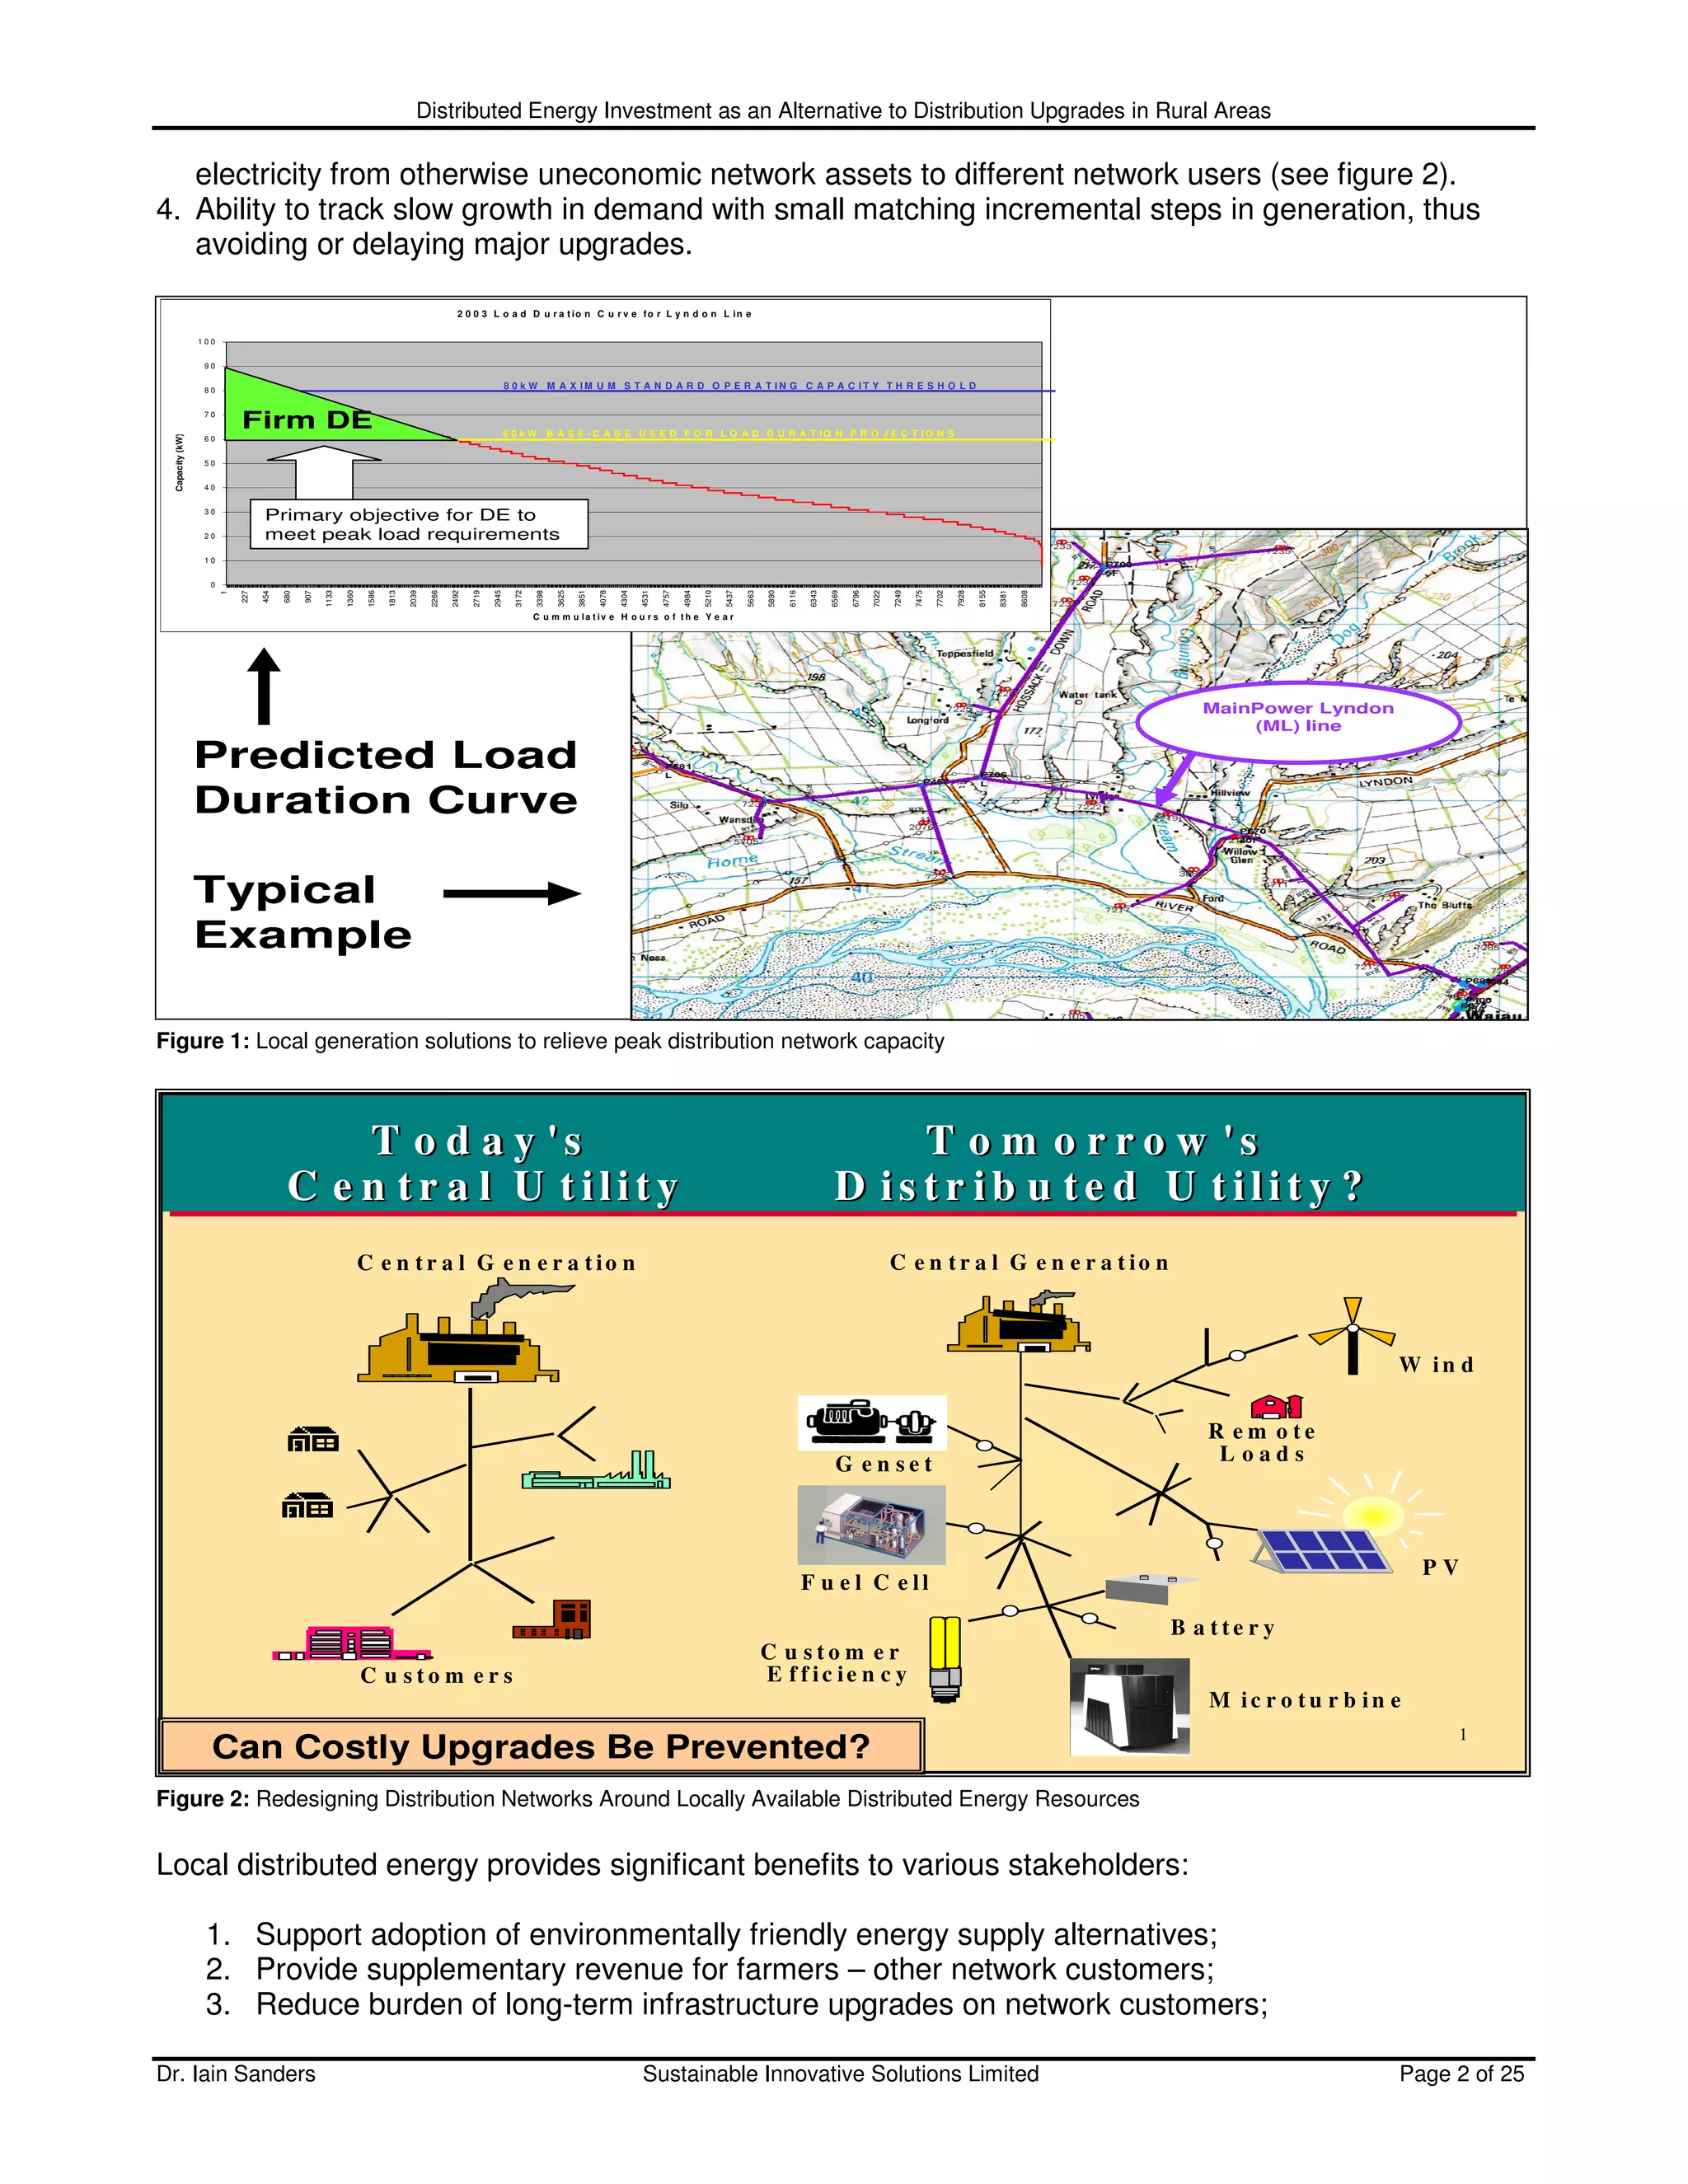
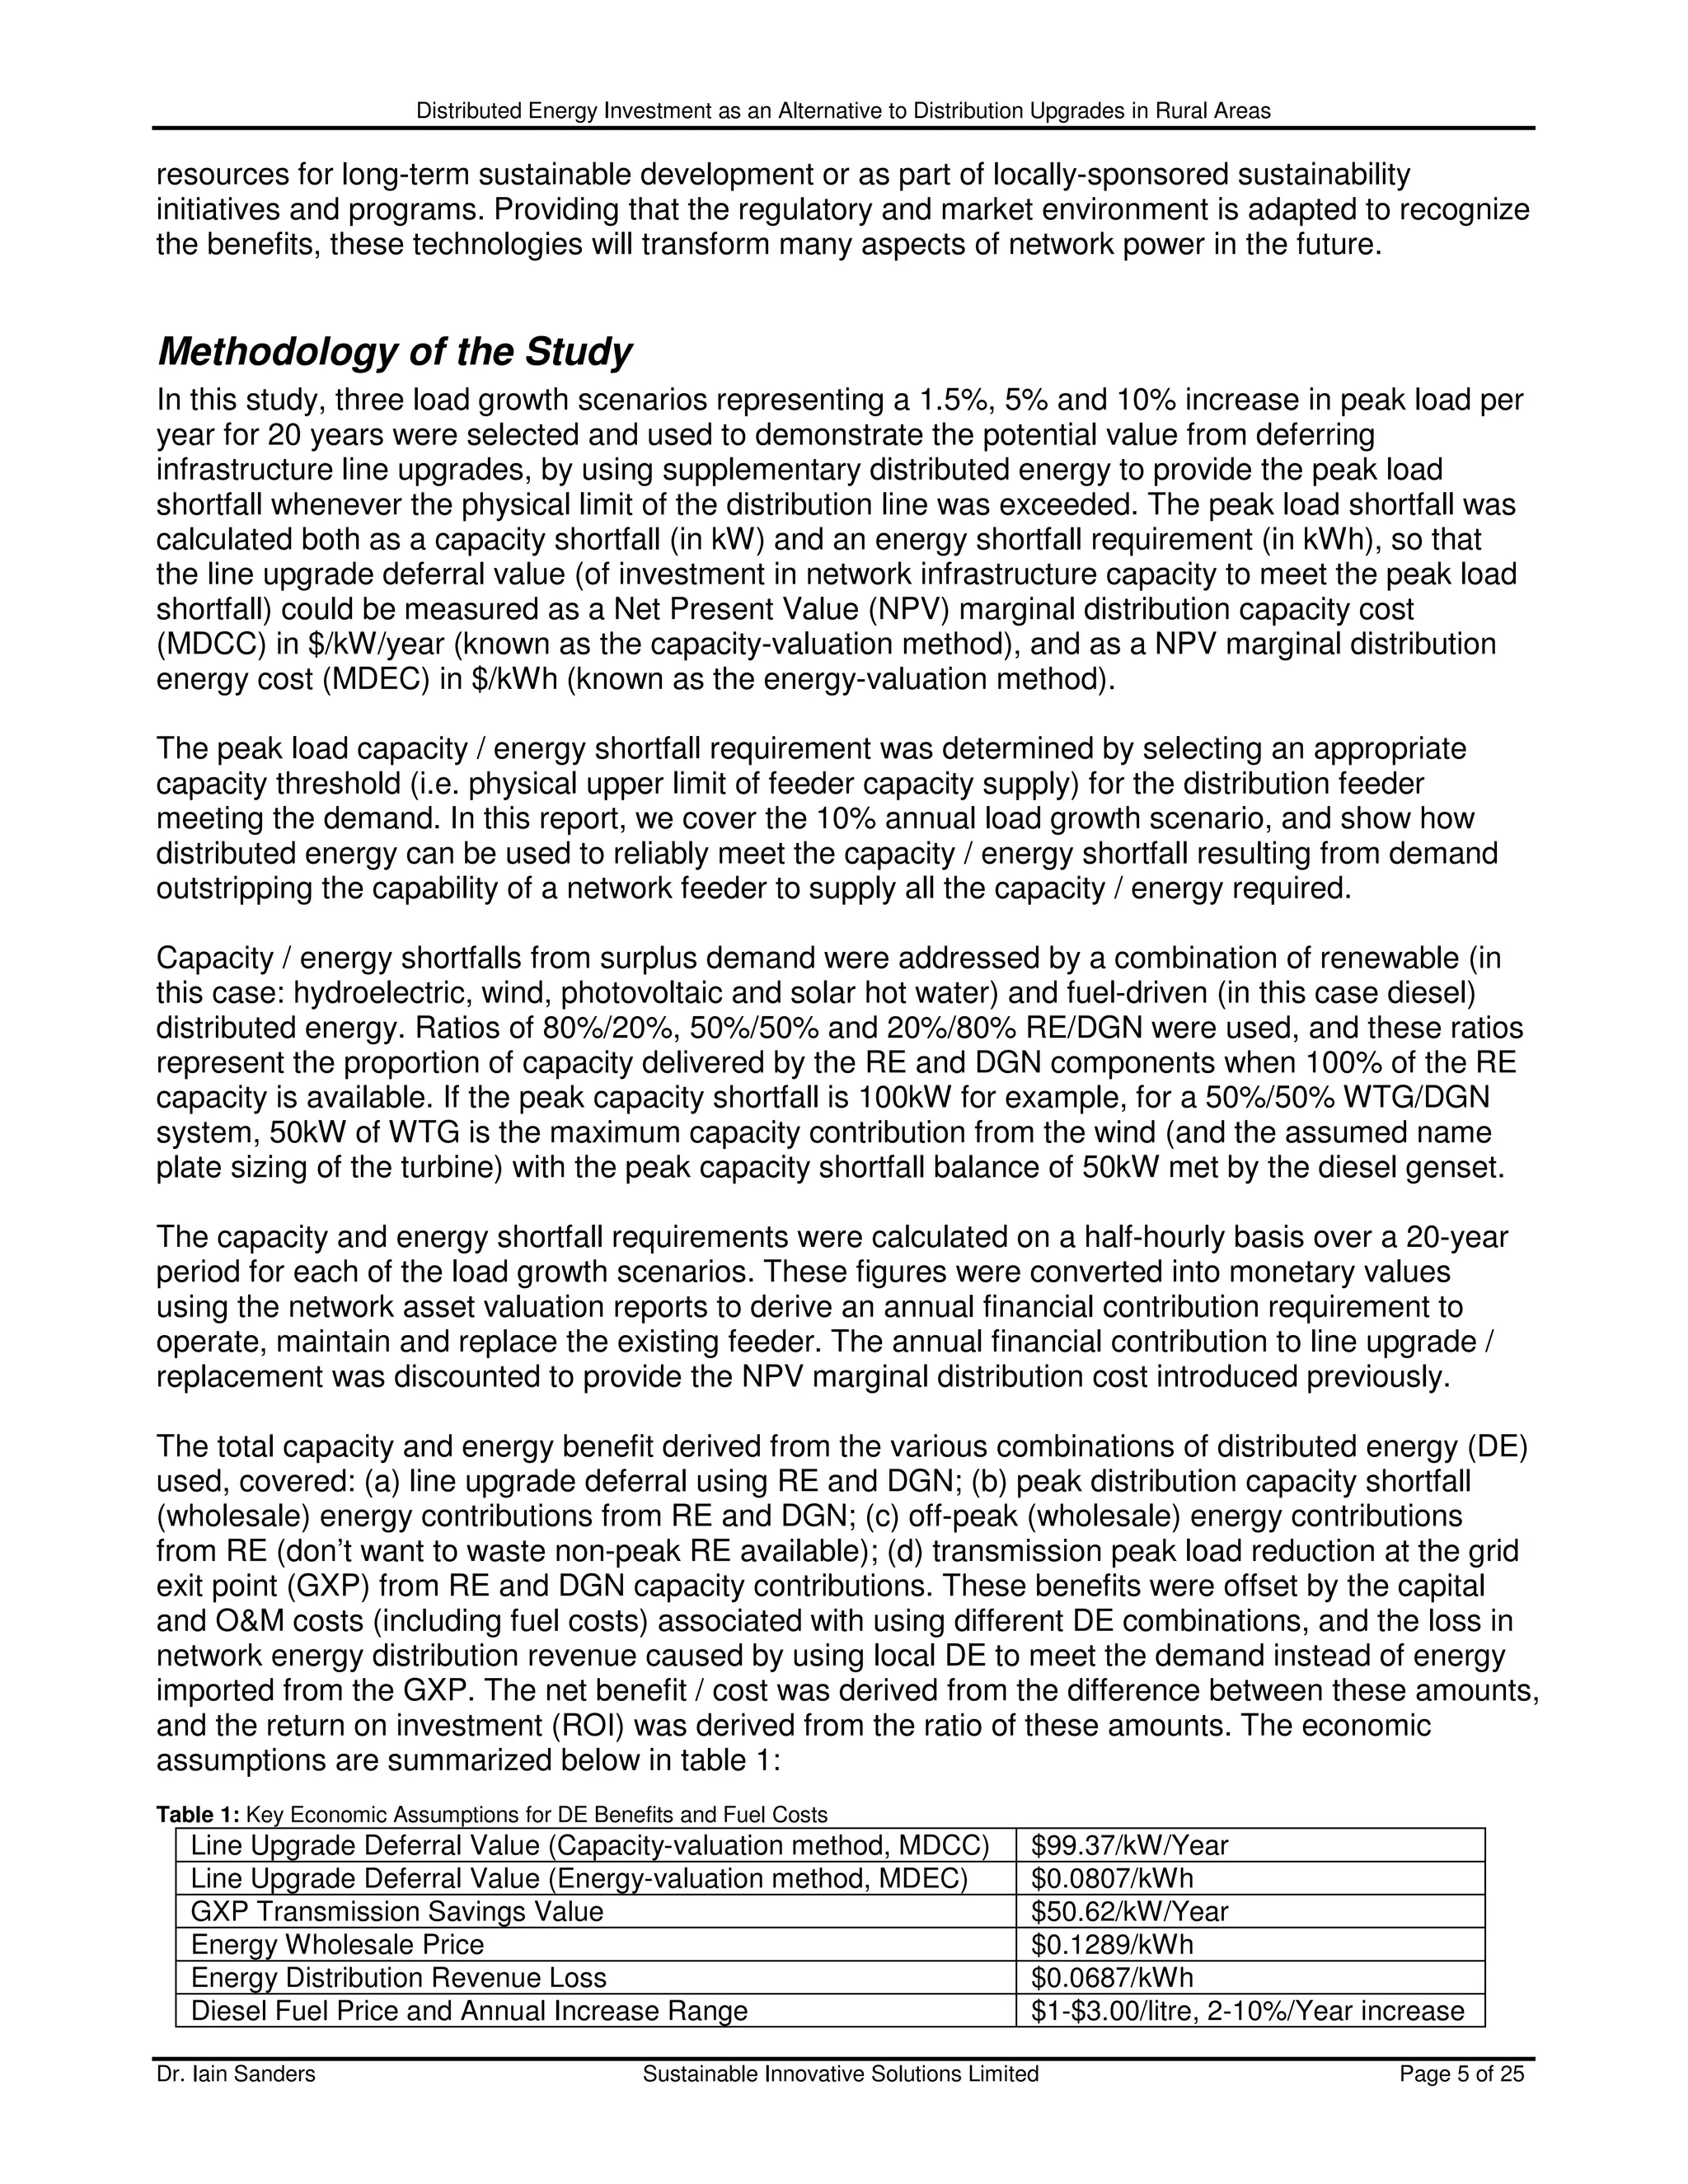
The paper evaluates various scenarios for investing in decentralized micro-generation as an alternative to distribution line upgrades in rural areas, focusing on the Eastland Networks region in New Zealand. It highlights the potential financial benefits of distributed energy systems, comparing their value in deferring infrastructure upgrades against traditional methods under different load growth scenarios. The findings suggest that integrating renewable and fuel-based energy solutions can effectively support network capacity while reducing long-term upgrade costs.


