SlideShare a Scribd company logo
Nocturnal Habitat Selection of Surf Scoters in the Salish Sea
Melanitta perspicillata
By L. Hamiltonƚ, J. R. Evensonŧ, and D. L. Robertsƚ
ȽGraduate Program on the Environment, The Evergreen State College, Olympia, WA, email: hamlin06@evergreen.edu
Ŧ Waterfowl Survey and Sea Duck Specialist, WDFW, email: joseph.evenson@dfw.wa.gov
Introduction
Surf Scoters are sea ducks that utilize the
Salish Sea during all annual life stages
except breeding. They are present all year,
but most common from August through
May. They are most often observed
foraging for mussels, clams and herring
eggs along the shoreline. Surf Scoters are
one of the least studied of all North
American duck species and populations
indicate a declining trend since 1955.
Winter estimates from the Puget Sound
indicate a 77 percent decline since 1979.
Research Objectives
1) Determine Surf Scoter nocturnal habitat use area characteristics
2) Determine what factors influence the selection of identified resting
areas through resource selection probability analysis
3) Develop predictive models to estimate likely nocturnal resting areas
across the Salish Sea.
As is true for most marine bird species, all Surf Scoter surveys have
been conducted during diurnal periods, resulting in distribution data that
lacks a nocturnal component. These data are what currently guides
conservation and management decisions in the Salish Sea. Without a
nocturnal component, our knowledge on winter habitat requirements for
Surf Scoters is incomplete and planning efforts are insufficient.
Determining nocturnal use area habitat characteristics fills an important
data gap within Surf Scoter winter habitat requirements and overall
ecology.
To identify influencing factors Washington
Department of Fish and Wildlife (WDFW),
with funding from the Sea Duck Joint
Venture, implanted surf scoters with Platform
Terminal Transmitters (PTT’s) during
winters of 2003-2006 to document the
ecology of their annual life stages.
Methods
To determine how far Surf Scoters will travel between diurnal foraging
areas and nocturnal resting areas, we measured distance traveled
between diurnal and nocturnal locations when both were present within
one Argos duty cycle. We compared distances traveled between four
regions within the Salish Sea with analysis of variance and means
comparisons for all pairs (ANOVA, Tukey-Kramer HSD; JMP®,
Version 11. SAS Institute Inc., Cary, NC, 1989-2007).
We investigated nocturnal habitat preferences with a use vs. pseudo-
non-use resource selection design. We generated 5,100 random
locations within the Salish Sea Study area using ArcMap. For each
nocturnal satellite location and random pseudo-non-use location we
measured minimum distance to shore, water depth, tidal current,
exposure of nearest shoreline and vessel traffic density using various
spatial layers in ArcMap. We compared measurements between use and
pseudo-non-use points with t-tests (JMP®, Version 11).
We determined which habitat variables were the best predictors of
nocturnal presence using logistic regression (JMP®, Version 11) and
evaluated competing models with Akaike’s information criterion
adjusted for small sample sizes and AICc weights. Through the subset
model selection approach we evaluated 4 predictor variables; minimum
distance to shore, water depth, root-mean square tidal current, and
vessel traffic density.
Results
From the original filtered
data sets from 34 Surf
Scoters, we measured 233
movements between diurnal
and nocturnal locations
throughout the Salish Sea
resulting in an average
distance traveled of 3,967m.
ANOVA revealed variation
between regions (F3 = 5.22,
Data Preparation
Removed:
- Low Accuracy Data
- Civil Twilight
Locations
- Diurnal Locations
- Flightless Moult
Locations
- Auto correlated
Locations
Use
Pseudo-non-
use F
Range of
nocturnal use
Variable 𝑋 SE 𝑋 SE
Min Dist to Shore (m) 1388 33 3605 49 -37.14*** 2 - 8415
Water Depth (m) -34 41 -115 1.42 42.83 ˗251 - 0
Tidal Current (RMS) 0.09 0.002 0.22 0.003 -33.15*** 0.01 – 0.87
Shoreline ExposureA 2.40 0.60 3.1 0.01 0.09***(U) 1-4
Vessel Traffic Density 0.22 0.02 0.54 0.03 -8.23*** 0 – 9.12
A signifies that difference was evaluated with chi squared likelihood statistic.
*** signifies P < 0.0001 at 95% confidence.
Table 1. Mean comparisons for 5 habitat variables.
𝒑 = 0.1257 + 0.0131*Depth + -4.9350*Tidal + -0.0519*Vessel +
-4.48E-05*MinDistShore
Of the 15 candidate nocturnal presence prediction models, the full
model best fit the data, accounting for 71% of the AICc weight and was
3.5 times more likely to explain habitat preference than the next best
fitting model. This is strong but not unequivocal (w>0.90) support for
the best AICc model, so model averaging (Burnham and Anderson 2002)
was conducted. Only the 4 confidence set models were averaged as they
accounted for 99% of the AICc weight. This resulted in our nocturnal
presence model below:
Discussion
We provide a quantitative analysis that shows that Surf Scoters utilize nocturnal habitats that differ from documented diurnal distributions. Our
nocturnal location data has confirmed that Surf Scoters move offshore to deeper water to rest in comparison to diurnal foraging areas. The longer
distances traveled in the South Puget Sound region reinforces the importance of the characteristics that are selected. This region is almost entirely
comprised of narrow passages and inlets and demonstrates that Surf Scoters balance utilizing preferred nocturnal habitat, with minimizing distances
from food resources These findings set a precedent for future studies regarding a variety of marine birds displaying similar movement and behavior
characteristics and identifies a need to consider nocturnal distribution when assessing the conservation status of marine bird species in general.
Habitat in deeper and more open water is accompanied by threats (e.g. vessel traffic) that are different than those Scoters face in nearshore habitats.
Washington State waters see ~ 230,000 transits annually, including nearly 8,000 deep draft vessel movements. Our nocturnal data demonstrated a
strong avoidance of high vessel traffic in the Salish Sea. As rest periods are critical for conserving energy during winter months, vessel disturbance
would be detrimental during nocturnal periods. This suggest the possibility of night time vessel traffic limiting available nocturnal habitat for Surf
Scoters.
In addition to vessel traffic being a direct daily disturbance, bird distributions that overlap or occur in close proximity to oil transportation are at
greater risk of contamination. Many small oil spills (1000 L or less) go undetected or unreported. These small-scale oil discharges are more widely
distributed and happen more frequently, causing a greater ecological impact and potentially have cumulative effects on seabird populations. Also,
determination of important nocturnal use areas will improve catastrophic oil spill response plans, which do not currently account for nocturnal bird
use areas in Washington.
Figure 3. Map showing nocturnal locations in
purple, diurnal locations in yellow and current
tanker vessel traffic density in the Salish Sea.
3967
3629
3854
3218
6066
0 1000 2000 3000 4000 5000 6000 7000
ALL REGIONS
STRAIT OF GEORGIA
NORTH PUGET SOUND
CENTRAL PUGET SOUND
SOUTH PUGET SOUND
Means comparisons between 1,064 nocturnal use locations and 5,002
pseudo-non-use locations revealed differences in minimum distance to
shore, root-mean-squared tidal current, exposure of nearest shoreline and
vessel traffic density (Table 1).
Figure 2. Average distance traveled (m) by Surf Scoters
between diurnal and nocturnal locations within a 24
hour period within the Salish Sea.
P = 0.0017) and a post hoc Tukey test showed a difference in mean
distance traveled between the South Puget Sound and the Central Puget
Sound region (q = 2.59, P = 0.0008) (Figure 2).
Distance (in meters)
Figure 1. Flow chart of data manipulation
conducted in preparation for analysis.

More Related Content

What's hot

Assesmnt of highly migratory stock
Assesmnt of highly migratory stockAssesmnt of highly migratory stock
Assesmnt of highly migratory stock
Olik Jomang
 
DY Atagi MSc Thesis Estuarine Use by Juvenile Coho Salmon ubc_1994-0362
DY Atagi MSc Thesis Estuarine Use by Juvenile Coho Salmon ubc_1994-0362DY Atagi MSc Thesis Estuarine Use by Juvenile Coho Salmon ubc_1994-0362
DY Atagi MSc Thesis Estuarine Use by Juvenile Coho Salmon ubc_1994-0362
Dana Atagi
 
LAUER DenmanPosterFINAL
LAUER DenmanPosterFINALLAUER DenmanPosterFINAL
LAUER DenmanPosterFINAL
Marissa Lauer
 
DouglasFishBull2014
DouglasFishBull2014DouglasFishBull2014
DouglasFishBull2014
Ver Iriarte
 
EVS 311 Central TX Hydro RKM
EVS 311 Central TX Hydro RKMEVS 311 Central TX Hydro RKM
EVS 311 Central TX Hydro RKM
Ryan McKeeman
 
6_SF2C_JieLiu
6_SF2C_JieLiu6_SF2C_JieLiu
6_SF2C_JieLiu
Jie Liu
 

What's hot (20)

DSD-INT 2017 A stroll through the European marine data landscape the role of ...
DSD-INT 2017 A stroll through the European marine data landscape the role of ...DSD-INT 2017 A stroll through the European marine data landscape the role of ...
DSD-INT 2017 A stroll through the European marine data landscape the role of ...
 
Assesmnt of highly migratory stock
Assesmnt of highly migratory stockAssesmnt of highly migratory stock
Assesmnt of highly migratory stock
 
Estimating and Classifying Spatial and Temporal Distributions of Flow Conditi...
Estimating and Classifying Spatial and Temporal Distributions of Flow Conditi...Estimating and Classifying Spatial and Temporal Distributions of Flow Conditi...
Estimating and Classifying Spatial and Temporal Distributions of Flow Conditi...
 
Suspended Sediment Measurements in Irish Rivers (summary)
Suspended Sediment Measurements in Irish Rivers (summary)Suspended Sediment Measurements in Irish Rivers (summary)
Suspended Sediment Measurements in Irish Rivers (summary)
 
Siltflux Leaflet
Siltflux LeafletSiltflux Leaflet
Siltflux Leaflet
 
DY Atagi MSc Thesis Estuarine Use by Juvenile Coho Salmon ubc_1994-0362
DY Atagi MSc Thesis Estuarine Use by Juvenile Coho Salmon ubc_1994-0362DY Atagi MSc Thesis Estuarine Use by Juvenile Coho Salmon ubc_1994-0362
DY Atagi MSc Thesis Estuarine Use by Juvenile Coho Salmon ubc_1994-0362
 
Geospatial Condition Analysis
Geospatial Condition AnalysisGeospatial Condition Analysis
Geospatial Condition Analysis
 
REVISION AS CAMBRIDGE GEOGRAPHY: RIVERS - MEANDER
REVISION AS CAMBRIDGE GEOGRAPHY: RIVERS - MEANDERREVISION AS CAMBRIDGE GEOGRAPHY: RIVERS - MEANDER
REVISION AS CAMBRIDGE GEOGRAPHY: RIVERS - MEANDER
 
NCUR PAPER_FINAL DRAFT
NCUR PAPER_FINAL DRAFTNCUR PAPER_FINAL DRAFT
NCUR PAPER_FINAL DRAFT
 
LAUER DenmanPosterFINAL
LAUER DenmanPosterFINALLAUER DenmanPosterFINAL
LAUER DenmanPosterFINAL
 
DouglasFishBull2014
DouglasFishBull2014DouglasFishBull2014
DouglasFishBull2014
 
River classification smj_july25_english
River classification smj_july25_englishRiver classification smj_july25_english
River classification smj_july25_english
 
REVISION AS CAMBRIDGE GEOGRAPHY: RIVERS - SUSTAINABLE FLOOD MANAGEMENT
REVISION AS CAMBRIDGE GEOGRAPHY: RIVERS - SUSTAINABLE FLOOD MANAGEMENTREVISION AS CAMBRIDGE GEOGRAPHY: RIVERS - SUSTAINABLE FLOOD MANAGEMENT
REVISION AS CAMBRIDGE GEOGRAPHY: RIVERS - SUSTAINABLE FLOOD MANAGEMENT
 
61; road mortalites of reptiles in the vendee
61; road mortalites of reptiles in the vendee61; road mortalites of reptiles in the vendee
61; road mortalites of reptiles in the vendee
 
C04471522
C04471522C04471522
C04471522
 
EVS 311 Central TX Hydro RKM
EVS 311 Central TX Hydro RKMEVS 311 Central TX Hydro RKM
EVS 311 Central TX Hydro RKM
 
6_SF2C_JieLiu
6_SF2C_JieLiu6_SF2C_JieLiu
6_SF2C_JieLiu
 
Hauser_MSthesis
Hauser_MSthesisHauser_MSthesis
Hauser_MSthesis
 
Science collaborative - Angela Doroff
Science collaborative - Angela DoroffScience collaborative - Angela Doroff
Science collaborative - Angela Doroff
 
Rationalizing the 1962-2006 Drop in Water Levels of Lakes Michigan and Huron
Rationalizing the 1962-2006 Drop in Water Levels of Lakes Michigan and HuronRationalizing the 1962-2006 Drop in Water Levels of Lakes Michigan and Huron
Rationalizing the 1962-2006 Drop in Water Levels of Lakes Michigan and Huron
 

Viewers also liked

Presentacion biologia equipo "las de laintuición"
Presentacion biologia equipo "las de laintuición"Presentacion biologia equipo "las de laintuición"
Presentacion biologia equipo "las de laintuición"
Eli Hernandez Leon
 

Viewers also liked (8)

Búsqueda de información en google
Búsqueda de información en googleBúsqueda de información en google
Búsqueda de información en google
 
Brooklyn and Manhattan
Brooklyn and ManhattanBrooklyn and Manhattan
Brooklyn and Manhattan
 
Web Usability & SEO Glossary
Web Usability & SEO GlossaryWeb Usability & SEO Glossary
Web Usability & SEO Glossary
 
Presentacion astrid
Presentacion  astridPresentacion  astrid
Presentacion astrid
 
Xpeerience 3.0 Edition 2
Xpeerience 3.0 Edition 2Xpeerience 3.0 Edition 2
Xpeerience 3.0 Edition 2
 
Presentacion biologia equipo "las de laintuición"
Presentacion biologia equipo "las de laintuición"Presentacion biologia equipo "las de laintuición"
Presentacion biologia equipo "las de laintuición"
 
Quick Guide to Relaunching your WordPress Website with a new theme
Quick Guide to Relaunching your WordPress Website with a new themeQuick Guide to Relaunching your WordPress Website with a new theme
Quick Guide to Relaunching your WordPress Website with a new theme
 
TNWAC WorldQuest Practice Questions Fall 2015 Part 2
TNWAC WorldQuest Practice Questions Fall 2015 Part 2TNWAC WorldQuest Practice Questions Fall 2015 Part 2
TNWAC WorldQuest Practice Questions Fall 2015 Part 2
 

Similar to LindseyHamilton_NocturnalSurfScoterDistributionPoster_2015

Spatial Circulation Patterns Over Palmer Deep Canyon and the Effects on Adeli...
Spatial Circulation Patterns Over Palmer Deep Canyon and the Effects on Adeli...Spatial Circulation Patterns Over Palmer Deep Canyon and the Effects on Adeli...
Spatial Circulation Patterns Over Palmer Deep Canyon and the Effects on Adeli...
Katherine Todoroff
 
Interactions and space-use overlap between satellite-tracked blue sharks and ...
Interactions and space-use overlap between satellite-tracked blue sharks and ...Interactions and space-use overlap between satellite-tracked blue sharks and ...
Interactions and space-use overlap between satellite-tracked blue sharks and ...
ecologiaazul
 
2013 Vianna et al. Vertical movements of grey reef shark
2013 Vianna et al. Vertical movements of grey reef shark2013 Vianna et al. Vertical movements of grey reef shark
2013 Vianna et al. Vertical movements of grey reef shark
Gabriel Maciel de Souza Vianna
 
Meeting the Threat of MaritimeImprovised Explosive Devices.docx
Meeting the Threat of MaritimeImprovised Explosive Devices.docxMeeting the Threat of MaritimeImprovised Explosive Devices.docx
Meeting the Threat of MaritimeImprovised Explosive Devices.docx
buffydtesurina
 
SCANU B129829-Final Project Report
SCANU B129829-Final Project ReportSCANU B129829-Final Project Report
SCANU B129829-Final Project Report
Simona Scanu
 
V8 Supercar Race, Sydney Olympic Park and Waterbird Impacts.
V8 Supercar Race, Sydney Olympic Park and Waterbird Impacts.V8 Supercar Race, Sydney Olympic Park and Waterbird Impacts.
V8 Supercar Race, Sydney Olympic Park and Waterbird Impacts.
Dr Stephen Ambrose
 
One Fish, Two Fish, Blue Crab, Pompano- An Analysis of Marine and Estuarine S...
One Fish, Two Fish, Blue Crab, Pompano- An Analysis of Marine and Estuarine S...One Fish, Two Fish, Blue Crab, Pompano- An Analysis of Marine and Estuarine S...
One Fish, Two Fish, Blue Crab, Pompano- An Analysis of Marine and Estuarine S...
Cody Gramlin
 
Local Water Quality Assessment
Local Water Quality AssessmentLocal Water Quality Assessment
Local Water Quality Assessment
Kenneth Goodson
 
Pearce and Mann 2006
Pearce and Mann 2006Pearce and Mann 2006
Pearce and Mann 2006
Vicky Mann
 
2016 Vianna et al. Indicators of fishing mortality in Palau_Authors copy
2016 Vianna et al. Indicators of fishing mortality in Palau_Authors copy2016 Vianna et al. Indicators of fishing mortality in Palau_Authors copy
2016 Vianna et al. Indicators of fishing mortality in Palau_Authors copy
Gabriel Maciel de Souza Vianna
 
Evaluating Basins for Salmon Conservation across the North Pacific: Abundance...
Evaluating Basins for Salmon Conservation across the North Pacific: Abundance...Evaluating Basins for Salmon Conservation across the North Pacific: Abundance...
Evaluating Basins for Salmon Conservation across the North Pacific: Abundance...
Ecotrust
 
SWOT_Fu_2011_IGARSS.ppt
SWOT_Fu_2011_IGARSS.pptSWOT_Fu_2011_IGARSS.ppt
SWOT_Fu_2011_IGARSS.ppt
grssieee
 

Similar to LindseyHamilton_NocturnalSurfScoterDistributionPoster_2015 (20)

Grimaldo_et_al_2004
Grimaldo_et_al_2004Grimaldo_et_al_2004
Grimaldo_et_al_2004
 
Grimaldo tidal marsh
Grimaldo tidal marshGrimaldo tidal marsh
Grimaldo tidal marsh
 
Spatial Circulation Patterns Over Palmer Deep Canyon and the Effects on Adeli...
Spatial Circulation Patterns Over Palmer Deep Canyon and the Effects on Adeli...Spatial Circulation Patterns Over Palmer Deep Canyon and the Effects on Adeli...
Spatial Circulation Patterns Over Palmer Deep Canyon and the Effects on Adeli...
 
Interactions and space-use overlap between satellite-tracked blue sharks and ...
Interactions and space-use overlap between satellite-tracked blue sharks and ...Interactions and space-use overlap between satellite-tracked blue sharks and ...
Interactions and space-use overlap between satellite-tracked blue sharks and ...
 
2013 Vianna et al. Vertical movements of grey reef shark
2013 Vianna et al. Vertical movements of grey reef shark2013 Vianna et al. Vertical movements of grey reef shark
2013 Vianna et al. Vertical movements of grey reef shark
 
The Intertidal and Kelp Forests - Pacific Coast
The Intertidal and Kelp Forests  - Pacific CoastThe Intertidal and Kelp Forests  - Pacific Coast
The Intertidal and Kelp Forests - Pacific Coast
 
Meeting the Threat of MaritimeImprovised Explosive Devices.docx
Meeting the Threat of MaritimeImprovised Explosive Devices.docxMeeting the Threat of MaritimeImprovised Explosive Devices.docx
Meeting the Threat of MaritimeImprovised Explosive Devices.docx
 
SCANU B129829-Final Project Report
SCANU B129829-Final Project ReportSCANU B129829-Final Project Report
SCANU B129829-Final Project Report
 
V8 Supercar Race, Sydney Olympic Park and Waterbird Impacts.
V8 Supercar Race, Sydney Olympic Park and Waterbird Impacts.V8 Supercar Race, Sydney Olympic Park and Waterbird Impacts.
V8 Supercar Race, Sydney Olympic Park and Waterbird Impacts.
 
NISAR NASA-ISRO Synthetic Aperture Radar (NISAR) Coastal Land Loss
NISAR NASA-ISRO Synthetic Aperture Radar (NISAR) Coastal Land LossNISAR NASA-ISRO Synthetic Aperture Radar (NISAR) Coastal Land Loss
NISAR NASA-ISRO Synthetic Aperture Radar (NISAR) Coastal Land Loss
 
One Fish, Two Fish, Blue Crab, Pompano- An Analysis of Marine and Estuarine S...
One Fish, Two Fish, Blue Crab, Pompano- An Analysis of Marine and Estuarine S...One Fish, Two Fish, Blue Crab, Pompano- An Analysis of Marine and Estuarine S...
One Fish, Two Fish, Blue Crab, Pompano- An Analysis of Marine and Estuarine S...
 
Local Water Quality Assessment
Local Water Quality AssessmentLocal Water Quality Assessment
Local Water Quality Assessment
 
Pearce and Mann 2006
Pearce and Mann 2006Pearce and Mann 2006
Pearce and Mann 2006
 
BTech Project
BTech ProjectBTech Project
BTech Project
 
2016 Vianna et al. Indicators of fishing mortality in Palau_Authors copy
2016 Vianna et al. Indicators of fishing mortality in Palau_Authors copy2016 Vianna et al. Indicators of fishing mortality in Palau_Authors copy
2016 Vianna et al. Indicators of fishing mortality in Palau_Authors copy
 
Evaluating Basins for Salmon Conservation across the North Pacific: Abundance...
Evaluating Basins for Salmon Conservation across the North Pacific: Abundance...Evaluating Basins for Salmon Conservation across the North Pacific: Abundance...
Evaluating Basins for Salmon Conservation across the North Pacific: Abundance...
 
THESIS
THESISTHESIS
THESIS
 
coastal management by Remote Sensing and GIS
coastal management by Remote Sensing and GIScoastal management by Remote Sensing and GIS
coastal management by Remote Sensing and GIS
 
Terrigenous sediment dynamics in a small, tropical, fringing-reef embayment
Terrigenous sediment dynamics in a small, tropical, fringing-reef embaymentTerrigenous sediment dynamics in a small, tropical, fringing-reef embayment
Terrigenous sediment dynamics in a small, tropical, fringing-reef embayment
 
SWOT_Fu_2011_IGARSS.ppt
SWOT_Fu_2011_IGARSS.pptSWOT_Fu_2011_IGARSS.ppt
SWOT_Fu_2011_IGARSS.ppt
 

LindseyHamilton_NocturnalSurfScoterDistributionPoster_2015

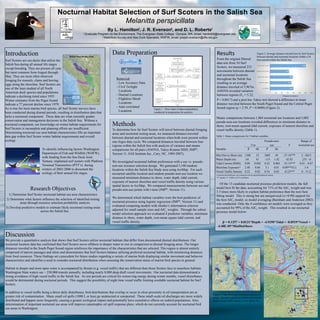
  • 1. Nocturnal Habitat Selection of Surf Scoters in the Salish Sea Melanitta perspicillata By L. Hamiltonƚ, J. R. Evensonŧ, and D. L. Robertsƚ ȽGraduate Program on the Environment, The Evergreen State College, Olympia, WA, email: hamlin06@evergreen.edu Ŧ Waterfowl Survey and Sea Duck Specialist, WDFW, email: joseph.evenson@dfw.wa.gov Introduction Surf Scoters are sea ducks that utilize the Salish Sea during all annual life stages except breeding. They are present all year, but most common from August through May. They are most often observed foraging for mussels, clams and herring eggs along the shoreline. Surf Scoters are one of the least studied of all North American duck species and populations indicate a declining trend since 1955. Winter estimates from the Puget Sound indicate a 77 percent decline since 1979. Research Objectives 1) Determine Surf Scoter nocturnal habitat use area characteristics 2) Determine what factors influence the selection of identified resting areas through resource selection probability analysis 3) Develop predictive models to estimate likely nocturnal resting areas across the Salish Sea. As is true for most marine bird species, all Surf Scoter surveys have been conducted during diurnal periods, resulting in distribution data that lacks a nocturnal component. These data are what currently guides conservation and management decisions in the Salish Sea. Without a nocturnal component, our knowledge on winter habitat requirements for Surf Scoters is incomplete and planning efforts are insufficient. Determining nocturnal use area habitat characteristics fills an important data gap within Surf Scoter winter habitat requirements and overall ecology. To identify influencing factors Washington Department of Fish and Wildlife (WDFW), with funding from the Sea Duck Joint Venture, implanted surf scoters with Platform Terminal Transmitters (PTT’s) during winters of 2003-2006 to document the ecology of their annual life stages. Methods To determine how far Surf Scoters will travel between diurnal foraging areas and nocturnal resting areas, we measured distance traveled between diurnal and nocturnal locations when both were present within one Argos duty cycle. We compared distances traveled between four regions within the Salish Sea with analysis of variance and means comparisons for all pairs (ANOVA, Tukey-Kramer HSD; JMP®, Version 11. SAS Institute Inc., Cary, NC, 1989-2007). We investigated nocturnal habitat preferences with a use vs. pseudo- non-use resource selection design. We generated 5,100 random locations within the Salish Sea Study area using ArcMap. For each nocturnal satellite location and random pseudo-non-use location we measured minimum distance to shore, water depth, tidal current, exposure of nearest shoreline and vessel traffic density using various spatial layers in ArcMap. We compared measurements between use and pseudo-non-use points with t-tests (JMP®, Version 11). We determined which habitat variables were the best predictors of nocturnal presence using logistic regression (JMP®, Version 11) and evaluated competing models with Akaike’s information criterion adjusted for small sample sizes and AICc weights. Through the subset model selection approach we evaluated 4 predictor variables; minimum distance to shore, water depth, root-mean square tidal current, and vessel traffic density. Results From the original filtered data sets from 34 Surf Scoters, we measured 233 movements between diurnal and nocturnal locations throughout the Salish Sea resulting in an average distance traveled of 3,967m. ANOVA revealed variation between regions (F3 = 5.22, Data Preparation Removed: - Low Accuracy Data - Civil Twilight Locations - Diurnal Locations - Flightless Moult Locations - Auto correlated Locations Use Pseudo-non- use F Range of nocturnal use Variable 𝑋 SE 𝑋 SE Min Dist to Shore (m) 1388 33 3605 49 -37.14*** 2 - 8415 Water Depth (m) -34 41 -115 1.42 42.83 ˗251 - 0 Tidal Current (RMS) 0.09 0.002 0.22 0.003 -33.15*** 0.01 – 0.87 Shoreline ExposureA 2.40 0.60 3.1 0.01 0.09***(U) 1-4 Vessel Traffic Density 0.22 0.02 0.54 0.03 -8.23*** 0 – 9.12 A signifies that difference was evaluated with chi squared likelihood statistic. *** signifies P < 0.0001 at 95% confidence. Table 1. Mean comparisons for 5 habitat variables. 𝒑 = 0.1257 + 0.0131*Depth + -4.9350*Tidal + -0.0519*Vessel + -4.48E-05*MinDistShore Of the 15 candidate nocturnal presence prediction models, the full model best fit the data, accounting for 71% of the AICc weight and was 3.5 times more likely to explain habitat preference than the next best fitting model. This is strong but not unequivocal (w>0.90) support for the best AICc model, so model averaging (Burnham and Anderson 2002) was conducted. Only the 4 confidence set models were averaged as they accounted for 99% of the AICc weight. This resulted in our nocturnal presence model below: Discussion We provide a quantitative analysis that shows that Surf Scoters utilize nocturnal habitats that differ from documented diurnal distributions. Our nocturnal location data has confirmed that Surf Scoters move offshore to deeper water to rest in comparison to diurnal foraging areas. The longer distances traveled in the South Puget Sound region reinforces the importance of the characteristics that are selected. This region is almost entirely comprised of narrow passages and inlets and demonstrates that Surf Scoters balance utilizing preferred nocturnal habitat, with minimizing distances from food resources These findings set a precedent for future studies regarding a variety of marine birds displaying similar movement and behavior characteristics and identifies a need to consider nocturnal distribution when assessing the conservation status of marine bird species in general. Habitat in deeper and more open water is accompanied by threats (e.g. vessel traffic) that are different than those Scoters face in nearshore habitats. Washington State waters see ~ 230,000 transits annually, including nearly 8,000 deep draft vessel movements. Our nocturnal data demonstrated a strong avoidance of high vessel traffic in the Salish Sea. As rest periods are critical for conserving energy during winter months, vessel disturbance would be detrimental during nocturnal periods. This suggest the possibility of night time vessel traffic limiting available nocturnal habitat for Surf Scoters. In addition to vessel traffic being a direct daily disturbance, bird distributions that overlap or occur in close proximity to oil transportation are at greater risk of contamination. Many small oil spills (1000 L or less) go undetected or unreported. These small-scale oil discharges are more widely distributed and happen more frequently, causing a greater ecological impact and potentially have cumulative effects on seabird populations. Also, determination of important nocturnal use areas will improve catastrophic oil spill response plans, which do not currently account for nocturnal bird use areas in Washington. Figure 3. Map showing nocturnal locations in purple, diurnal locations in yellow and current tanker vessel traffic density in the Salish Sea. 3967 3629 3854 3218 6066 0 1000 2000 3000 4000 5000 6000 7000 ALL REGIONS STRAIT OF GEORGIA NORTH PUGET SOUND CENTRAL PUGET SOUND SOUTH PUGET SOUND Means comparisons between 1,064 nocturnal use locations and 5,002 pseudo-non-use locations revealed differences in minimum distance to shore, root-mean-squared tidal current, exposure of nearest shoreline and vessel traffic density (Table 1). Figure 2. Average distance traveled (m) by Surf Scoters between diurnal and nocturnal locations within a 24 hour period within the Salish Sea. P = 0.0017) and a post hoc Tukey test showed a difference in mean distance traveled between the South Puget Sound and the Central Puget Sound region (q = 2.59, P = 0.0008) (Figure 2). Distance (in meters) Figure 1. Flow chart of data manipulation conducted in preparation for analysis.