The document summarizes an experimental study that analyzed the feeding and exchange currents generated by Cassiopea jellyfish under changing bell diameters and background flow conditions. Particle image velocimetry and dye visualization were used to quantify flow fields and currents. Results showed that peak jet velocities increased with larger bell size, and larger medusas caused more water disturbance at greater distances. Secondary ejections off center from the bell were also observed and increased in velocity for larger medusas. The study provides insight into how Cassiopea jellyfish size impacts local mixing in both still and flowing waters.


![2-D particle image velocimetry
Particle image velocimetry was the experimental method employed in order to capture the fluid velocities generated
from the bell pulses and the resulting jet. To do this, a Photonics Industries 1kHz Nd: YLF single cavity double-
pulse laser [Model#DM30-527] was used for illuminating LaVision hollow glass sphere seeding particles with a
diameter of 8-12 μm. This laser was positioned above the flume (Figure 2), upstreamof the medusa. Operating at 22
amps, the laser beam emitted by the laser was then spread into a thin sheet using THORLABS CM1-K13 right angle
mirror and a LaVision concave lens. This laser sheet bisected the medusa positioned in the center of the flume. A 1
megapixel PhantomMiro LC110 CMOS camera and an AF Micro Nikkon 60 mm lens operating at 890 frames-per-
second with full 1280x800 pixel resolution were used to capture the illuminated particles in the test section. A
LaVision high-speed controller adjusted the timing between each pulse of the laser and the instance each image was
captured. This high-speed controller connected both the high-speed camera and double-pulse laser to a central
computer. After recording video, the image files were then processed in DaVis 8 (LaVision GmbH) software using
cross-correlation with a 32 x 32 pixel interrogation window, 50 percent overlap, and 2 passes followed by a 12 x 12
pixel interrogation window with 50 percent overlap, and 3 passes.
Figure 2. Schematic of the particle image velocimetry experimental setup (not to scale). The laser and mirror were
positioned above the flume. A laser sheet from the mirror= bisected the medusa and was parallel to the flume walls.
The laser sheet was also perpendicular to the PhantomMiro LC110 CMOS camera used for recording.
qualitative flow visualization
Pink and white food coloring [Sunny Side Up Bakery] were mixed together with 500 mL of water from the water
tunnel. Food coloring was continuously added into a 1000 mL beaker until a bright pink color was achieved. White
cardboard paper was added onto the backside of the tank to increase the contrast. A Canon EOS 6D DSLR 20.2
megapixel camera with a Canon EFS 60 mm macro lens was used to record the dye propagation. After waiting
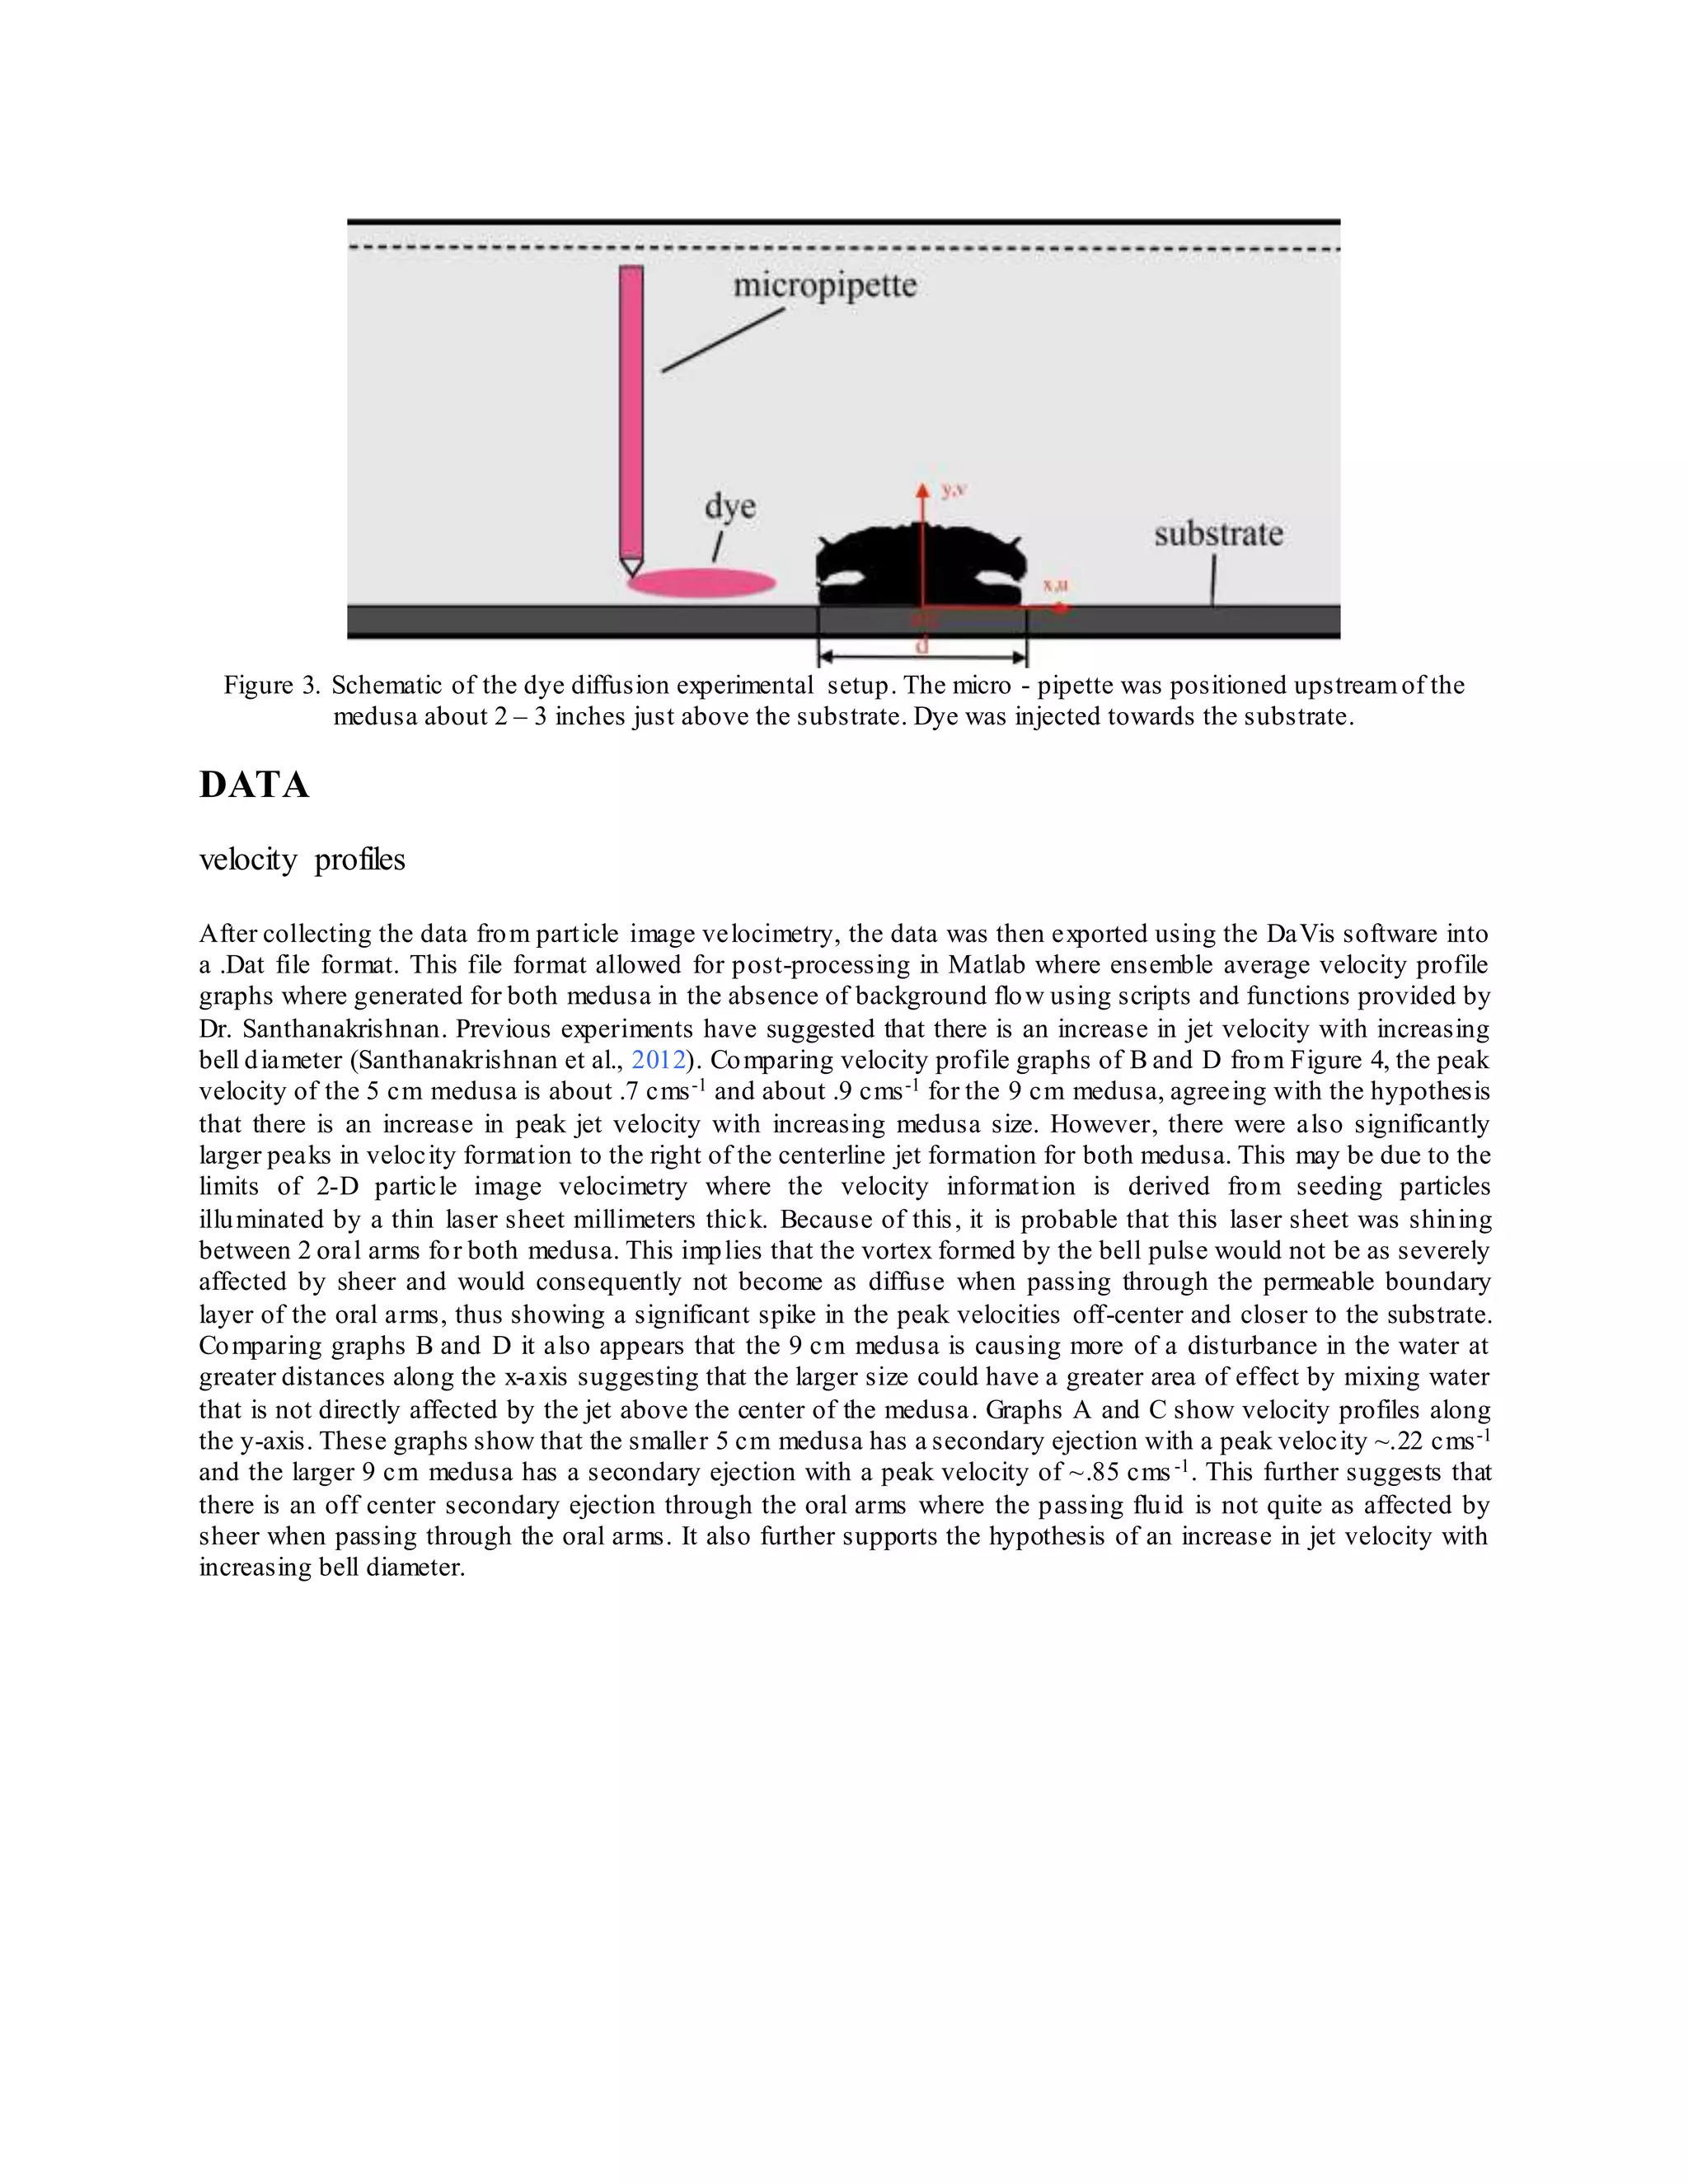
approximately 30 minutes for the medusa to settle in the tank, dye was injected approximately 3 inches away from
the medusa towards the substrate as shown in Figure 3. The dye was injected by hand,using a 10 mL micropipette.](https://image.slidesharecdn.com/6e001cd8-d780-4a12-96f7-22d3446a9646-151220052013/75/NCUR-PAPER_FINAL-DRAFT-3-2048.jpg)