The NISAR mission will use radar imaging to measure changes in groundwater levels and land subsidence globally. Over-pumping of groundwater can cause the land surface to sink as aquifers compact. This subsidence damages infrastructure and aquifer systems. NISAR's radar can map subtle changes to the land surface from space with millimeter accuracy to monitor groundwater usage and recharge. This will help manage water resources worldwide as climate change and population growth increase stress on freshwater supplies.
NISAR
Drought and Groundwater Withdrawal
NASA
National Aeronautics and Space Administration
NASA-ISRO Synthetic Aperture Radar (NISAR)
By
Dr. Pankaj Dhussa
The Intertidal and Kelp Forests - Pacific CoastTom Moritz
The document discusses coastal ecosystems like intertidal zones, kelp forests, and the impacts of human activity. It provides background on coastal ecosystems and their importance as a food source and for tourism. Intertidal zones and kelp forests are described, including different zones and species found. The impacts of the fur trade nearly driving sea otters extinct are summarized, and how this disrupted the coastal ecosystem by allowing sea urchin populations to explode unchecked by sea otter predation. Sea otters are now described as a keystone species that help balance coastal ecosystem dynamics.
NISAR
Oil, Gas, and Water Underground Reservoirs
NASA
National Aeronautics and Space Administration
NASA-ISRO Synthetic Aperture Radar (NISAR)
By
Dr. Pankaj Dhussa
NISAR
Ice Sheets, Glaciers, and Oceans
NASA
National Aeronautics and Space Administration
NASA-ISRO Synthetic Aperture Radar (NISAR)
By
Dr. Pankaj Dhussa
According to a report by the Pacific Institute, sea level rise of 1-1.4 meters by 2100 could cause $100 billion in property damage along California's coast, flooding areas where over 450,000 people live. Waves play a major role in coastal erosion, which is exacerbated by sea level rise and threatens over 30 million Californians. Oceanographer Tim Janssen studies wave modeling to better understand wave behavior and its effects on coastal erosion, though predictions are challenging given the complex physics involved. Improving such predictions will help inform policies around protecting California's coastlines from damage and flooding due to sea level rise and erosion.
LindseyHamilton_NocturnalSurfScoterDistributionPoster_2015Lindsey Hamilton
1) The study tracked surf scoters in the Salish Sea using satellite transmitters to determine their nocturnal habitat use and movements between diurnal and nocturnal areas.
2) It found that surf scoters traveled farther on average in the South Puget Sound region and moved offshore at night to deeper waters compared to their diurnal foraging areas nearshore.
3) Logistic regression modeling revealed that minimum distance to shore, water depth, tidal current, and vessel traffic density were significant predictors of surf scoter nocturnal habitat preference, with preferences for deeper, more offshore areas with less vessel traffic.
1) Radar observations from the NISAR satellite mission can help monitor volcanoes by measuring surface deformation caused by underground magma movement, which can indicate future eruptions.
2) Volcanic eruptions produce hazards like ash falls, lava and mudflows that can damage property and infrastructure as well as gases that harm health and the environment.
3) The NISAR mission will image nearly the entire land and ice masses of Earth with radar every 4-6 days at 5-10 meter resolution to track subtle changes and provide data for resource management and disaster response within hours.
The NASA-ISRO SAR Mission (NISAR) will provide flood forecasting capabilities through the use of synthetic aperture radar (SAR) to measure changing water levels in flooded areas. NISAR will augment sparse networks of stream gauges by providing continuous maps of water level changes from SAR images. These maps can indicate how much water levels have increased or decreased between observations days or weeks apart. Flood forecasting from NISAR data can help save lives and property by informing communities of incoming floods and their expected severity.
The passage describes characteristics of tsunamis and how they contribute to destructive power, as well as the operation of the Pacific Tsunami Warning System. It then discusses three factors that can cause rivers to flood: climate, characteristics of the river basin, and human activities. Climate includes differences between wet and dry seasons that can lead to flooding after drought. River basin characteristics like size and slope influence how quickly water reaches the river. Human activities such as urbanization, deforestation, and land management practices increase surface runoff and flood risk.
Remote Sensing And GIS Application In Wetland MappingSwetha A
This document discusses remote sensing and GIS applications for wetland mapping. It begins by defining wetlands and describing some of the largest in the world. The three main criteria for identifying wetlands - hydric soils, hydrophytic vegetation, and hydrology - are introduced. Remote sensing data, including IRS P6 LISS III imagery, is used to map wetlands in Karnataka, India. Indices like NDWI, MNDWI, NDVI, and NDPI are calculated from the multi-spectral bands to identify wetland areas. GIS is then used to analyze and interpret the remote sensing data spatially and temporally. Final maps are produced showing the distribution and types of wetlands identified in India and specifically
The document summarizes the formation and types of coastlines. It defines a coastline as the boundary where land meets the sea. Coastlines are formed through the erosion and deposition actions of waves, tides, currents and other marine processes on sediments and rocks. Major coastal landforms include beaches formed from sediment deposition, as well as erosional features like sea cliffs, wave-cut platforms, sea stacks and sea arches formed through wave erosion. Coastlines are classified based on their dominant formation processes into primary coastlines formed through terrestrial processes and secondary coastlines formed through marine erosion and deposition.
The document summarizes potential environmental impacts of a proposed silica sand mine near the Minnesota River, including:
1) Nearby wetlands and the river could be affected by sediment runoff from removing soil overburden and excavating sand. This could degrade water quality and wildlife habitat.
2) Changes in local hydrology from constructing berms and lowering the water table could alter wetland conditions, harming plant and animal species.
3) More analysis is needed to ensure impacts comply with laws protecting wetlands and water resources. Mitigation may be required for any significant environmental effects.
The document discusses natural hazards in the Philippines under three sections: natural processes and hazards, hydrometeorological phenomena and hazards, and marine and coastal processes and hazards. It describes various natural hazards like earthquakes, volcanic eruptions, landslides, tsunamis, tropical cyclones, floods, erosion, submersion and saltwater intrusion. It provides details on government agencies that monitor these hazards and measures taken to mitigate risks like hazard maps, storm warning signals, flood prevention projects. Overall, the document comprehensively covers natural hazards prevalent in the Philippines and efforts to build resilience against disasters.
The document discusses marine defaunation, or the loss of animal life in the oceans caused by human activity. Some key points:
- Marine defaunation began much later than terrestrial defaunation, only intensifying in the last century with industrial fishing and coastal development. However, human impacts on marine wildlife are increasing rapidly.
- Few marine animal species have gone completely extinct compared to land animals, but populations of many species have declined greatly. Local extinctions where species disappear from parts of their range have been common.
- While extinction rates remain lower than on land currently, marine extinction rates may be approaching a transition point similar to what occurred during the industrial revolution on land, with rates set
Buzzards Bay Salt Marshes: Vulnerability and Adaptation PotentialJonahGuerin1
The document summarizes research on the vulnerability and adaptation potential of salt marshes in Buzzards Bay. Monitoring of 12 salt marsh sites from 2001-2019 found that marsh area was lost at all sites, ranging from 1-20% loss depending on the site. The main stressors impacting the marshes are low elevations making them susceptible to sea level rise and structures obstructing natural tidal flow. Most sites have potential to adapt to sea level rise through landward migration, but some sites face barriers. Analysis of plant communities, elevations, tidal restrictions, nitrogen levels and degree of unvegetation found variation in resilience across the 12 sites.
Pecological implications of summer fog decline in the coast redwood6D45520z848622K444
This document summarizes a study on summer fog decline along the Pacific coast of California and its implications for coast redwood and other ecosystems. The key points are:
1) The study presents a novel 58-year record (1951-2008) of summer fog frequency in northern California based on hourly cloud ceiling height measurements, showing a 33% reduction in fog since the early 20th century.
2) Summer fog frequency is found to correlate strongly with the wind-driven upwelling system of the California Current and the Pacific Decadal Oscillation ocean temperature pattern.
3) Tree physiological data suggests that reduced summer fog frequency and increased evaporative demand may stress coast redwoods and other west coast ecosystems.
NASA Overcoming the 50-Year Ban History of the Ban on Commercial Supersonic F...Dr. Pankaj Dhussa
NASA
National Aeronautics and Space Administration
NASA Overcoming the 50-Year Ban
History of the Ban on Commercial Supersonic Flight Over Land
By
Dr. Pankaj Dhussa
More Related Content
Similar to NISAR NASA-ISRO Synthetic Aperture Radar (NISAR) Coastal Land Loss
NISAR
Oil, Gas, and Water Underground Reservoirs
NASA
National Aeronautics and Space Administration
NASA-ISRO Synthetic Aperture Radar (NISAR)
By
Dr. Pankaj Dhussa
NISAR
Ice Sheets, Glaciers, and Oceans
NASA
National Aeronautics and Space Administration
NASA-ISRO Synthetic Aperture Radar (NISAR)
By
Dr. Pankaj Dhussa
According to a report by the Pacific Institute, sea level rise of 1-1.4 meters by 2100 could cause $100 billion in property damage along California's coast, flooding areas where over 450,000 people live. Waves play a major role in coastal erosion, which is exacerbated by sea level rise and threatens over 30 million Californians. Oceanographer Tim Janssen studies wave modeling to better understand wave behavior and its effects on coastal erosion, though predictions are challenging given the complex physics involved. Improving such predictions will help inform policies around protecting California's coastlines from damage and flooding due to sea level rise and erosion.
LindseyHamilton_NocturnalSurfScoterDistributionPoster_2015Lindsey Hamilton
1) The study tracked surf scoters in the Salish Sea using satellite transmitters to determine their nocturnal habitat use and movements between diurnal and nocturnal areas.
2) It found that surf scoters traveled farther on average in the South Puget Sound region and moved offshore at night to deeper waters compared to their diurnal foraging areas nearshore.
3) Logistic regression modeling revealed that minimum distance to shore, water depth, tidal current, and vessel traffic density were significant predictors of surf scoter nocturnal habitat preference, with preferences for deeper, more offshore areas with less vessel traffic.
1) Radar observations from the NISAR satellite mission can help monitor volcanoes by measuring surface deformation caused by underground magma movement, which can indicate future eruptions.
2) Volcanic eruptions produce hazards like ash falls, lava and mudflows that can damage property and infrastructure as well as gases that harm health and the environment.
3) The NISAR mission will image nearly the entire land and ice masses of Earth with radar every 4-6 days at 5-10 meter resolution to track subtle changes and provide data for resource management and disaster response within hours.
The NASA-ISRO SAR Mission (NISAR) will provide flood forecasting capabilities through the use of synthetic aperture radar (SAR) to measure changing water levels in flooded areas. NISAR will augment sparse networks of stream gauges by providing continuous maps of water level changes from SAR images. These maps can indicate how much water levels have increased or decreased between observations days or weeks apart. Flood forecasting from NISAR data can help save lives and property by informing communities of incoming floods and their expected severity.
The passage describes characteristics of tsunamis and how they contribute to destructive power, as well as the operation of the Pacific Tsunami Warning System. It then discusses three factors that can cause rivers to flood: climate, characteristics of the river basin, and human activities. Climate includes differences between wet and dry seasons that can lead to flooding after drought. River basin characteristics like size and slope influence how quickly water reaches the river. Human activities such as urbanization, deforestation, and land management practices increase surface runoff and flood risk.
Remote Sensing And GIS Application In Wetland MappingSwetha A
This document discusses remote sensing and GIS applications for wetland mapping. It begins by defining wetlands and describing some of the largest in the world. The three main criteria for identifying wetlands - hydric soils, hydrophytic vegetation, and hydrology - are introduced. Remote sensing data, including IRS P6 LISS III imagery, is used to map wetlands in Karnataka, India. Indices like NDWI, MNDWI, NDVI, and NDPI are calculated from the multi-spectral bands to identify wetland areas. GIS is then used to analyze and interpret the remote sensing data spatially and temporally. Final maps are produced showing the distribution and types of wetlands identified in India and specifically
The document summarizes the formation and types of coastlines. It defines a coastline as the boundary where land meets the sea. Coastlines are formed through the erosion and deposition actions of waves, tides, currents and other marine processes on sediments and rocks. Major coastal landforms include beaches formed from sediment deposition, as well as erosional features like sea cliffs, wave-cut platforms, sea stacks and sea arches formed through wave erosion. Coastlines are classified based on their dominant formation processes into primary coastlines formed through terrestrial processes and secondary coastlines formed through marine erosion and deposition.
The document summarizes potential environmental impacts of a proposed silica sand mine near the Minnesota River, including:
1) Nearby wetlands and the river could be affected by sediment runoff from removing soil overburden and excavating sand. This could degrade water quality and wildlife habitat.
2) Changes in local hydrology from constructing berms and lowering the water table could alter wetland conditions, harming plant and animal species.
3) More analysis is needed to ensure impacts comply with laws protecting wetlands and water resources. Mitigation may be required for any significant environmental effects.
The document discusses natural hazards in the Philippines under three sections: natural processes and hazards, hydrometeorological phenomena and hazards, and marine and coastal processes and hazards. It describes various natural hazards like earthquakes, volcanic eruptions, landslides, tsunamis, tropical cyclones, floods, erosion, submersion and saltwater intrusion. It provides details on government agencies that monitor these hazards and measures taken to mitigate risks like hazard maps, storm warning signals, flood prevention projects. Overall, the document comprehensively covers natural hazards prevalent in the Philippines and efforts to build resilience against disasters.
The document discusses marine defaunation, or the loss of animal life in the oceans caused by human activity. Some key points:
- Marine defaunation began much later than terrestrial defaunation, only intensifying in the last century with industrial fishing and coastal development. However, human impacts on marine wildlife are increasing rapidly.
- Few marine animal species have gone completely extinct compared to land animals, but populations of many species have declined greatly. Local extinctions where species disappear from parts of their range have been common.
- While extinction rates remain lower than on land currently, marine extinction rates may be approaching a transition point similar to what occurred during the industrial revolution on land, with rates set
Buzzards Bay Salt Marshes: Vulnerability and Adaptation PotentialJonahGuerin1
The document summarizes research on the vulnerability and adaptation potential of salt marshes in Buzzards Bay. Monitoring of 12 salt marsh sites from 2001-2019 found that marsh area was lost at all sites, ranging from 1-20% loss depending on the site. The main stressors impacting the marshes are low elevations making them susceptible to sea level rise and structures obstructing natural tidal flow. Most sites have potential to adapt to sea level rise through landward migration, but some sites face barriers. Analysis of plant communities, elevations, tidal restrictions, nitrogen levels and degree of unvegetation found variation in resilience across the 12 sites.
Pecological implications of summer fog decline in the coast redwood6D45520z848622K444
This document summarizes a study on summer fog decline along the Pacific coast of California and its implications for coast redwood and other ecosystems. The key points are:
1) The study presents a novel 58-year record (1951-2008) of summer fog frequency in northern California based on hourly cloud ceiling height measurements, showing a 33% reduction in fog since the early 20th century.
2) Summer fog frequency is found to correlate strongly with the wind-driven upwelling system of the California Current and the Pacific Decadal Oscillation ocean temperature pattern.
3) Tree physiological data suggests that reduced summer fog frequency and increased evaporative demand may stress coast redwoods and other west coast ecosystems.
Similar to NISAR NASA-ISRO Synthetic Aperture Radar (NISAR) Coastal Land Loss (20)
NASA Overcoming the 50-Year Ban History of the Ban on Commercial Supersonic F...Dr. Pankaj Dhussa
NASA
National Aeronautics and Space Administration
NASA Overcoming the 50-Year Ban
History of the Ban on Commercial Supersonic Flight Over Land
By
Dr. Pankaj Dhussa
NASA Carbon Fiber Composites (CFC) Recycling Technology Enabled by the TuFF T...Dr. Pankaj Dhussa
NASA
National Aeronautics and Space Administration
NASA Carbon Fiber Composites (CFC) Recycling
Technology Enabled by the TuFF Technology
By
Dr. Pankaj Dhussa
NASA Urban Air Mobility Fatigue Prediction Aaron Crawford – NASA ULI Innovati...Dr. Pankaj Dhussa
NASA
National Aeronautics and Space Administration
NASA Urban Air Mobility Fatigue Prediction
Aaron Crawford – NASA ULI Innovative Manufacturing, Operation, and Certification of Advanced
By
Dr. Pankaj Dhussa
NASA
National Aeronautics and Space Administration
NASA Multiscale Analysis Tool (NASMAT)
Robust, Integrated, Physics-based, Non-linear, Variable Fidelity Modeling of
Multi-phased Materials and Structures
By
Dr. Pankaj Dhussa
NASA Aviary Open-source software tool for optimizing next-generation aircraft...Dr. Pankaj Dhussa
NASA
National Aeronautics and Space Administration
NASA Aviary
Open-source software tool for optimizing next-generation aircraft designs
By
Dr. Pankaj Dhussa
NASA Aircraft Certification by Analysis (CbA) 20-year Vision for Virtual Flig...Dr. Pankaj Dhussa
NASA
National Aeronautics and Space Administration
NASA Aircraft Certification by Analysis (CbA)
20-year Vision for Virtual Flight Testing
By
Dr. Pankaj Dhussa
NASA DECO CAS Research into a New Operating Mode for Digitally Enabled Cooper...Dr. Pankaj Dhussa
NASA
National Aeronautics and Space Administration
NASA DECO
CAS Research into a New Operating Mode for Digitally Enabled Cooperative Operations (DECO)
By
Dr. Pankaj Dhussa
NASA Advanced Exploration of Reliable Operation at low Altitudes: meteorology...Dr. Pankaj Dhussa
NASA
National Aeronautics and Space Administration
NASA Advanced Exploration of Reliable Operation at low Altitudes: meteorology, Simulation,
and Technology (AEROcAST)
By
Dr. Pankaj Dhussa
NASA Self-Adaptation of Loosely Coupled Systems across a System of Small Uncr...Dr. Pankaj Dhussa
NASA
National Aeronautics and Space Administration
NASA Self-Adaptation of Loosely Coupled Systems across a
System of Small Uncrewed Aerial Vehicles
By
Dr. Pankaj Dhussa
NASA RealWindDroneSim (RWDS) Enhancing Simulation Fidelity of small Uncrewed ...Dr. Pankaj Dhussa
NASA
National Aeronautics and Space Administration
NASA RealWindDroneSim (RWDS)
Enhancing Simulation Fidelity of small Uncrewed Aerial Vehicles in Windy Conditions
By
Dr. Pankaj Dhussa
NASA ARMD Test Data Portal (ATDP) Agile Development Method Introduction of an...Dr. Pankaj Dhussa
NASA
National Aeronautics and Space Administration
NASA ARMD Test Data Portal (ATDP) Agile Development Method
Introduction of an Agile Systems Engineering Process to the
NASA Armstrong Flight Research Center
By
Dr. Pankaj Dhussa
NASA ARMD Test Data Portal (ATDP) he ARMD Test Data Portal (ATDP) is a secure...Dr. Pankaj Dhussa
NASA
National Aeronautics and Space Administration
NASA The ARMD Test Data Portal (ATDP) is a secure data archive that allows NASA personnel to remotely upload and register ARMD test data, as well as to quickly search, access, extract, time slice, and download test data for further analysis.
Associated metadata [ATDP Metadata Specification (AMS)] is compliant with government and industry metadata standards and requirements, and provides capabilities for cataloging, search, and data discovery.
By
Dr. Pankaj Dhussa
Monitoring and Managing Anomaly Detection on OpenShift.pdfTosin Akinosho
Monitoring and Managing Anomaly Detection on OpenShift
Overview
Dive into the world of anomaly detection on edge devices with our comprehensive hands-on tutorial. This SlideShare presentation will guide you through the entire process, from data collection and model training to edge deployment and real-time monitoring. Perfect for those looking to implement robust anomaly detection systems on resource-constrained IoT/edge devices.
Key Topics Covered
1. Introduction to Anomaly Detection
- Understand the fundamentals of anomaly detection and its importance in identifying unusual behavior or failures in systems.
2. Understanding Edge (IoT)
- Learn about edge computing and IoT, and how they enable real-time data processing and decision-making at the source.
3. What is ArgoCD?
- Discover ArgoCD, a declarative, GitOps continuous delivery tool for Kubernetes, and its role in deploying applications on edge devices.
4. Deployment Using ArgoCD for Edge Devices
- Step-by-step guide on deploying anomaly detection models on edge devices using ArgoCD.
5. Introduction to Apache Kafka and S3
- Explore Apache Kafka for real-time data streaming and Amazon S3 for scalable storage solutions.
6. Viewing Kafka Messages in the Data Lake
- Learn how to view and analyze Kafka messages stored in a data lake for better insights.
7. What is Prometheus?
- Get to know Prometheus, an open-source monitoring and alerting toolkit, and its application in monitoring edge devices.
8. Monitoring Application Metrics with Prometheus
- Detailed instructions on setting up Prometheus to monitor the performance and health of your anomaly detection system.
9. What is Camel K?
- Introduction to Camel K, a lightweight integration framework built on Apache Camel, designed for Kubernetes.
10. Configuring Camel K Integrations for Data Pipelines
- Learn how to configure Camel K for seamless data pipeline integrations in your anomaly detection workflow.
11. What is a Jupyter Notebook?
- Overview of Jupyter Notebooks, an open-source web application for creating and sharing documents with live code, equations, visualizations, and narrative text.
12. Jupyter Notebooks with Code Examples
- Hands-on examples and code snippets in Jupyter Notebooks to help you implement and test anomaly detection models.
5th LF Energy Power Grid Model Meet-up SlidesDanBrown980551
5th Power Grid Model Meet-up
It is with great pleasure that we extend to you an invitation to the 5th Power Grid Model Meet-up, scheduled for 6th June 2024. This event will adopt a hybrid format, allowing participants to join us either through an online Mircosoft Teams session or in person at TU/e located at Den Dolech 2, Eindhoven, Netherlands. The meet-up will be hosted by Eindhoven University of Technology (TU/e), a research university specializing in engineering science & technology.
Power Grid Model
The global energy transition is placing new and unprecedented demands on Distribution System Operators (DSOs). Alongside upgrades to grid capacity, processes such as digitization, capacity optimization, and congestion management are becoming vital for delivering reliable services.
Power Grid Model is an open source project from Linux Foundation Energy and provides a calculation engine that is increasingly essential for DSOs. It offers a standards-based foundation enabling real-time power systems analysis, simulations of electrical power grids, and sophisticated what-if analysis. In addition, it enables in-depth studies and analysis of the electrical power grid’s behavior and performance. This comprehensive model incorporates essential factors such as power generation capacity, electrical losses, voltage levels, power flows, and system stability.
Power Grid Model is currently being applied in a wide variety of use cases, including grid planning, expansion, reliability, and congestion studies. It can also help in analyzing the impact of renewable energy integration, assessing the effects of disturbances or faults, and developing strategies for grid control and optimization.
What to expect
For the upcoming meetup we are organizing, we have an exciting lineup of activities planned:
-Insightful presentations covering two practical applications of the Power Grid Model.
-An update on the latest advancements in Power Grid -Model technology during the first and second quarters of 2024.
-An interactive brainstorming session to discuss and propose new feature requests.
-An opportunity to connect with fellow Power Grid Model enthusiasts and users.
Introduction of Cybersecurity with OSS at Code Europe 2024Hiroshi SHIBATA
I develop the Ruby programming language, RubyGems, and Bundler, which are package managers for Ruby. Today, I will introduce how to enhance the security of your application using open-source software (OSS) examples from Ruby and RubyGems.
The first topic is CVE (Common Vulnerabilities and Exposures). I have published CVEs many times. But what exactly is a CVE? I'll provide a basic understanding of CVEs and explain how to detect and handle vulnerabilities in OSS.
Next, let's discuss package managers. Package managers play a critical role in the OSS ecosystem. I'll explain how to manage library dependencies in your application.
I'll share insights into how the Ruby and RubyGems core team works to keep our ecosystem safe. By the end of this talk, you'll have a better understanding of how to safeguard your code.
A Comprehensive Guide to DeFi Development Services in 2024Intelisync
DeFi represents a paradigm shift in the financial industry. Instead of relying on traditional, centralized institutions like banks, DeFi leverages blockchain technology to create a decentralized network of financial services. This means that financial transactions can occur directly between parties, without intermediaries, using smart contracts on platforms like Ethereum.
In 2024, we are witnessing an explosion of new DeFi projects and protocols, each pushing the boundaries of what’s possible in finance.
In summary, DeFi in 2024 is not just a trend; it’s a revolution that democratizes finance, enhances security and transparency, and fosters continuous innovation. As we proceed through this presentation, we'll explore the various components and services of DeFi in detail, shedding light on how they are transforming the financial landscape.
At Intelisync, we specialize in providing comprehensive DeFi development services tailored to meet the unique needs of our clients. From smart contract development to dApp creation and security audits, we ensure that your DeFi project is built with innovation, security, and scalability in mind. Trust Intelisync to guide you through the intricate landscape of decentralized finance and unlock the full potential of blockchain technology.
Ready to take your DeFi project to the next level? Partner with Intelisync for expert DeFi development services today!
In the rapidly evolving landscape of technologies, XML continues to play a vital role in structuring, storing, and transporting data across diverse systems. The recent advancements in artificial intelligence (AI) present new methodologies for enhancing XML development workflows, introducing efficiency, automation, and intelligent capabilities. This presentation will outline the scope and perspective of utilizing AI in XML development. The potential benefits and the possible pitfalls will be highlighted, providing a balanced view of the subject.
We will explore the capabilities of AI in understanding XML markup languages and autonomously creating structured XML content. Additionally, we will examine the capacity of AI to enrich plain text with appropriate XML markup. Practical examples and methodological guidelines will be provided to elucidate how AI can be effectively prompted to interpret and generate accurate XML markup.
Further emphasis will be placed on the role of AI in developing XSLT, or schemas such as XSD and Schematron. We will address the techniques and strategies adopted to create prompts for generating code, explaining code, or refactoring the code, and the results achieved.
The discussion will extend to how AI can be used to transform XML content. In particular, the focus will be on the use of AI XPath extension functions in XSLT, Schematron, Schematron Quick Fixes, or for XML content refactoring.
The presentation aims to deliver a comprehensive overview of AI usage in XML development, providing attendees with the necessary knowledge to make informed decisions. Whether you’re at the early stages of adopting AI or considering integrating it in advanced XML development, this presentation will cover all levels of expertise.
By highlighting the potential advantages and challenges of integrating AI with XML development tools and languages, the presentation seeks to inspire thoughtful conversation around the future of XML development. We’ll not only delve into the technical aspects of AI-powered XML development but also discuss practical implications and possible future directions.
Letter and Document Automation for Bonterra Impact Management (fka Social Sol...Jeffrey Haguewood
Sidekick Solutions uses Bonterra Impact Management (fka Social Solutions Apricot) and automation solutions to integrate data for business workflows.
We believe integration and automation are essential to user experience and the promise of efficient work through technology. Automation is the critical ingredient to realizing that full vision. We develop integration products and services for Bonterra Case Management software to support the deployment of automations for a variety of use cases.
This video focuses on automated letter generation for Bonterra Impact Management using Google Workspace or Microsoft 365.
Interested in deploying letter generation automations for Bonterra Impact Management? Contact us at sales@sidekicksolutionsllc.com to discuss next steps.
Have you ever been confused by the myriad of choices offered by AWS for hosting a website or an API?
Lambda, Elastic Beanstalk, Lightsail, Amplify, S3 (and more!) can each host websites + APIs. But which one should we choose?
Which one is cheapest? Which one is fastest? Which one will scale to meet our needs?
Join me in this session as we dive into each AWS hosting service to determine which one is best for your scenario and explain why!
Programming Foundation Models with DSPy - Meetup SlidesZilliz
Prompting language models is hard, while programming language models is easy. In this talk, I will discuss the state-of-the-art framework DSPy for programming foundation models with its powerful optimizers and runtime constraint system.
GraphRAG for Life Science to increase LLM accuracyTomaz Bratanic
GraphRAG for life science domain, where you retriever information from biomedical knowledge graphs using LLMs to increase the accuracy and performance of generated answers
Let's Integrate MuleSoft RPA, COMPOSER, APM with AWS IDP along with Slackshyamraj55
Discover the seamless integration of RPA (Robotic Process Automation), COMPOSER, and APM with AWS IDP enhanced with Slack notifications. Explore how these technologies converge to streamline workflows, optimize performance, and ensure secure access, all while leveraging the power of AWS IDP and real-time communication via Slack notifications.
Trusted Execution Environment for Decentralized Process MiningLucaBarbaro3
Presentation of the paper "Trusted Execution Environment for Decentralized Process Mining" given during the CAiSE 2024 Conference in Cyprus on June 7, 2024.
This presentation provides valuable insights into effective cost-saving techniques on AWS. Learn how to optimize your AWS resources by rightsizing, increasing elasticity, picking the right storage class, and choosing the best pricing model. Additionally, discover essential governance mechanisms to ensure continuous cost efficiency. Whether you are new to AWS or an experienced user, this presentation provides clear and practical tips to help you reduce your cloud costs and get the most out of your budget.
Ocean lotus Threat actors project by John Sitima 2024 (1).pptxSitimaJohn
Ocean Lotus cyber threat actors represent a sophisticated, persistent, and politically motivated group that poses a significant risk to organizations and individuals in the Southeast Asian region. Their continuous evolution and adaptability underscore the need for robust cybersecurity measures and international cooperation to identify and mitigate the threats posed by such advanced persistent threat groups.
Fueling AI with Great Data with Airbyte WebinarZilliz
This talk will focus on how to collect data from a variety of sources, leveraging this data for RAG and other GenAI use cases, and finally charting your course to productionalization.
NISAR NASA-ISRO Synthetic Aperture Radar (NISAR) Coastal Land Loss
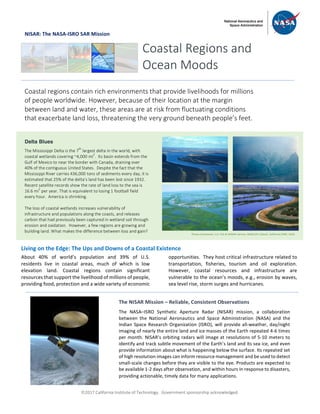
1. ã2017 California Institute of Technology. Government sponsorship acknowledged.
NISAR: The NASA-ISRO SAR Mission
Living on the Edge: The Ups and Downs of a Coastal Existence
About 40% of world’s population and 39% of U.S.
residents live in coastal areas, much of which is low
elevation land. Coastal regions contain significant
resources that support the livelihood of millions of people,
providing food, protection and a wide variety of economic
opportunities. They host critical infrastructure related to
transportation, fisheries, tourism and oil exploration.
However, coastal resources and infrastructure are
vulnerable to the ocean’s moods, e.g., erosion by waves,
sea level rise, storm surges and hurricanes.
Coastal Regions and
Ocean Moods
Coastal regions contain rich environments that provide livelihoods for millions
of people worldwide. However, because of their location at the margin
between land and water, these areas are at risk from fluctuating conditions
that exacerbate land loss, threatening the very ground beneath people’s feet.
Delta Blues
The Mississippi Delta is the 7
th
largest delta in the world, with
coastal wetlands covering ~4,000 mi
2
. Its basin extends from the
Gulf of Mexico to near the border with Canada, draining over
40% of the contiguous United States. Despite the fact that the
Mississippi River carries 436,000 tons of sediments every day, it is
estimated that 25% of the delta’s land has been lost since 1932.
Recent satellite records show the rate of land loss to the sea is
16.6 mi
2
per year. That is equivalent to losing 1 football field
every hour. America is shrinking.
The loss of coastal wetlands increases vulnerability of
infrastructure and populations along the coasts, and releases
carbon that had previously been captured in wetland soil through
erosion and oxidation. However, a few regions are growing and
building land. What makes the difference between loss and gain?
The NISAR Mission – Reliable, Consistent Observations
The NASA–ISRO Synthetic Aperture Radar (NISAR) mission, a collaboration
between the National Aeronautics and Space Administration (NASA) and the
Indian Space Research Organization (ISRO), will provide all-weather, day/night
imaging of nearly the entire land and ice masses of the Earth repeated 4-6 times
per month. NISAR’s orbiting radars will image at resolutions of 5-10 meters to
identify and track subtle movement of the Earth’s land and its sea ice, and even
provide information about what is happening below the surface. Its repeated set
of high resolution images can inform resource management and be used to detect
small-scale changes before they are visible to the eye. Products are expected to
be available 1-2 days after observation, and within hours in response to disasters,
providing actionable, timely data for many applications.
Photos (clockwise): U.S. Fish & Wildlife Service, NASA/JPL-Caltech, California DWR, USGS
2. ã2017 California Institute of Technology. Government sponsorship acknowledged.
Cont. from front page
Land loss in low elevation coastal regions is driven by a
complex array of factors. In the wetlands, wave-induced
erosion is often tied to the health of the wetland
vegetation, whose roots act to hold the soil together. In
addition to erosion from physical wave action that is
increased during storm surges, the presence of toxins or
water of the wrong salinity or temperature can stress the
plants, causing them to have less robust roots. The
erosion is exacerbated by a lack of the influx of sediment
that would help rebuild the land, and this loss significantly
reduces the deposition of new soil to offset the loss to the
ocean. The sediment carried by the river is either
captured upstream in dams or prevented from entering
the wetlands by levees intended to prevent storm surge
from reaching population centers and economic assets
along the river feeding the delta.
In the end, however, the wetland loss leads to deeper
inland intrusion of the storm waters, a positive feedback
loop whereby the wetlands recede, leaving coastal cities
at greater risk from high winds and water during storms
that blow in from the ocean.
It is encouraging to learn that in a few areas coastal deltas
are actually expanding rather than losing ground.
Understanding the difference between land loss and land
gain may be critical to saving the deltas, because this
information informs how to reverse the land loss in the
shrinking deltas.
With coastal populations growing at rates nearing 10%
every decade and the concomitant increasing demand for
ocean resources, it becomes critical to understand the
processes by which coastal wetlands are resilient or
become vulnerable to the ocean’s mood. Satellite imaging
is the most efficient and reliable method to monitor the
status of low elevation coastal regions given their large
size and global geographic distribution. In particular, the
oft-present layer of clouds covering these areas requires
radar imaging, which pierces through clouds, providing an
on-demand access to imagery of coastal areas. Because
NISAR is a NASA instrument, its data will be available free
of charge, so that it can be used to reduce risk to life and
property throughout the United States.
National Aeronautics and Space Administration For more information, visit http://nisar.jpl.nasa.gov/applications
Jet Propulsion Laboratory / California Institute of Technology / Pasadena, California / www.jpl.nasa.gov
In wetlands, the health of the vegetation is often an
indicator of the area’s resilience to storm surge, and
hence to its ability to protect inland populations.
Vegetation serves to decrease the energy of the
incoming waves of a storm surge and to lower wind
speed through increased resistance to near-surface
flow. Radar remote sensing can be used to determine
the type and status of vegetation, showing the spread
or declines of species in response to changes in water
depth, salinity, and temperature. Earth observations
from space using the NISAR microwave radar will
enable reliable and repeated measurements to be
made of the coastal and inland large water bodies of
the United States, informing land managers of where
and how to implement coastal restoration projects.
Right: Radar-derived map of the Mississippi River
indicating vegetation canopy height.
Radar Imaging of Coastal Wetlands