This document summarizes a study that estimated the seasonal abundance and distribution of cetaceans off the coast of Southern California using data from 16 quarterly ship-based surveys between 2004-2008. The surveys covered an area of 238,494 km2 from nearshore waters to 700 km offshore. Abundance estimates were determined for the 11 most commonly encountered species based on 693 encounters, and were calculated separately for summer-fall and winter-spring periods as well as for shallow (<2000.5 m) and deep (≥2000.5 m) waters. Density estimates showed seasonal variations by depth for some species, with the highest densities generally occurring in summer-fall in shallow waters for species like blue whales and common dolphins.

![200 Fishery Bulletin 112(2–3)
lines were surveyed partially during 2 winter cruises;
however, only a few sections of these lines were sur-
veyed with acceptable sea conditions, and therefore
these data also have been excluded from the analyses
and results in this study.
Three vessels were used for the line-transect sur-
veys: the RV Roger Revelle (2 surveys) and RV New
Horizon (8 surveys) of the Scripps Institution of Ocean-
ography, University of California, San Diego, and the
NOAA Ship David Starr Jordan (6 surveys) (Table 1).
Survey speeds ranged from 18.5 to 22.2 km/h. Height
of the observer platform varied by vessel from 8.1 to
13.2 m, raising the possibility that there would be a
vessel or a vessel-season bias. To test these biases, we
ran single-factor analyses of variance (ANOVAs) to de-
termine whether visual observers made initial sight-
ings at significantly different distances for each vessel
or vessel-season combination. Additionally, we ran tests
to determine whether the number of transect line ki-
lometers surveyed in good weather varied by season.
Scanning from directly abeam to 10° past the bow on
either side of the vessel, 2 observers recorded marine
mammal sightings. During 2 survey cruises, an addi-
tional person was available to record data and provide
relief for observers at meal times (Table 1). Recorded
sighting data included date, time, vessel latitude and
longitude, vessel true heading, distance of animal from
the vessel, sighting angle, θ, from the transect line, de-
COFI cruises from July 2004 to April 2008 (Table 1).
Covering an area of 238,494 km2, the study area con-
sisted of coastal, shelf, and pelagic oceanic habitat from
nearshore waters to waters 700 km offshore and up to
4600 m deep. Observers used unaided eye or handheld
7×50 reticle Fujinon2 binoculars (Fujifilm Corp., Tokyo)
to sight, identify, and estimate group sizes of cetaceans
and pinnipeds encountered along the transect lines be-
tween CalCOFI hydrographic sampling stations (Fig.
1). The Southern California hydrographic sampling
station sites are set along 6 parallel lines running
southwest to northeast, with lines increasing in length
from north to south (470–700 km). Stations occur ev-
ery 37 km in coastal and continental shelf waters and
every 74 km in offshore locations (Fig. 1). Occasionally,
transect lines were interrupted by naval activity or
adverse weather conditions; in these cases, the observ-
ers discontinued effort until their vessel adjusted to a
course that intersected with the interrupted transect
line. Transit lines that ran along the CalCOFI tran-
sect lines, as well as to and from the study area, were
surveyed opportunistically in addition to the primary
transect lines; however, these data were excluded from
the analyses and results described here. Five northern
2 Mention of trade names or commercial companies is for iden-
tification purposes only and does not imply endorsement by
the National Marine Fisheries Service, NOAA.
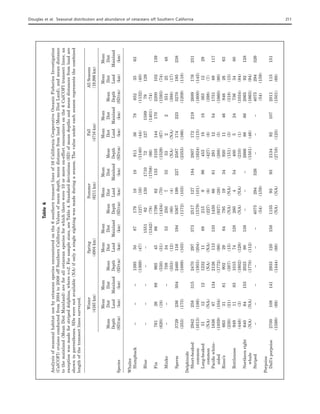
Table 1
Individual cruise identification, vessel, schedule (beginning, ending, season), line-transect-survey effort in kilome-
ters, and marine mammal visual observers of 16 California Cooperative Oceanic Fisheries Investigation (CalCOFI)
surveys conducted from July 2004 to April 2008. Height of observer platform on the 3 research vessels from which
these surveys were completed: 13.2 m on RV Roger Revelle [RR], 8.1 m on RV New Horizon [NH], and 11.0 m on
NOAA Ship David Starr Jordan [DSJ].
CalCOFI Survey Visual
cruise ID Vessel Begin End Season effort (km) observers1
0407JD DSJ 13-Jul-2004 28-Jul-2004 Summer 1543 RWB, ABD
0411RR RR 2-Nov-2004 19-Nov-2004 Fall 1295 ABD, AM, MS, SEY
0501NH NH 4-Jan-2005 20-Jan-2005 Winter 1006 DLC, EV
0504NH NH 15-Apr-2005 30-Apr-2005 Spring 1485 DLC, SMC
0507NH NH 1-Jul-2005 16-Jul-2005 Summer 1571 DLC, ABD, VI
0511NH NH 4-Nov-2005 20-Nov-2005 Fall 1104 DLC, SMC
0602JD DSJ 4-Feb-2006 25-Feb-2006 Winter 1144 GSC, SMC
0604NH NH 1-Apr-2006 17-Apr-2006 Spring 1624 DLC, ABD
0607NH NH 8-Jul-2006 24-Jul-2006 Summer 1595 DLC, AMH
0610RR RR 21-Oct-2006 5-Nov-2006 Fall 1208 ABD, AMH
0701JD DSJ 12-Jan-2007 2-Feb-2007 Winter 1080 GSC, ABD
0704JD DSJ 28-Mar-2007 18-Apr-2007 Spring 911 GSC, SMC
0707NH NH 28-Jun-2007 13-Jul-2007 Summer 1502 AMH, SEY
0711NH NH 02-Nov-2007 18-Nov-2007 Fall 1109 DLC, LJM
0801JD DSJ 07-Jan-2008 23-Jan-2008 Winter 935 DLC, GSC
0803JD DSJ 24-Mar-2008 09-Apr-2008 Spring 884 DLC, GSC
1Observers: R. W. Baird, D. L. Camacho, G. S. Campbell, S. M. Claussen, A. B. Douglas, A. M. Havron, V. Iriarte, A.
Miller, L. J. Morse, M. Smith, E. Vazquez, and S. E. Yin.](https://image.slidesharecdn.com/709ba35e-2a86-4e29-bd94-09ed08064918-150414215822-conversion-gate01/85/DouglasFishBull2014-3-320.jpg)
![Douglas et al. Seasonal distribution and abundance of cetaceans off Southern California 201
termined with an angle board (zero at bow, negative
to port, positive to starboard), sighting number, spe-
cies, group-size estimate (best, high, low), presence of
calves, general behavior of animals, photographs (if
taken), and comments pertaining to the sighting. Be-
cause of the surfacing behavior of cetaceans and lack
of visibility while submerged, animal counts were only
estimates, with the recorded “low” estimate being the
minimum number of individuals observed during the
sighting, the “high” estimate being the maximum, and
the “best” estimate was always recognized as the value
closest to the actual number of individuals. Group-
size estimates and species confirmation were generally
made by the lead observer but were agreed upon by all
observers present.
Transect lines were surveyed in “passing mode,”
which does not allow for any alteration of course for
closer examination of groups encountered. Barlow3
stated that surveys conducted in passing mode yield
less biased estimates of encounter rates but result in a
higher number of unidentified groups and more biased
estimates of group size and species percentages com-
pared with surveys conducted in closing mode. Clos-
ing mode allows for all observers to go “off effort” and
to adjust the course and speed of the vessel in order
to approach animals sighted at a distance from the
transect line. To assist with species identification and
group-size estimation, 25× binoculars were available
for all surveys on the Roger Revelle, for most surveys
on the David Starr Jordan, and occasionally on the
New Horizon. The 25× binoculars were used only as
an aid once a group had been located with the naked
eye or 7×50 binoculars to maintain a consistent search
method between surveys.
Observers recorded effort (on or off), weather (sea
state, swell height, visibility [or estimated distance
that observers can detect a small cetacean], and pre-
cipitation), changes in course and speed, and sight-
ing information onto data sheets. Observations were
considered on effort if observers were actively search-
ing with the unaided eye and 7×50 binoculars in a
sea state 0–5, the vessel was traveling no less than 6
km/h, and there was a minimum visibility of 0.9 km
(0.5 nmi) in front of the vessel. All sightings of all spe-
cies of marine mammals were recorded with the excep-
tion of California sea lions (Zalophus californianus),
which were sighted most often near the coast because
estimation of group size and documentation of sight-
ing details of high numbers of California sea lions in
coastal waters would have compromised the ability of
observers to sight and record other species that occur
in the same area.
Because these surveys were conducted in pass-
ing mode and with limited use of 25× binoculars,
3 Barlow, J. 1997. Preliminary estimates of cetacean abun-
dance off California, Oregon, and Washington based on a
1996 ship survey and comparisons of passing and closing
modes. Southwest Fish. Sci. Cent. Admin. Rep. LJ-97-11,
25 p.
some common dolphins (Delphinus sp.) that were en-
countered could be confirmed only to the genus level.
Short-beaked common dolphins (D. delphis) and long-
beaked common dolphins (D. capensis) have very simi-
lar morphological features and pigmentation, and they
are difficult to distinguish at a distance (Rosel et al.,
1994); therefore, observers were encouraged to obtain
photographs if there was doubt about the identification
of these or other species. Photographs were reviewed
onboard, compared with identification guides (Reeves
et al., 2002), and occasionally shared with experienced
colleagues for species confirmation. Additionally, there
are 2 forms of Pacific white-sided dolphins (Lagenorhyn-
chus obliquidens) along the coast of California (Walker
et al., 1986; Lux et al., 1997; Soldevilla et al., 2011);
because these forms are indistinguishable from a dis-
tance, density and abundance for this species likely in-
cludes both forms.
Analytical methods
Sighting and effort data from the 16 CalCOFI cruises
were split into 2 effort categories: 1) on-effort sight-
ings on the 6 CalCOFI transect lines, the sightings
that form the basis of all analyses and findings; and 2)
opportunistic effort (sightings made off effort or when
a vessel was not on a CalCOFI transect line), which
is presented to show species diversity and presence or
absence of species. We calculated encounter rates by
season (number of on-effort sightings per 1000 km of
transect line surveyed) for each species with 10 or more
sightings. Distance r of the animal(s) sighted from the
vessel and sighting position were determined from the
reticle value (or estimated distance), height of observer
platform, sighting angle (ǵ) to animal from the bow
of the vessel, and position of the vessel. To character-
ize the depth distribution of effort, sample points were
created at 1-km intervals along transect lines within
ArcGIS (vers. 9.2; Esri, Redlands, CA).
Sighting data also were plotted in ArcGIS, with
sighting and effort data linked to a coastline shape-
file and bathymetry data set from the ETOPO1 global
relief model (Amante and Eakins, 2009) with 1850-m
resolution (National Geophysical Data Center [NGDC],
http://www.ngdc.noaa.gov/mgg/global/global.html);
where highest resolution was not available from ET-
OPO1, the NGDC coastal relief model (NGDC, http://
www.ngdc.noaa.gov/mgg/coastal/crm.html) provided
90-m resolution (73% of sighting depths and 49% of
effort depths came from the 90-m resolution data set).
Distance to the closest point of land, distance to the
mainland, depth, and distance to the shelf break (200-
m isobath) were also calculated for each sighting and
effort location.
Using the cold (winter–spring, defined as Janu-
ary–April) and warm (summer–fall, defined as July–
November) water distinctions in Forney and Barlow
(1998), we tested for differences between the number
of encounters of each positively identified species by](https://image.slidesharecdn.com/709ba35e-2a86-4e29-bd94-09ed08064918-150414215822-conversion-gate01/85/DouglasFishBull2014-4-320.jpg)

![Douglas et al. Seasonal distribution and abundance of cetaceans off Southern California 203
egory. Selection of a detection function model was based
primarily on the Akaike’s information criterion (AIC)
value (generated with Distance) and then confirmed by
visual examination of detection plots (Burnham and An-
derson, 2002). Half-normal and hazard-rate key func-
tions often provide a good fit to data used to model
detection functions (Thomas et al., 2010). Although both
were considered in the models tested, the hazard-rate
Figure 2
Detection function plots by species group ([A] large whales, [B] delphinids, and [C]
Dall’s porpoise [Phocoenoides dalli]) were created to visualize the correct detection
functions to estimate density and abundance for the species most commonly encoun-
tered in the study area for line-transect surveys conducted off Southern California in
2004–08 during 16 quarterly California Cooperative Oceanic Fisheries Investigation
cruises. The points are the probability of detection for each encounter dependent on
its perpendicular distance and chosen covariate(s) for the best fit. The sighting data
showed some evidence of heaping (i.e., rounding to certain distances) because of the
limitations of the use of reticles to estimate distance. Therefore, sightings were binned
to facilitate data analysis (Buckland et al., 2001). For detection function covariates
and summary statistics, see Table 2.
A
B
C](https://image.slidesharecdn.com/709ba35e-2a86-4e29-bd94-09ed08064918-150414215822-conversion-gate01/85/DouglasFishBull2014-6-320.jpg)


![206 Fishery Bulletin 112(2–3)
Figure 3
Maps of on-effort sightings of the 4 most commonly encountered species of large whales, the (A) humpback whale (Mega-
ptera novaeangliae), (B) blue whale (Balaenoptera musculus), (C) fin whale (B. physalus), and (D) sperm whale (Physeter
macrocephalus), recorded during the 16 shipboard line-transect surveys conducted quarterly during 2004–08 as part of
the California Cooperative Oceanic Fisheries Investigation.
A B
C D
from analyses because the encounter records likely rep-
resent extralimital occurrences for both species.
Abundance estimates from line-transect data
Significant covariates for estimation of detection func-
tions varied by species and species group (Table 2). On
the basis of AIC values and visual examinations of test
models, we selected sea state as a significant covariate
for both the delphinid and Dall’s porpoise group. Addi-
tionally, group size and dolphin species were chosen for
the delphinid detection model. Average effective strip
width (ESW) was 1294 m for large whales, 298 m for
delphinids, and 305 m for porpoises.
Baleen whales We encountered 6 or possibly 7 species
of baleen whales (one encounter was undetermined;
it was not possible to distinguish whether it was a
Bryde’s or sei whale [Balaenoptera edeni brydei, B. e.
edeni, or B. borealis]), and sample sizes by species were
sufficient to calculate seasonal abundance and density
estimates for 3 of those species. Fin whales had the
Santa Barbara
Los Angeles
San
Diego
Santa Barbara
Los Angeles
San
Diego
Santa Barbara
Los Angeles
San
Diego
Santa Barbara
Los Angeles
San
Diego](https://image.slidesharecdn.com/709ba35e-2a86-4e29-bd94-09ed08064918-150414215822-conversion-gate01/85/DouglasFishBull2014-9-320.jpg)

![208 Fishery Bulletin 112(2–3)
highest encounter rate (Table 4) and were the most
abundant of large whales in the study area (Table 5),
with the greatest density estimate from summer–fall
surveys in shallow water, 3.67 individuals/1000 km2
(CV=0.30) (Tables 6 and 7), and with the greatest abun-
dance during the summer–fall surveys in deep water.
Fin whales were the only whale species that showed
a significant difference in depth, distance to land, and
distance to shelf by seasonal period (Table 7; Figs. 5
and 6). Humpback whale density was highest during
the summer–fall surveys in shallow water with 3.08
individuals/1000 km2 (CV=0.36) (Table 5). Least abun-
dant of the large whales, blue whales were encountered
only during the summer–fall surveys, with the greatest
density and abundance in shallow water, 3.20 individu-
als/1000 km2 and 228 individuals (CV=0.26) (Table 5).
Odontocetes Although sperm whales were most abun-
dant during the summer–fall surveys in deep water,
158 individuals (CV=0.36) (Table 5), density was simi-
lar for both shallow areas (0.94 individuals/1000 km2
[CV=0.44]) and deep areas (0.95 individuals/1000 km2
[CV=0.36]) for that seasonal period. Short-beaked com-
mon dolphins were the most abundant cetacean spe-
cies, encountered in all seasons and at all depths; the
highest encounter rate was observed in the summer
months (Table 4) and the greatest density estimate
was obtained from summer–fall surveys in shallow wa-
ter, 1319.69 individuals/1000 km2 (CV=0.24) (Table 5).
Long-beaked common dolphins were the second-most
abundant cetacean species; however, this species was
encountered only in shallow water and, seasonally,
there was a dramatic shift in density with 22 times
more long-beaked common dolphins observed during
the summer–fall surveys than during the winter–
spring surveys (Table 5). Because of the difficulty of
distinguishing between short- and long-beaked common
dolphins from a survey conducted in passing mode, 72
out of 211 on-effort common dolphin sightings were
not identified to species (Table 3). Densities of Pacific
white-sided, northern right whale, and Risso’s dolphins
were greatest during the winter–spring period in shal-
low water, and Dall’s porpoises were most abundant
during the winter–spring seasonal period in deep wa-
ter; these species were least abundant during the sum-
mer–fall period. Abundance of Dall’s porpoises varied
strongly by seasonal period but not by depth. Beaked
whales were encountered on 6 occasions, with Cuvier’s
beaked whale (Ziphius cavirostris) the most commonly
encountered (3 occasions).
Discussion
Monitoring and management of marine mammal spe-
cies off Southern California has often relied heavily
on abundance estimates generated from line-transect
surveys conducted during the summer and fall, despite
year-round anthropogenic activities and significant sea-
sonal spatial movements of many species (Forney and
Barlow, 1998). Our observations from the 16 CalCOFI
surveys conducted between 2004 and 2008 provide the
most current and consistent data set on seasonal shifts
in movements and abundance for the most commonly
Table 4
Encounter rate, the number of encounters (Enc) per 1000 km, and number of sightings n of cetacean species by season on
the 6 southern transect lines during 16 quarterly California Cooperative Oceanic Fisheries Investigation (CalCOFI) cruises
conducted from 2004 to 2008 off Southern California, for species seen on 10 or more occasions. The value under each season
represents the combined length of the transect lines surveyed.
Winter Spring Summer Fall All seasons
(4165 km) (4904 km) (6211 km) (4716 km) (19,996 km)
Species Enc/1000 km, n Enc/1000 km, n Enc/1000 km, n Enc/1000 km, n Enc/1000 km, n
Humpback whale 0, 0 2.2, 11 1.6, 10 2,7, 13 1.7, 34
Blue whale 0, 0 0, 0 3.1, 19 1.3, 6 1.3, 25
Fin whale 0.7, 3 1.0, 5 3.7, 23 4.7, 22 2.7, 53
Minke whale 0, 0 1.4, 7 0.3, 2 0.2, 1 0.5, 10
Sperm whale 1.0, 4 0.4, 2 1.9, 12 0.4, 2 1.0, 20
Short-beaked common dolphin 7.2, 30 0.8, 4 9.5, 59 6.1, 29 6.1, 122
Long-beaked common dolphin 0.2, 1 0.2, 1 1.3, 8 1.5, 7 0.9, 17
Common dolphin (unknown short-
or long-beaked) 2.6, 11 1.6, 8 5.5, 34 4.0, 19 3.6, 72
Pacific white-sided dolphin 2.6, 11 4.7, 23 1.1, 7 1.1, 5 2.3, 46
Risso’s dolphin 0.7, 3 1.6, 8 0.2, 1 0.4, 2 0.7, 14
Bottlenose dolphin 0.5, 2 1.0, 5 0.2, 1 0.8, 4 0.6, 12
Northern right whale dolphin 0.2, 1 1.8, 9 0, 0 0,6, 3 0.7, 13
Dall’s porpoise 2.6, 11 7.1, 35 0.2, 1 0.4, 2 2.5, 49](https://image.slidesharecdn.com/709ba35e-2a86-4e29-bd94-09ed08064918-150414215822-conversion-gate01/85/DouglasFishBull2014-11-320.jpg)


![214 Fishery Bulletin 112(2–3)
Figure 6
Box-and-whisker plot showing distance to land by season for fin
whales (Balaenoptera physalus) within the study area for line-
transect surveys conducted off Southern California during 2004–
08 for 16 quarterly California Cooperative Oceanic Fisheries In-
vestigation cruises. In each box, the middle horizontal line shows
the median value and the upper and lower lines show the 75th
and 25th percentiles. Ends of the upper and lower whiskers indi-
cate the minimum and maximum data values; an * indicates the
outlier and the vertical lines extend to a maximum of 1.5 times
the interquartile range.
(Balaenoptera acutorostrata) are difficult to sight even
in very good sea conditions. The sample size of this
species in the 6 CalCOFI surveys was insufficient for
an abundance estimate, but it is worth noting that we
encountered minke whales in low numbers from spring
to fall, and a peak in encounter rates occurred during
the spring (Table 4) that cannot be explained by bet-
ter sea conditions in spring. Although sei whales were
historically the fourth-most commonly captured whale
along coastal California during whaling activity in the
1950s and 1960s (Rice, 1974), they now are considered
rare in California waters (Dohl et al.5; Mangels and
Gerrodette, 1994; Forney et al., 1995; Barlow3). Our
results support findings that they are not commonly
encountered off southern California with only a sin-
gle sighting of a sei whale and a sighting of one other
individual that was either a sei whale or a Bryde’s
whale.
Odontocetes We encountered 16 species of odontoce-
tes, with sufficient sightings of 8 species to calculate
seasonal abundance and density and examine seasonal
trends. The most commonly encountered odontocete
species along Southern California are present year-
nal report, Marine Mammal and Seabird Study, central and
northern California, Contract No. 14-12-0001-29090. Pre-
pared by Center for Marine Sciences, Univ. California, Santa
Cruz, for the Pacific OCS Region, Minerals Management
Service, OCS Study MMS 84-0045, 284 p.
round, although some of them undergo sea-
sonal shifts in abundance; the Dall’s porpoise
and Risso’s dolphin have been recognized as
moving seasonally into Southern California
waters during the winter months. Such sea-
sonal shifts of abundance out of Southern
California waters during winter months in-
creases the likelihood that these species were
regionally underrepresented in previous es-
timates (Barlow and Forney, 2007; Carretta
et al., 2011b) of density and abundance that
were generated from sighting data collected
during summer–fall ship-based surveys.
Sufficient sample size allowed for density
and abundance estimation of sperm whales;
however, mean group size (2.7 individuals)
was significantly lower than the 8.1 indi-
viduals reported off Southern California from
pooled sightings collected over 5 years of
SWFSC surveys (Barlow and Forney, 2007).
In our study, group-size estimates were very
likely negatively biased by the constraints
of conducting a survey in passing mode, in-
stead of using the protocol for the SWFSC
line-transect surveys of conducting multiple
counts over 90 min to enumerate asynchro-
nously diving whales (Barlow and Taylor,
2005; Barlow and Forney, 2007). We encoun-
tered sperm whales year-round and in both
depth categories, but we observed this spe-
cies primarily during the summer–fall period in depths
>2000.5 m—findings similar to earlier analyses of year-
round survey effort (Dohl et al.5; Barlow, 1995; Forney
et al., 1995).
Even with our relatively high number of common
dolphin sightings that could not be identified to spe-
cies, we found that short-beaked common dolphins were
the most abundant and widely distributed cetacean in
our study area—a finding that is consistent with previ-
ously published results from cetacean survey effort off
Southern California (Leatherwood et al., 1982; Dohl et
al., 1986; Smith et al., 1986; Barlow, 1995; Forney et
al., 1995). Moreover, our stratified abundance estimates
provide clear evidence of seasonal shifts in habitat use.
We found that, during the summer–fall period, short-
beaked common dolphins were fairly evenly spread
throughout the study area, and, during the winter–
spring period, there was a surge in abundance of this
species into offshore waters (mean group size: 127.7 in-
dividuals; abundance: 101,900 individuals [CV=0.45]).
The greatest seasonal abundance estimate (170,151 in-
dividuals [CV=0.14]) was from the summer–fall period,
a level that is very close to Barlow and Forney’s (2007)
estimate for that seasonal period of 165,400 individu-
als (CV=0.19). From aerial and ship-based line-transect
surveys, the abundance of short-beaked common dol-
phins off California has been shown to change on sea-
sonal and interannual times scales (Dohl et al., 1986;
Barlow, 1995; Forney et al., 1995).](https://image.slidesharecdn.com/709ba35e-2a86-4e29-bd94-09ed08064918-150414215822-conversion-gate01/85/DouglasFishBull2014-17-320.jpg)
![Douglas et al. Seasonal distribution and abundance of cetaceans off Southern California 215
Long-beaked common dolphins were the fourthmost
commonly encountered and secondmost abundant small
cetacean in the study area. Distribution of long-beaked
common dolphins was limited to waters near the Cali-
fornia coast or Channel Islands—a result that is consis-
tent with findings that this species is commonly found
within ~93 km of the coast and ranges from Baja Cali-
fornia to central California, with the highest densities
observed during warm-water events throughout their
range (Heyning and Perrin, 1994). The uncorrected
abundance estimate from summer–fall surveys at shal-
low depths for long-beaked common dolphins (49,118
individuals [CV=0.52]) was about 3 times higher than
Barlow’s (2010) abundance estimate determined from
pooled data from line-transect surveys conducted during
1991–2008, but our mean group size (217.2 individuals
[CV=0.52]) and abundance estimate were much lower
than his mean group size and abundance estimates from
the 2009 line-transect survey, where corrected mean
group size was 481.0 individuals and abundance was
111,738 individuals (CV=0.44) (Carretta et al., 2011a).
Our estimates are likely negatively biased, given the
relatively large number of common dolphin sightings
that were not identified to species. However, the 2009 es-
timates were much greater than the results from earlier
surveys, and there was an indication that the moderate
El Niño event in 2009 may have caused an influx of
dolphins from the south. Our surveys, conducted during
2004–08, show that this species is present year-round
but increases 22-fold in abundance during the summer–
fall period, indicating that dolphins are shifting south
for the winter and spring.
Although the number of sightings was insufficient
from the winter–spring period to quantify year-round
seasonality of long-beaked common dolphins, this study
is the first to provide evidence of seasonal habitat use
for the 2 common dolphin species found along Southern
California. For previous publications that have docu-
mented seasonality, aerial surveys were used for cold-
water seasonal surveys; however, at the time of those
studies, there was not an effective method for distin-
guishing the 2 species from an aerial platform (Dohl
et al., 1986; Forney et al., 1995; Forney and Barlow,
1998). In marked contrast to the ratio of encounters of
short- and long-beaked common dolphins reported here
(6:1), Carretta et al. (2011a) encountered the 2 species
at a 1:1 ratio in 2009; their observation supports the
hypothesis of a dramatic shift or pronounced interan-
nual variability from the preceding years off Southern
California.
Pacific white-sided dolphins were encountered in all
seasons, with the greatest abundance estimate (14,898
individuals [CV=0.21]) from both depth categories com-
bined in the winter–spring seasonal period. Although
density was markedly different between the shallow
and deep categories during the winter–spring season,
abundance was fairly constant throughout the entire
study area. During the summer–fall period, we found
that density and abundance (9.24 individuals/1000 km2;
2204 individuals [CV=0.35]) decreased by almost 15%
from the previous winter–spring period, with greater
abundance in shallow waters than in deep waters. Bar-
low and Forney (2007) published a similar pooled abun-
dance estimate of 2196 individuals (CV=0.39) for sur-
veys conducted in all depths during the summer–fall
period during 1991–2005. From the data on encounters
by season, we found that a significant shift into deep
water occurred during the winter–spring period (Table
7, Fig. 7). Along the coast of California, the 2 forms of
Pacific white-sided dolphins are primarily found in wa-
ters over the continental shelf and slope (Forney, 1994).
The northern form is thought to enter coastal South-
ern California waters during the winter months and to
congregate with the southern form (Walker et al., 1986;
Lux et al., 1997; Soldevilla et al., 2011). Because we
were unable to differentiate between the 2 forms, it is
possible that the increase in observed abundance dur-
ing the winter–spring season was a result of capturing
both forms that use the study area rather than captur-
ing only the southern form.
Risso’s dolphins were encountered year-round in
shallow water, with abundance estimates of 2546 indi-
viduals (CV=0.36) for the winter–spring period and of
279 individuals (CV=0.55) for the summer–fall period.
Our findings agreed with those from visual surveys
that found high seasonal variability in occurrence and
distribution of this species off California (Shane, 1994;
Forney and Barlow, 1998; Kruse et al., 1999; Benson
et al., 2002; Barlow and Forney, 2007) and that their
abundance along the California coast could be an or-
der of magnitude higher during the winter than dur-
ing the summer (Forney and Barlow, 1998). However,
further research is needed to understand our results
in relation to the findings of Soldevilla et al. (2010),
who found peak Risso’s dolphin echolocation activity off
Southern California in the fall.
On the basis of genetics and morphology, bottlenose
dolphins along the coast of California and elsewhere
worldwide are split into offshore and coastal popula-
tions (Hansen, 1990; Carretta et al., 1998; Defran and
Weller, 1999; Bearzi et al., 2009; Perrin et al., 2011).
The Southern California coastal population typically is
encountered within 500 m of shore (this species was
sighted within that boundary 99% of the time during
a previous study; Hanson and Defran [1993]), and the
offshore population is found outside of a few kilome-
ters from the mainland. The mean distance from a
land mass that bottlenose dolphins were recorded in
this study was 34 km; the minimum distance was just
over 2 km. The study area did not include nearshore
waters sufficiently to encounter coastal bottlenose;
therefore, we assume that our abundance estimate is
for the offshore bottlenose dolphin population. For our
stratum of the summer–fall period and shallow depth,
the abundance estimate (2879 individuals [CV=0.69])
is greater than Barlow and Forney’s (2007) abundance
estimate (1831 individuals [CV=0.47]) for this popula-
tion off Southern California during the same period.](https://image.slidesharecdn.com/709ba35e-2a86-4e29-bd94-09ed08064918-150414215822-conversion-gate01/85/DouglasFishBull2014-18-320.jpg)

![Douglas et al. Seasonal distribution and abundance of cetaceans off Southern California 217
3) that showed an even tapering of sightings with dis-
tance from vessel.
Our results on seasonal occurrence of the 6 fre-
quently occurring delphinid species and the Dall’s
porpoise are consistent with prior findings. The bottle-
nose dolphin, long-beaked common dolphin, and short-
beaked common dolphin generally favor warm-water
(summer–fall) periods along the California coast (Dohl
et al., 1986; Barlow, 1995; Forney et al., 1995). Dall’s
porpoise, the Pacific white-sided dolphin, the northern
right whale dolphin, and Risso’s dolphin commonly are
found during the cold-water (winter–spring) periods off
Southern California, and these species tend to migrate
north into central California or Oregon and Washing-
ton during the warm-water periods (Forney, 1994; For-
ney and Barlow, 1998). These species have exhibited
abundance shifts associated with oceanographic vari-
ability on both seasonal and interannual time scales
(Perrin et al., 1985; Heyning and Perrin, 1994; Forney,
1997; Forney and Barlow, 1998; Becker, 2007).
There were only 6 sightings of beaked whales, but
all 3 genera (Ziphius, Berardius, and Mesoplodon)
known to be present off Southern California were de-
tected. The single sighting of a Mesoplodon could not be
confirmed to species. A single encounter with a group
of Baird’s beaked whales (Berardius bairdii) near the
shelf break during a survey in the summer is consis-
tent with other sightings of this species in continental
slope waters from late spring to early fall (Balcomb,
1989; Carretta et al., 2011b).
Of the 11 dolphin species encountered, 5 species were
represented by only 1–3 sightings per species: killer
whale, false killer whale, short-finned pilot whale (Glo-
bicephala macrorhynchus), rough-toothed dolphin, and
striped dolphin. Of these 5 species, only the killer whale
is commonly found year-round off Southern California,
with 2 U.S. stocks (Eastern North Pacific Transient and
Eastern North Pacific Offshore [Carretta et al., 2011b])
that use the area. We were unable to confirm which
stocks were represented in the 2 sightings of this spe-
cies. The rough-toothed dolphin and false killer whale
are considered rare off California, with no known current
or historical populations along the West Coast of the
United States; therefore, our sightings likely represent
extralimital movements from populations farther south.
There were too few encounters with striped dolphins
in the study area to look at seasonal shifts in habi-
tat; however, it is worth noting that the 3 sightings of
this species occurred in surveys conducted in the sum-
mer–fall period, in the deepest mean water depth, and
at the greatest mean distance to land of any species
observed in the study area (Table 6). Season, distance
to shore, and depth of striped dolphin encounters cor-
respond with those of previous surveys conducted in
summer and fall and with habitat models that revealed
the presence of striped dolphins in tropical to warm–
temperate pelagic waters, with a continuous distri-
bution outside upwelling coastal waters of California
(Perrin et al., 1985; Jefferson et al., 1993; Mangels and
Gerrodette, 1994; Archer and Perrin, 1999; Becker et
al., 2012; Forney et al., 2012).
Short-finned pilot whales were encountered com-
monly off Southern California before the El Niño event
in 1982–83 (Dohl et al.1); on the basis of numerous sur-
veys, including this one, it is apparent that this spe-
cies now uses these waters only infrequently (Carretta
and Forney, 1993; Shane, 1994; Barlow3; Forney, 2007).
The single encounter of false killer whales in the study
area occurred during the 2008 winter cruise at a depth
of 300 m and within 5 km of Santa Rosa Island. False
killer whales are normally found in tropical to warm–
temperate oceans; however, sightings have been made
occasionally in cold–temperate areas as well (Stacey
and Baird, 1991; Baird, 2008).
Conclusions
We collected sighting data from seasons and years that
have not been reported previously, generated density
and abundance estimates for 11 species of cetaceans off
Southern California, and documented shifts in seasonal
distribution for fin whales and Pacific white-sided dol-
phins. In recent years, interest has increased in the
development of predictive models to forecast near real-
time marine mammal distribution as a way to inform,
mitigate, and decrease the effect of potentially harmful
human activities in the marine environment (Becker
et al., 2012; Forney et al., 2012; Thompson et al., 2012;
Henderson et al., 2014). Although our data set spans
a 5-year period that ends in 2008, visual and acoustic
data on detections of marine mammals continue to be
collected with corresponding oceanographic data, both
physical and biological, during CalCOFI cruises. As the
CalCOFI data set grows, it potentially could become
one of the most valuable collections of data both for
monitoring and creating year-round habitat models of
cetacean species and their environment off Southern
California.
Acknowledgments
F. Stone, E. Young, and L. Petitpas and the Office of
Naval Research provided funding and project manage-
ment. We appreciate the efforts of all who were in-
volved in the CalCOFI surveys in 2004–08: the cap-
tains and crews of the New Horizon, David Starr Jor-
dan, and Roger Revelle and the scientists, especially
D. Wolgast, J. Wilkinson, A. Hays, R. Baird, S. Yin,
M. Smith, A. Miller, L. Morse, V. Iriarte, E. Vázquez,
N. Rubio, K. Merkens, J. Burtenshaw, E. Oleson, and
E. Henderson. We also thank K. Forney and R. Baird
for manuscript review. Finally, the authors would like
to honor S. Claussen, whose presence and laughter is
greatly missed.](https://image.slidesharecdn.com/709ba35e-2a86-4e29-bd94-09ed08064918-150414215822-conversion-gate01/85/DouglasFishBull2014-20-320.jpg)


![220 Fishery Bulletin 112(2–3)
Ohman, M. D., and E. L. Venrick.
2003. CalCOFI in a changing ocean. Oceanography
16:76–85.
Perrin, W. F., M. D. Scott, G. J. Walker, and V. L. Cass.
1985. Review of geographical stocks of tropical dolphins
(Stenella spp. and Delphinus delphis) in the eastern Pa-
cific. NOAA Tech. Rep. NMFS 28, 28 p.
Perrin, W. F., J. L. Thieleking, W. A. Walker, F. I. Archer, and
K. M. Robertson.
2011. Common bottlenose dolphins (Tursiops truncatus)
in California waters: cranial differentiation of coastal
and offshore ecotypes. Mar. Mamm. Sci. 27:769–792.
Peterson, W. T., R. Emmet, R. Goericke, E. Venrick, A. Manty-
la, S. J. Bograd, F. B. Schwing, R. Hewitt, N. Lo, W. Watson,
J. Barlow, M. Lowry, S. Ralston, K. A. Forney, B. E. La-
vaniegos, W. J. Sydeman, D. Hyrenbach, R. W. Bradely, P.
Worzybok, F. Chavez, K. Hunter, S. Benson, M. Weise, and
J. Harvey.
2006. The state of the California Current, 2005–2006:
warm in the north, cool in the south. CalCOFI Rep.
47:30–74.
Reeves, R. R., B. S. Stewart, P. J. Clapham, and J. A. Powell.
2002. Guide to marine mammals of the world, National
Audibon Field Guide Series, 527 p. Alfred A. Knopf,
New York.
Reid, J. L., G. I. Roden, and J. G. Wyllie.
1958. Studies of the California Current system. Contri-
butions from the Scripps Institution of Oceanography,
New Series No. 998. In Calif. Coop. Ocean. Fish. In-
vest. Prog. Rep., 1 July 1956 to 1 January 1958, p. 28–
56. [Available from http://www.calcofi.org/publications/
calcofireports/v06/CalCOFI_Rpt_Vol_06_1958.pdf.]
Rice, D. W.
1974. Whales and whale research in the eastern North
Pacific. In The whale problem: a status report (W. E.
Schevill, ed.), p. 170–195. Harvard Press, Cambridge,
MA.
Rosel, P. E., A. E. Dizon, and J. E. Heyning.
1994. Genetic analysis of sympatric morphotypes of
common dolphins (genus Delphinus). Mar. Biol.
119:159–167.
Shane, S. H.
1994. Occurrence and habitat use of marine mam-
mals at Santa Catalina Island, California from 1983–
1991. Bull. South. Calif. Acad. Sci. 93:13–29.
Smith, R. C., P. Dustan, D. Au, K. S. Baker, and E. A. Dunlap.
1986. Distribution of cetacean and sea-surface chloro-
phyll concentrations in the California Current. Mar.
Biol. 91:385–402.
Soldevilla, M. S., S. M. Wiggins, and J. A. Hildebrand.
2010. Spatial and temporal patterns of Risso’s dolphin
echolocation in the Southern California Bight. J.
Acoust. Soc. Am. 127:124–132.
Soldevilla, M. S., S. M. Wiggins, J. Calambokidis, A. Douglas,
E. M. Oleson, and J. A. Hildebrand.
2006. Marine mammal monitoring and habitat inves-
tigations during CalCOFI surveys. CalCOFI Rep.
47:79–91.
Soldevilla, M. S., S. M. Wiggins, J. A. Hildebrand, E. M. Ole-
son, and M. C. Ferguson.
2011. Risso’s and Pacific white-sided dolphin habitat
modeling from passive acoustic monitoring. Mar. Ecol.
Prog. Ser. 423:247–260.
Stacey, P. J., and R. W. Baird.
1991. Status of the false killer whale, Pseudorca
crassidens, in Canada. Can. Field-Nat. 105:189–197.
Stafford, K. M., S. L. Nieukirk, and C. G. Fox.
1999. An acoustic link between blue whales in the east-
ern tropical Pacific and the northeast Pacific. Mar.
Mamm. Sci. 15:1258–1268.
Steiger, G. H., J. Calambokidis, R. Sears, K. C. Balcomb, and
J. C. Cubbage.
1991. Movement of humpback whales between Califor-
nia and Costa Rica. Mar. Mamm. Sci. 7:306–310.
Thomas, L., S. T. Buckland, E. A. Rexstad, J. L. Laake, S.
Strindberg, S. L. Hedley, J. R. B. Bishop, T. A. Marques, and
K. P. Burnham.
2010. Distance software: design and analysis of distance
sampling surveys for estimating population size. J.
Appl. Ecol. 47:5–14.
Thompson, S. A., W. J. Sydeman, J. A. Santora, B. A. Black, R.
M. Suryan, J. Calambokidis, W. T. Peterson, and S. J. Bograd.
2012. Linking predators to seasonality of upwelling: us-
ing food web indicators and path analysis to infer tro-
phic connections. Prog. Oceanogr. 101:106–120.
Urbán R., J., A. Jaramillo L., A. Aguayo L., P. Ladrón de Gue-
vara P., M. Salinas Z., C. Alvarez F., L. Medrano G., J. K.
Jacobsen, K. C. Balcomb, D. E. Claridge, J. Calambokidis,
G. H. Steiger, J. M. Straley, O. von Ziegesar, J. M. Waite, S.
Mizroch, M. E. Dahlheim, J. D. Darling, and C. S. Baker.
2000. Migratory destinations of humpback whales win-
tering in the Mexican Pacific. J. Cetacean Res. Man-
age. 2:101–110.
Walker, W. A., S. Leatherwood, K. R. Goodrich, W. F. Perrin,
and R. K. Stroud.
1986. Geographical variation and biology of the Pacific
white-sided dolphin, Lagenorhynchus obliquidens, in
the north-eastern Pacific. In Research on dolphins (M.
M. Bryden and R. Harrison, eds.), p. 441–465. Claren-
don Press, Oxford, UK.
Weilgart, L. S.
2007. The impacts of anthropogenic ocean noise on ceta-
ceans and implications for management. Can. J. Zool.
85:1091–1116.
Wyrtki, K.
1964. Upwelling in the Costa Rica Dome. Fish. Bull.
63:355–372.](https://image.slidesharecdn.com/709ba35e-2a86-4e29-bd94-09ed08064918-150414215822-conversion-gate01/85/DouglasFishBull2014-23-320.jpg)


