1. The study examined the density and size of two bivalve species, Macomona liliana and Austrovenus stutchburyi, across tidal elevations at two sites near Tauranga Harbour, New Zealand - an exposed sandy site and a sheltered muddy site.
2. The results showed that bivalve density was generally higher at mid tide and lower tidal elevations, and lower at high tide. A. stutchburyi density was significantly higher at the exposed site while M. liliana density did not differ significantly between sites. A. stutchburyi size was also significantly larger at the exposed site.
3. Statistical analysis found significant differences in bivalve
Boleophthalmus dussumieri (Val., 1837) is a mudskipper species inhabiting, in abundance on the intertidal
mudflats occurred on either banks of Ulhas River estuary. The present study scan and focal sampling method
implied to record the lagged immergence of B. dussumieri on the surface during ebb-tide. The study revealed
direct correlation with the declining water level and rate of exposure of the mudflat during the ebb-tide
occurred at Kolshet creek along the west bank of the Ulhas River estuary. PCO obtained with Euclidean
distance matrix represented 100% ordination of the samples depicting that the level of water defined the rate of
surficial emergence of individuals.
corallivory and algal dynamics on some coral reefs in the persian gulfpersiangulf1
Macroalgae are a sign of degradation of coral reefs. Distribution of macroalgae on reefs is moderated by grazers including fish and sea urchins. However, several fish species including certain parrotfishes graze on live coral tissues, at times causing profound damage. In this paper, the positive role of macroalgae in suppressing parrotfish predation on Porites corals, the dominant coral genus in Qeshm Island, is investigated at three research sites at Qeshm Island in the Persian Gulf between April and July 2014 and 2015. Macroalgae, which were abundant in April, decreased significantly in frequency in July, while at the same time, the percentage of Porites colonies, the frequency of fish bite marks on Porites colonies, and the overall area of live coral tissue, which was grazed by parrotfishes increased dramatically, all of which were only negligible in April (with certain exceptions). Nevertheless, no changes were observed in parrotfish abundance. Despite partially supportive statistical data, this phenomenon is more likely to be due to the increased nutritional values of the corals in July in comparison to April. However, to understand the cause(s) and mechanisms involved in this annual phenomenon, more investigations seem necessary.
Utilization of Multiple Habitat Sampling Protocol for Macroinvertebrates as Indicators of Water
Quality in Stream Ecosystem in Lawis,
Buruun, Iligan City
Utilization of Multiple Habitat Sampling Protocol for Macroinvertebrates as Indicators of Water
Quality in Stream Ecosystem in Lawis,
Buruun, Iligan City
During the online seminar about web 2.0 as task 4 we had to create a 3 slides presentation, in order to check slide share and to tell shortly about our project
El impacto de los programas sociales de Carrizal. PAGGMunicipal
Ponente: José Luis Rodríguez, alcalde del municipio Carrizal del estado Miranda.
1er Encuentro Nacional de Política Social y Programas Sociales en el Municipio. Universidad Metropolitana, Caracas 15 y 16 de julio de 2016.
Mi Propiedad. La titularidad de la tierra en el municipio Sucre del estado Mi...PAGGMunicipal
Ponente: Adriana Iglesias, Directora de Programas de Fundasucre.
Ier Encuentro Nacional de Política Social y Programas Sociales en el Municipio. Universidad Metropolitana, Caracas 15 y 16 de julio de 2016.
Algal epiphytes were examined for 12 months at Shura El-Roweysia and several tidal levels on the shore
of South Sinai dominated by Laurencia obtusa and Cystoseira myrica. Sixty seven species of the
epiphytes were recorded (41 Bacillariophyta, 20 Cyanophyta, 3 Chlorophyta and 3 Pyrrhophyta). An
inverse relationship between percentage cover of L. obtusa and their epiphytes were observed to be
affected by desiccation stress due to frequent emersion of the intertidal flat and exposure to strong
radiation, while high cover percentage of C. myrica was associated with the high number of epiphytes.
Presentation to the Canadian Department of Fisheries and Oceans expert committee assessing the effectiveness of current mitigation guidelines for seismic surveys (oil and gas exploration at sea).
Seven years-round since 1999, distribution and percentage cover were investigated in Caulerpa prolifera
collected from 13 stations along the coast of the Suez Canal at different depths and from different types
of substrates as well as from monthly collected samples in a dense unshaded meadow at
a depth of 3-7 m at Great Bitter lakes. Caulerpa prolifera start increasing their cover in Spring and
continued to increase into Autumn, with maximum cover in Winter. The seasonality patterns have been
correlated with changes in light, temperature, desiccation and grazing. A rapid spread and high
abundance of the invaded Caulerpa prolifera were observed on sandy or muddy sea bottom in shallow
protected area of the Great Bitter Lakes. Caulerpa prolifera changes the ecology of area by reducing the
abundance of native marine fauna and flora.
Background Sea otters are one of the few cute and cuddly creature.pdfshakeelkhan911
Background Sea otters are one of the few cute and cuddly creatures in the ocean. Visitors to the
coast of the Pacific Northwest love to watch their antics as they float effortlessly on their backs
among the floating fronds of kelp (large algae) or frolic with one another in play. They also have
some human-like skills. Sea otters place rocks on their chests and crack mussels and clams on
them, one of the few examples of tool use by animals other than primates. They also roll spiny
sea urchins between their paws to make them easier to eat. Part I. Around 1991, Dr. James Estes
and his colleagues at the University of Califomia, Santa Cruz, noticed that the otter populations
they had been studying for over 20 years were beginning to shrink. Sea otter populations
inhabiting several of the Aleutian Islands had declined as much as 90 percent in fewer than 10
years (Figure 1). What could cause such a sharp drop in sea otter numbers in this island chain of
Alaska? Alakla (Rtedrume fiom Euse ental, 190t)
A. How would you test a bypothesis? Dr. Fstes and his group hypothesired that increased
predation by killer whales was the cause of the sea otter decline. This was an unusual idea, since
killer whales and sea otters had been observed together in Alaska for decades with no obvious
interactions occurring between them. The first time a killer whale was observed attacking a sea
otter was in 1991. Nine more attacks were observed in the next seven years and it was these
attacks that finally led Dr. Estes and his colleagues to propose their hypothesis. To test this
hypothesis, the scientists needed to have infomation about the killer whale. 1. Make a list of the
types of information about killer whales: you believe the scientists might need to test their
hypothesis that increased predation by the whales was the cause of the sea otter decline. B. What
do the data tell you? Estes and his colleagues estimated the impact of killer whales on sea otter
populations by comparing trends in population size and survival rates of individually marked
otters between two adjacent locations on Adak Island--Clam Lagoon and Kuluk Bay, Kuluk Bay
is on an open coast, so sea otters there are exposed to killer whales. In Clam Lagoon, the
entrance from the open sea is too narrow and shallow for killer whales to get in.
2. Based on Figures 3 and 4 , what can you conclude about the effects of killer whales on sea
otter populations? 3. What level of ecology are the researchers studying? 4. Why do you think
the scientists both counted all the sea otters and did the tagging and radio tracking? Why didn't
they do just one or the other? 5. What are three abiotic factors in the environment that otters
interact with that may affect their survival? 6. What type of ecology experiment is this?
(observational, controlled, modeled)
Figure 2. Map of the North Pacific Ocean showing the Aleutian Islands and some specific sea
otter study sites. (From Estes, J.A., and D.O. Duggins. 1995. "Sea otters a.
2016 Vianna et al. Indicators of fishing mortality in Palau_Authors copy
Soft shore WRITE UP
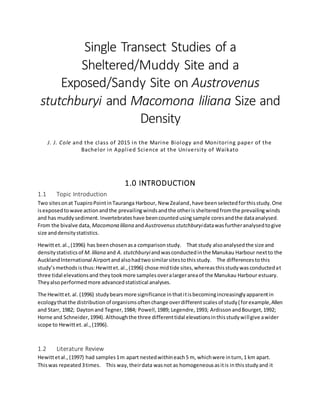
1. Single Transect Studies of a
Sheltered/Muddy Site and a
Exposed/Sandy Site on Austrovenus
stutchburyi and Macomona liliana Size and
Density
J. J. Cole and the class of 2015 in the Marine Biology and Monitoring paper of the
Bachelor in Applied Science at the University of Waikato
1.0 INTRODUCTION
1.1 Topic Introduction
Two sitesonat TuapiroPointinTauranga Harbour, New Zealand,have beenselectedforthisstudy.One
isexposedtowave actionandthe prevailingwindsandthe otherisshelteredfromthe prevailingwinds
and has muddysediment. Invertebrates have beencountedusing sample coresandthe dataanalysed.
From the bivalve data, Macomona liliana andAustrovenus stutchburyidatawasfurtheranalysedtogive
size anddensitystatistics.
Hewittet.al.,(1996) has beenchosenasa comparisonstudy. That study alsoanalysedthe size and
densitystatisticsof M.liliana and A. stutchburyiandwasconductedinthe Manukau Harbour nextto the
Auckland International Airport andalsohadtwo similarsitestothisstudy. The differencestothis
study’smethods isthus:Hewittet.al.,(1996) chose midtide sites,whereasthisstudywasconductedat
three tidal elevationsand they tookmore samplesoveralargerareaof the Manukau Harbour estuary.
Theyalsoperformedmore advancedstatistical analyses.
The Hewittet.al. (1996) studybearsmore significance inthatitisbecomingincreasinglyapparentin
ecologythatthe distributionof organismsoftenchange overdifferentscalesof study(forexample,Allen
and Starr, 1982; Daytonand Tegner,1984; Powell,1989; Legendre,1993; ArdissonandBourget,1992;
Horne and Schneider,1994). Althoughthe three differenttidal elevationsinthisstudywillgive awider
scope to Hewittet. al.,(1996).
1.2 Literature Review
Hewittetal., (1997) had samples1m apart nestedwithineach5 m, whichwere inturn,1 km apart.
Thiswas repeated3times. This way,theirdata wasnot as homogeneousasitis inthisstudyand it
2. representedalargerscale andtherefore gave aclearerpicture of the ecologyof the entire sandflat.
The data collectedinthisstudyonlyrepresentsaverynarrow band of sand flat.
Legendre etal.,(1997) foundthat large scale experimentsare neededtoexplainthe spatial structure of
M. liliana and A.stutchburyi. It isonlyat these largerscalesthatmakesit possible toobserve physical
factors thatinfluence the spatial structure of thesebivalves. Therefore,itisdifficulttoexplainthe
distributionof the bivalvesthatwere sampledinthisstudy. More samplesare neededtobe takenas
perthe methodusedbyHewittetal.,(1997) to make thispossible.
Hewittet.al. (1996) conducted a studyat two midtide sitesinthe ManukauHarbour nextto the
AucklandInternational Airport.Theycalledtheirtwosites,muddyandsandy.Thisstudy wasalso
conductedat twositeswithone being muddierthanthe other.These twositesare calledthe sheltered
(muddy) andexposed(sandy),althoughthisstudysampledatthree tidal elevations.InHewittet.al.
(1996), bothA. stutchburyiandM.liliana were more abundantinthe sandy(exposed) site,whichisalso
true in thisstudy,especiallyatmidtide. Anothersimilaritybetweenthisandthe Hewittet.al.(1996)
studyisthat there were veryfewpredatorspresent. Justsome seabirdsandlow densitiesof crab as
indicatedbythe crustaceans countin figure 6.
Hewittet.al.(1996) suggeststhatM. liliana are not verymobile asadultsbutA.stutchburyiare.
Although Legendre etal.,(1997) foundthat bothadultbivalvesare lessmobile than juveniles.Theyalso
foundthat clustersof adultbivalvesoccurmore oftenbecause of avariationof effectsincluding
predation,competitionandadvectionetc. Hightide clustersof largerbivalvesindicate the
hydrological historyoverseveral years. The distributionof smallerbivalvestendtobe more random
due to wide rangingwave action beingsolelyresponsiblefor the depositionof larva. They then,overa
periodof some years,congregate inareasthat advectionhasplacedthemandthen fine tune their
positionbymoving ontheirown tositesthat serve themwell intermsof foodavailabilityandlackof
predators. Indeed,inthisstudy,the presence of the seagrass Zostera marina,increasesthe size and
densityof all marine invertebratessince itservesasa predatorhideoutandis hot spotfor feeding(Reed
& Hovel,2006).
1.3 Aims and Objectives
Thisstudy aimsto provide a widerscope toHewittet.al.,(1996) instudyingthe three differenttidal
heights.
Thisstudyalso aimsto examine the twocommunitiesof the shelteredandexposedsitesatthree
differenttidal elevations(low,midandhigh) withineachsite alongatransect line, todecide whether
theirtaxonomiesare statisticallysignificantlydifferent. Special attentionwill be paidtothe density
and size of the bivalves. Those beingthe clam A.stutchburyi– a suspensionfeederandthe wedge
shell M.liliana – a depositfeeder.
3. 2.0 METHODS
2.1 Study site Location and Description
Figure 1. Map of the studysitesat TuapiroPoint inTauranga Harbour inthe NorthIslandof New
Zealand. The whelteredsite tothe westiswell protected,whilethe exposedsitetothe east,while still
protectedbyMatakana Island,ismore exposed. Thismap isthe same one as usedby Lelieveld,
Pilditch,&Green,(2004), butthe shelteredandexposedsiteshave beenaddedinaswell asthe transect
lines.
4. Figure 2. Low tide at the shelteredsite showingmangrove Avicennia marina var.resinifera seedlings
(Sveda,G.,2015b).
5. Figure 3. Photoof the exposedsite atlow tide takenfromhightide mark. Thisshowsthe Z. marina
seagrassmeadow(Sveda,G.,2015a)
2.2 Description of Methods
A semi-systematicsamplingschemewasusedtoquantitatively analyse community arraysacrossthe
shore (Fig.1). In thissampling scheme, positions were distributed systematicallyacrossthe transect
line,atlow,midandhightidal elevations.Ateachposition, 21replicate core,(13 cm diameterby15 cm
deep),samples randomly selectedwerecollected.
The cores were thensieved usinga1 mmmesh,and invertebrates were assignedtothe taxonomic
groupsof gastropods,polychaetes,crustaceansand bivalves.Eachgroupwas then counted. Within
the bivalves, A.stutchburyiandM.liliana were identified andmeasurementsof the maximumshell
lengthof twocommonspecieswere taken tothe nearestmm. The double headedarrowsinfig. 4and
fig.5 showexactly whatshell lengthwasmeasuredandcare wastakento ensure everyonewastaking
the same measurements.
All data wasthencollatedandenteredintoaspreadsheetforstatistical analysis.
6. 2.3 Predictions
The firstpredictionisthatshell size mayvarywithtidal elevationbecauseof adecrease infeeding
opportunities. The second,that M.liliana will be more denselypopulatedinthe shelteredsite.
Figure 5. A.stutchburyi(Bould,G., 2008a)
Figure 4. M.liliana (Bould,G., 2008b)
7. 3.0 RESULTS
3.1 Community Composition
3.1.1 Total Mean Densities
Figure 6. Total mean density of invertebrates(Polychaetes,Crustaceans,GastropodsandBivalves) inthe
exposed(blackbars) andsheltered(whitebars) sitesathigh,midandlow tide. Standarddeviationerror
bars are,on the whole,relativelyshort.
The highestdensityof invertebratesare atthe mid tide exposedsite. Thiswoulde because of sightings
of the seagrass, Z.marina. Also,the densitiesare relativelyhighatbothlow tide sites.
Apart fromthat midtide exposedsite,asthe tidal heightincreases,thereisaproportionate decrease in
invertebrate meandensities.
Figure 7. Close upphotoof Zostera marina inthe midtidal zone of the exposedsite
0.00
10.00
20.00
30.00
40.00
50.00
60.00
High tide Mid tide Low tide High tide Mid tide Low tide
EXPOSED SHELTERED
Totalmeandensity(freq.percore)
Survey Sites
8. 3.1.2 Proportional Density of all Invertebrates
Figure 8. The proportionof densitythateachinvertebrate groupexistsin.
Bivalvesare mostdominate atmidand low tide onthe shelteredsite.Gastropodsare mostdominantat
the midtide inthe exposedsiteandhightide atthe shelteredsite.Crustaceansare notdominantatall
but occur at the more exposedtidal areasandlessinthe more shelteredsites.Polychaetesare inhigher
densitiesinhighertidal sites. The exceptionisthe midtide,exposedsite,where theyare inverylow
numbersand seemtobe replacedbyGastropods because of the observed presence of aseagrass,Z.
marina.
0%
10%
20%
30%
40%
50%
60%
70%
80%
90%
100%
High tide Mid tide Low tide High tide Mid tide Low tide
EXPOSED SHELTERED
ProportionalDensity
Survey Sites
Polychaetes Crustaceans Gastropods Bivalves
9. 3.2 Bivalve Mean Size
Figure 9. Mean size of Austrovenusstutchburyi (blackbars) andMacamona liliana(whitebars) ateach
tidal zone inthe exposedandshelteredsites. The standard deviationerrorbarsare longin mostcases,
especiallyforM.liliana.
M. liliana are a largerspeciesthan A.stutchburyi.The size of eachspeciesdoesnotchange verymuch
overeach site. However, M.liliana are largestin the sheltered,hightide siteandsmallestatthe
exposedmidtide andshelteredlowtide sites. A. stutchburyiare notablylargestinthe exposedlow
tide site butit doesnothave a notable site atwhichtheyare at theirsmallest.
0.00
5.00
10.00
15.00
20.00
25.00
30.00
35.00
40.00
High tide Mid tide Low tide High tide Mid tide Low tide
EXPOSED SHELTERED
MeanSize(mm)&StDev
Survey Site
A. stutchburyi M. liliana
10. 3.3 Bivalve Density
Figure 10. Mean densityof A.stutchburyi(blackbars) and M. liliana (white bars) ateach tidal zone
withinthe exposedandsheltered sites. Standarddeviationerrorbarsare extremelylongindicating
that there isa verywide variabilityof densities inthe core samples ateachsite.
A. stutchburyi(686 total individuals)ismore denselypopulatedthan M.liliana (266). A.stutchburyiis
mostdenselypopulatedinthe exposedmidtide site.Itisalsodenselypopulatedinbothlow tide sites.
There isa spike of bothspeciesatmidtide onthe exposedtransectbecause of the presence of the
seagrass, Z.marina. Apart fromthat site,itisapparentthat increasesintidal heightrepresent
proportionate decreasesinbothspeciesmeandensities.This isasimilarpatterntofigure 6.
M. liliana it ismostlypopulatedatthe shelteredlow tide site. It isalso denselypopulatedinthe
exposedmid tide site.
Overall,thisgraphisa similarshape tofigure 6. The maindifferencesisthe lengthof the errorbars,
whichisbecause there ismare data infigure 6, whichmakesitmore precise.
Table 1. Total countsof A. stutchburyi andM lilianaateachsite
Exposed Sheltered
A. stutchburyi 431 255
M. liliana 112 154
There are significantlymore A.stutchburyiinthe exposedsite samplecoresthaninthe shelteredsite’s
cores. There doesnotlooklike thatthere ismuch difference betweenthe M.liliana countsfor each
site.
0.00
2.00
4.00
6.00
8.00
10.00
12.00
14.00
16.00
18.00
20.00
High tide Mid tide Low tide High tide Mid tide Low tide
EXPOSED SHELTERED
MeanDensity(freq.percore)
&StDev
Survey Site
A. stutchburyi M. liliana
11. 3.4 Statistical Analysis of Bivalve Size and Abundance
Table 2. ANOVA pvaluesof the data setswithineachsite. All pvaluesindicate verysignificant
differencesinthe valuesof all sites.
Data sets Sites p values
Density Exposed 0.00
Sheltered 0.00
Sheltered Exposed 0.01
Size 0.00
Thisindicatesthatmore analysisneedstobe performedtofindoutexactlywherethe significant
differencesliewithinthe sites.
Table 3. DensityT-testpvaluesbetweenshelteredandexposedsiteswithineachspecies.
A. stutchburyi 0.00 significant
difference
M. liliana 0.11 no significant
difference
There isa verysignificantdifference inthe densitiesof A.stutchburyibetweenthe exposedand
shelteredsites. Thisis notthe case for M.liliana.
Table 4. Size T-testp valuesbetweenshelteredandexposedsites withineachspecies
A. stutchburyi 0.04 significant
difference
M. liliana 0.67 no significant
difference
There isa statistically significantsize differenceof A.stutchburyibetweenthe exposedandsheltered
sitesandno significance forM.liliana. Both data setsare lesssignificantlydifferentthanthe density
data sets.
Table 5. T-testp valuesforoverall densitiesatall combinationsof tidal heightsateachsite. Non-
significantdifferencesare heavilyshaded.
Exposed Sheltered
Tidal heights A. stutchburyi M. liliana A. stutchburyi M. liliana
High/Mid 0.00 0.00 0.02 0.00
High/Low 0.01 0.01 0.00 0.00
Mid/Low 0.00 0.22 0.06 0.00
All tidal combinations(exceptforbetweenmidandlow tidesfor M.liliana onthe exposedtransectand
for the same tidal combinationfor A.stutchburyionthe shelteredtransect –heavilyshaded)have
significantlydifferentdensitiesbetweeneachtidal combination.
12. Table 6. T-testp valuesforoverall sizesatall combinationsof tidal heightsateachsite. Non-significant
differencesare heavilyshaded.
Sites Exposed Sheltered
Tidal heights A. stutchburyi M. liliana A. stutchburyi M. liliana
High/Mid 0.00 0.03 0.01 0.01
High/Low 0.04 0.19 0.01 0.17
Mid/Low 0.06 0.57 0.94 0.05
There are significantsizedifferencesforbothspeciesbetweenthe highandmidtidesatbothexposed
and shelteredsites. M.liliana hasno othersignificantlydifferentsizesinanyothertidal comparisonat
eithersite. The size of A.stutchburyiare significantlydifferentbetweenhighandlow tidesatboth
sites.There are no significant size differencesateithersite,foreither specieswhencomparingmidand
lowtides.
3.5 Size Frequencies
It seemsthatat all sitesthat the sizesof the bivalvesare verysimilarateach tidal elevation.
3.5.1 A. stutchburyi Exposed site
A. stutchburyiare very infrequentonthe exposedhightide site,very frequentatmidtide (because of
the presence of the seagrass, Z.marina) andsomewhere inthe middleatlow tide.
The trend lines showanormal distributionathighandmid tides. Atlow tide,the size isveryscattered,
but the bars still show avery slightnormal distributioncurve.
The true meangraduallydecreasesasthe tidal elevationdecreases.
The total frequency of A.stutchburyiinthe exposedsite is431 individuals.
0
5
10
15
20
25
30
35
40
45
50
0-1
6-7
12-13
18-19
24-25
30-31
36-37
Freq.onexposedhightidesites
A. stutchburyi sizeclasses
(mm)
0
5
10
15
20
25
30
35
40
45
50
0-1
5-6
10-11
15-16
20-21
25-26
30-31
35-36
Freq.onexposedmidtitdesites
A. stutchburyi sizeclasses
(mm)
0
5
10
15
20
25
30
35
40
45
50
0-1
5-6
10-11
15-16
20-21
25-26
30-31
35-36
Freq.inexposedlowtidesites
A. stutchburyi sizeclasses
(mm)
Figure 11. Size frequencyof A.stutchburyionthe exposedsite. Hightide (left),midtide (centre),
and lowtide (right). Trendline showsthe movingaverage foreveryfifthdataentry.
13. 3.5.2 A. stutchburyi Sheltered site
There are higherfrequenciesof eachsize classasthe tidal elevationdecreases.
All graphs do showa normal distribution trendline.Althoughatlow tide,there seemstobe two
cohorts. One smallercohortwitha meancentring12 – 13 mmas perthe exposedsite. The other
largercohort meancentringon 13 – 14 mm.
The overall frequencyof A.stutchburyiislowerinthe shelteredsite with255individuals.
3.5.3 M. liliana Exposed site
Figure 12. Size frequencyof A.stutchburyionthe shelteredsite. Hightide (left),midtide(centre),
and lowtide (right). Trendline showsthe movingaverage foreveryfifthdataentry.
0
3
6
9
12
15
18
21
0-1
5-6
10-11
15-16
20-21
25-26
30-31
35-36
Freq.inshelteredhightidesites
A. stutchburyi sizeclasses
(mm)
0
3
6
9
12
15
18
21
0-1
5-6
10-11
15-16
20-21
25-26
30-31
35-36
Freq.inshelteredmidtidesites
A. stutchburyi sizeclasses
(mm)
0
3
6
9
12
15
18
21
0-1
5-6
10-11
15-16
20-21
25-26
30-31
35-36
Freq.inshelteredlowtidesites
A. stutchburyi sizeclasses
(mm)
0
1
2
3
4
5
6
7
8
9
10
0-1
4-5
8-9
12-13
16-17
20-21
24-25
28-29
32-33
36-37
Freq.inexposedhightidesites
M. liliana sizeclasses (mm)
0
1
2
3
4
5
6
7
8
9
10
0-1
5-6
10-11
15-16
20-21
25-26
30-31
35-36
Freq.inexposedmidtidesites
M. liliana sizeclasses (mm)
0
1
2
3
4
5
6
7
8
9
10
0-1
5-6
10-11
15-16
20-21
25-26
30-31
35-36
Freq.inexposedlowtidesties
M. liliana sizeclasses (mm)
Figure 13. Size frequencyof M.liliana on the exposedsite.Hightide (left),midtide (centre),andlow
tide (right). Trendline showsthe movingaverage foreveryfifthdataentry.
As withA.stutchburyi,there are higherfrequenciesof individualsinthe midtide elevation. The size
classesrepresentedatall tidal elevationsare more scatteredthan A.stutchburyi.
There were alsosightingsof the seagrass, Zostera marina atmidtide
Cohortsseemstofeature more inthe M. liliana data. It isnot clearwhere the true meanslie athigh or
lowtides,butat midtide,there seemstobe one true meanat 6 – 8 mm and anotherat 24 – 25 mm.
The total frequencyof M.liliana at the exposedsite is112 individuals.
14. 3.5.4 M. liliana Sheltered site
As the tidal elevationdecreases,the frequenciesof M.liliana increases.Thisisasimilarpatternto A.
stutchburyiatthe shelteredsite althoughthere are lessoverall M.liliana individuals.
The trend lines doshow aresemblance of normal distributioncurves. The midtide trendline seemsto
showat leasttwopossible cohortsalthoughitisnotpossible tofindthe true meanof the smaller
cohorts.The largestone seemstohave a true meansize of 26 – 37 mm. There alsoseemstobe a
small cohortof smallerindividualsatlow tide withatrue meancentringon9 – 10 mm. The larger
cohort ismore obviouswithatrue meanof 22 – 23 mm.
The total frequencyof M.liliana inthe shelteredsite is154 individuals.
0
2
4
6
8
10
12
14
16
0-1
5-6
10-11
15-16
20-21
25-26
30-31
35-36
Freq.inshelteredhightidesites
M. lilliana sizeclasses (mm)
0
2
4
6
8
10
12
14
16
0-1
5-6
10-11
15-16
20-21
25-26
30-31
35-36
Freq.inshelteredmidtidesites
M. lilliana sizeclasses (mm)
0
2
4
6
8
10
12
14
16
0-1
5-6
10-11
15-16
20-21
25-26
30-31
35-36
Freq.inshelteredlowtidesites
M. lilliana sizeclasses (mm)
Figure 14 .Size frequencyof M.liliana on the shelteredsite.Hightide (left),midtide (centre),andlow
tide (right). Trendline showsthe movingaverage foreveryfifthdataentry.
15. 4.0 DISCUSSION
4.1 Predictions
The firstpredictionthatshell sizesof A.stutchburyiandM.liliana wouldvarywithtidal elevationis
partlyjustified. Table 6 showsthatthere are significantsizedifferencesforbothspeciesbetweenthe
highand midtidesat bothexposedandshelteredsites. M.liliana hasno othersignificantlydifferent
sizesinanyothertidal comparisonat eithersite. The size of A.stutchburyiare significantlydifferent
betweenhighandlowtidesatbothsites.There are nosignificantsize differencesateithersite,for
eitherspecieswhencomparingmidandlow tides. A.stutchburyi,butnotM.liliana has significant
differencesin shellsizesbetweenexposedandshelteredsites(Table 4). M.liliana shell size hasbeen
explainedby Hewittet.al.,(1996), who foundthatincrease insedimentgrainsize waspositively
correlatedtoincreasesinshell sizesfor M.liliana, butnot A. stutchburyi.
The second predictionmade that M.liliana wouldbe more populatedinthe shelteredsite isdisproven
since the densityT-testpvalue inTable 3 examiningsignificantdifference betweenthe shelteredand
exposedsitesisinsignificant.
4.2 Species diversity
The Hewittet. al. (1996) studyonlyfoundbivalvesandatwo speciesof polychaetes,whereasthisstudy
founda much more speciesdiverse site (fig.8).
It isinterestingtonote thatwhere the Z.marina meadow islocatedat midtide onthe exposedsite that
polychaete abundance hasfallendramaticallyandoutof sequence. The normal sequence for
polychaetesisfortheirnumberstofall asthe tidal heightdecreases butinthiscase,the midtide atthe
exposedsite,itisat itslowestproportional abundance. Theyseemtohave beenreplacedby
gastropods,whichare predictedtobe feedingof Z.marina.
The opposite istrue at hightide onthe exposedsitewhere polychaete numbersare muchhigherand
gastropodsare much lowerwhere there islessvegetationandthe onlysustenance forherbivoresisin
the phytoplanktonthatisdeliveredbyhightides. Predationfromthe highestproportionof crustacean
(crabs) numbers,isalsolikelytobe contributing tothe lowerproportion of bivalvesandgastropods.
On the shelteredside,there are alsolowernumbersof bivalvesandgastropodsthathave probablybeen
predatedonby birds. Anotherfactorcouldbe that the sandat hightide ismore compactedbyhuman
recreational andscientificactivity. It is harderfor these organismstoburrow intomore compacted
sand as describedby Lelieveld,Pilditch&Green,(2004).
In the shelteredsite,highernumbersof gastropodsathightide isassumedtobe because of the
presence of A.marina var.marina,whichtheyare feedingfrom.
4.3 Bivalve size and density
Table 4 andfigure 9 combine toshowthat the difference betweenthe meansizesof bothspeciesof
bivalves,especially M.liliana is notall that significant. The p value of the T-testcomparingbothsite’s
sizesof A.stutchburyiis0.04, whichisonlyjustsignificantlydifferent. Factorsthat contribute to
differentsizesof M.liliana is grainsize (Hewitt et.al., 1996). This wouldtendtosuggestthatthe
difference ingrainsize betweenthe exposedandshelteredsitedoesnottendtovaryverymuch. A
personal observationof these twositesisthatthe shelteredsite didseemtobe muddierthanthe
exposedside,whichwassandier.
16. The densityof these speciesateachsite givesaclearerpicture of the ecologyof these species. The T-
testp value intable 3 and the total countsof eachspeciesintable 1 combine toshowsthatthere isa
significantlyhigherdensityandcountof A. stutchburyiinthe exposedsitethan M.liliana.
4.4 Size frequencies
Figures11 – 14 showthe spreadof sizesthatoccur for each speciesof bivalve ineachsite.
In the exposedsite, A.stutchburyisizes(figure 11) donot tendto vary muchexceptat low tide,where
each size classispresent. Thisshowsthat recruitmentisoccurringhere atlow tide. Theythenmove
up to higherelevationstofeedon Z.marina at midtide,where there isahighabundance.
In figure 12, the lowerthe tidal elevation,the higherthe abundance of A.stutchburyi. The true meansto
don’tseemtovary much across the tidal elevations. The spreadof sizesare relativelytightmeaning
that the individualsare all aroundthe same age and size.
Figure 13 showsthatthe sizesof M.liliana in the exposedsite are muchmore spreadoutindicatinga
highvarietyof differentlifestagesof thisbivalve. The recruitmentof thisspeciesistherefore spread
out across all tidal elevations. Thistendstoagree withTable 4,whichillustratesthatthe pvaluesof T-
testson M.liliana sizesare notsignificant.
Figure 14 alsoshowsa wide spreadof M.liliana sizesinthe shelteredsite.
4.5 Size of this study
Thisis a verysmall scale study,whichpresentsmanyproblems.We onlysurveyedasmall sectionof
TuapiroPointand as such,it isunwise toassume thatthe patternsdiscoveredhere are typical of
TuapiroPoint,or anyothersand flat. It is therefore recommendedthatthe methodsusedinthisstudy
to be replicatedasperthe methodsusedinHewitt et.al. (1997). Furthermore,numerousstudiesalso
indicate the importance forlarge scale toenable the analysisof importantnatural processes,abioticand
biotic(forexample,AllenandStarr,1982; Daytonand Tegner,1984; Powell,1989; Legendre,1993;
ArdissonandBourget,1992; Horne andSchneider,1994).
The spike indensityandsize forall invertebratesincluding M.liliana andA. stutchburyirelatesto
sightingsof the seagrass, Z. marina (Fig.7 and Fig.3). ReedandHovel (2006) foundthata certain
thresholdof Z.marina densitiespositivelycorrelatedtoincreasesindensitiesof all epi-benthic
communities. They alsofoundthat Z. marina tendstooccur in areasthat are disturbedbyhumans.
Thiscoincideswithsightingsof horsesanda sledatmid tide onthe exposedsite. The Hewittet. al.,
(1996) studydoesnotmentionthe presence of anyvegetation.
Figure 10 hasverylongstandard deviationerrorbars,which againindicate thatmore datais reqiuired
by utilisingthe surveydesignbyHewittetal.,(1997). Thistime,toget a betterrepresentationof the
meandensities. The reletivelyinsignificantsize differencesinbargraphin figure 9 gives more weight
to the reasonwhythere neededtobe a biggerstudy. With the small amountof time available,this
was as muchas couldbe done. Anyfuture studyshouldtake intoaccountthe studydesignbyHewett
et. al (1997) and if possible,toallowmore time formore datacollectionalongmore transectlines.
17. 5.0 REFERENCES
Allen,T.F.H., & Starr, T. B. (1982). HierarchyPerspectivesforEcological Complexity.Universityof
ChicagoPress,Chicago,USA
Ardisson,P. L.,& Bourget,E. (1992). Large-scale ecological patterns:discontinuousdistributionof
marine benthicepifauna. Mar.Ecol.Prog.Ser., 83, 15–34.
Bould,G. (2008a). Austrovenusstutchburyi(Tuangi cockle).InA.S.T. cockle).jpg(Ed.):Wikipedia.
Bould,G. (2008b). Macomona liliana (large wedge shell).InM. l.l.w. shell).jpg(Ed.):Wikipedia.
Dayton,P.,& Tegner,M. (1984). The importance of scale incommunityecology:A kelpforestexample
withterrestrial analogues.InP.Price,C.Slobodchikoff &W.Gaud, A New Ecology:Novel
Approachesto InteractiveSystems (1sted.,pp.457 - 483). New York:WileyandSons.
Hewitt,J.E., T. S. F.,CummingsV.J.& Pridmore R.D. (1996). Matching patternswithprocesses:
predictingthe effectof size andmobilityon the spatial distributionsof the bivalvesMacomona
lilianaandAustrovenusstutchburyi. MarineEcology ProgressSeries,135, 57 - 67.
Hewitt,J. E., L. P.,McArdle B. H, Thrush S. F.,BellehumeurC.& Laurie,S. M. (1997). Identifying
relationships betweenadultandjuvenilebivalves atdifferentspatial scales. Journalof
ExperimentalMarineBiology and Ecology, 216, 77-98.
Horne,J.K.& Schneider,D.C.(1994). Lack of spatial coherence of predatorswithprey:A bioenergetic
explanationforAtlanticcodfeedingoncapelin. J.Fish Biol, 45, 191–207.
Legendre,P.(1993). Spatial autocorrelation:trouble ornew paradigm? Ecology,74,1659–1673.
Legendre,P.,Thrush,S.F.,Cummings,V.J.,Dayton,P.K.,Grant, J., Hewitt,J.E.,. . . Wilkinson,M.R.
(1997). Spatial structure of bivalvesina sandflat:Scale and generatingprocesses. Journalof
ExperimentalMarineBiology and Ecology,216(1–2), 99-128. doi:
http://dx.doi.org/10.1016/S0022-0981(97)00092-0
Lelieveld,S.D.,Pilditch,C.A.& Green,M. O. (2004). Effectsof deposit-feedingbivalve (Macomona
liliana) densityonintertidal sedimentstability. New Zealand Journalof Marineand Freshwater
Research,38, 115 - 128.
Powell,T.M.(1989) Physical andbiological scalesof variabilityinlakes,estuaries,andthe coastal ocean.
In J.Roughgarden,R.M. May., S.A. Levin. Perspectivesin Ecological Theory (pp.157–17).
Princeton,N.J:PrincetonUniversityPress.
Reed,J.R. & Hovel,K.A. (2006) Seagrasshabitatdisturbance:how lossandfragmentationof eelgrass
Zostera marina influencesepifaunal abundance anddiversity. MarineEcology ProgressSeries,
326, 133-143.
Sveda,G. (2015a). ExposedSite.InE. Site.jpg
Sveda,G. (2015b). Sheltered Site.InS.Site.jpg