This study investigated the effects of 24 years of no-till (NT) and moldboard plow (MP) tillage systems, with three levels of phosphorus (P) fertilization (0, 17.5, and 35 kg P/ha every two years), on soybean root traits in a corn-soybean rotation. The study found that tillage and P fertilization had no significant effects on root biomass, length, surface area or diameter. However, NT soybean roots were more concentrated in the upper 10 cm of soil and had a higher total root length density than MP. The difference in vertical root distribution between NT and MP decreased with increasing P fertilization.
![Soybean root traits after 24 years of different soil tillage and mineral
phosphorus fertilization management
Haixiao Lia,b,c,d
, Alain Mollierc
, Noura Ziadia,
*, Yichao Shia
, Leon-Étienne Parentb
,
Christian Morelc
a
Quebec Research and Development Centre, Agriculture and Agri-Food Canada, 2560 Hochelaga Blvd., Quebec, QC, G1V 2J3, Canada
b
Department of Soils and Agri-Food Engineering, Paul Comtois Bldg., Laval University, Quebec, QC, G1K 7P4, Canada, Canada
c
ISPA, Bordeaux Sciences Agro, INRA, 33140, Villenave d’Ornon, France
d
University of Bordeaux, 33405 Talence, France
A R T I C L E I N F O
Article history:
Received 21 June 2016
Received in revised form 2 September 2016
Accepted 3 September 2016
Available online xxx
Keywords:
No-till
Vertical root distribution
Legumes
A B S T R A C T
Legume crops are widely used in conservation agricultural systems, which are associated with minimum
soil tillage, due to their nitrogen-fixing capabilities. However, tillage and fertilization regimes may affect
the vertical distribution of legume roots and root traits, hence nutrient and water uptake by altering soil
properties in the long term. This study aimed to investigate how tillage and P fertilization affect soybean
(Glycine max, L.) root distribution and morphology in a long-term experiment.
A 24-year rain-fed corn-soybean rotation was established in 1992 on a clay loam soil in L’Acadie,
Quebec, Canada. The split-plot design (four replicates) comprised tillage systems [moldboard plough
(MP) and no-till (NT)] as main plot factors and P fertilization [0 (0 P), 17.5 (0.5 P) and 35 (1 P) kg P haÀ1
every two years during the corn (Zea mays L.) phase] as sub-plot factors. Soybean roots and shoots were
sampled in 2015, after 24 years, at flowering stage. Root samples were taken by collecting 5.25-cm
diameter cores to a depth of 60 cm at 5 cm,15 cm and 25 cm perpendicular to crop row. Soil cores were cut
into 0–5, 5–10,10–20, 20–30, 30–40 and 40–60 cm layers. After washing and separating the soil and roots,
root traits (biomass, length, surface and diameter, and the proportions of primary, secondary and tertiary
roots) were quantified using the WinRHIZO software.
Tillage and P fertilization regimes showed no significant effect on soybean root traits. Roots under NT
had a relatively higher root length density (RLD) of 1.95 cm cmÀ3
for a 60-cm soil profile compared to
roots under MP (1.55 cm cmÀ3
); RLD was relatively smaller at the highest P rate (1.57 cm cmÀ3
) compared
to the control and half rate treatment (1.82 and 1.86 cm cmÀ3
, respectively). However, the interaction
between tillage and P fertilization significantly influenced the vertical distribution of soybean roots.
Roots under NT primarily accumulated at 0–10 cm, containing 44% of the total root length (24% under
MP); by contrast, 36% of root length under MP and 21% under NT accumulated at 10–20 cm. However, the
difference in vertical root distribution between NT and MP was mitigated as P fertilization increased.
Soybean roots under NT showed higher RLD and greater root accumulation in the upper layers than MP
possibly in response to nutrient availability and stratifications with higher nutrient contents in the top
layers (0–10 cm) after 24 years of continuous NT practice.
ã 2016 Elsevier B.V. All rights reserved.
Abbreviations: MP, Moldboard plough; NT, No-till; 0 P, 05 P and 1 P, P fertilization rates of 0 17.5 and 35 kg P haÀ1
applied every two years on corn phase; RMD, Root mass
density (cm cmÀ3
); RSD, Root surface density (cm2
cmÀ3
); RLD, Root length density (cm cmÀ3
); RND, Root nodule density per root length (cmÀ1
); 3rdRLD, 2ndRLD 1stRLD root
length densities of tertiary secondary and primary roots (cm cmÀ3
); 3rdRL%, 2ndRL% 1stRL% root length proportions of tertiary secondary and primary roots; RLilr1, Isometric
log ratio transformation of root length proportions (tertiary roots vs. secondary and primary roots); RLilr2, Isometric log ratio transformation of root length proportions
(secondary roots vs. primary roots); Vilr1, Isometric log ratio transformation of vertical root length proportions (root lengths at 0–20 cm vs. roots at 20–60 cm); Vilr2, Isometric
log ratio transformation of vertical root length proportions (roots at 0–10 cm vs. roots at 10–20 cm); Vilr3, Isometric log ratio transformation of vertical root length proportions
(roots at 0–5 cm vs. roots at 5–10 cm); Vilr4, Isometric log ratio transformation of vertical root length proportions (roots at 20–40 cm vs. roots at 40–60 cm); Vilr5, Isometric log
ratio transformation of vertical root length proportions (roots at 20–30 cm vs. roots at 30–40 cm).
* Corresponding author.
E-mail address: noura.ziadi@agr.gc.ca (N. Ziadi).
http://dx.doi.org/10.1016/j.still.2016.09.002
0167-1987/ã 2016 Elsevier B.V. All rights reserved.
Soil & Tillage Research 165 (2017) 258–267
Contents lists available at ScienceDirect
Soil & Tillage Research
journal homepage: www.elsevier.com/locate/still](https://image.slidesharecdn.com/152287b9-1841-46fa-8e22-f1a224c0c96d-161109153036/85/Lietal-2016STR-1-320.jpg)
![Soybean root traits after 24 years of different soil tillage and mineral
phosphorus fertilization management
Haixiao Lia,b,c,d
, Alain Mollierc
, Noura Ziadia,
*, Yichao Shia
, Leon-Étienne Parentb
,
Christian Morelc
a
Quebec Research and Development Centre, Agriculture and Agri-Food Canada, 2560 Hochelaga Blvd., Quebec, QC, G1V 2J3, Canada
b
Department of Soils and Agri-Food Engineering, Paul Comtois Bldg., Laval University, Quebec, QC, G1K 7P4, Canada, Canada
c
ISPA, Bordeaux Sciences Agro, INRA, 33140, Villenave d’Ornon, France
d
University of Bordeaux, 33405 Talence, France
A R T I C L E I N F O
Article history:
Received 21 June 2016
Received in revised form 2 September 2016
Accepted 3 September 2016
Available online xxx
Keywords:
No-till
Vertical root distribution
Legumes
A B S T R A C T
Legume crops are widely used in conservation agricultural systems, which are associated with minimum
soil tillage, due to their nitrogen-fixing capabilities. However, tillage and fertilization regimes may affect
the vertical distribution of legume roots and root traits, hence nutrient and water uptake by altering soil
properties in the long term. This study aimed to investigate how tillage and P fertilization affect soybean
(Glycine max, L.) root distribution and morphology in a long-term experiment.
A 24-year rain-fed corn-soybean rotation was established in 1992 on a clay loam soil in L’Acadie,
Quebec, Canada. The split-plot design (four replicates) comprised tillage systems [moldboard plough
(MP) and no-till (NT)] as main plot factors and P fertilization [0 (0 P), 17.5 (0.5 P) and 35 (1 P) kg P haÀ1
every two years during the corn (Zea mays L.) phase] as sub-plot factors. Soybean roots and shoots were
sampled in 2015, after 24 years, at flowering stage. Root samples were taken by collecting 5.25-cm
diameter cores to a depth of 60 cm at 5 cm,15 cm and 25 cm perpendicular to crop row. Soil cores were cut
into 0–5, 5–10,10–20, 20–30, 30–40 and 40–60 cm layers. After washing and separating the soil and roots,
root traits (biomass, length, surface and diameter, and the proportions of primary, secondary and tertiary
roots) were quantified using the WinRHIZO software.
Tillage and P fertilization regimes showed no significant effect on soybean root traits. Roots under NT
had a relatively higher root length density (RLD) of 1.95 cm cmÀ3
for a 60-cm soil profile compared to
roots under MP (1.55 cm cmÀ3
); RLD was relatively smaller at the highest P rate (1.57 cm cmÀ3
) compared
to the control and half rate treatment (1.82 and 1.86 cm cmÀ3
, respectively). However, the interaction
between tillage and P fertilization significantly influenced the vertical distribution of soybean roots.
Roots under NT primarily accumulated at 0–10 cm, containing 44% of the total root length (24% under
MP); by contrast, 36% of root length under MP and 21% under NT accumulated at 10–20 cm. However, the
difference in vertical root distribution between NT and MP was mitigated as P fertilization increased.
Soybean roots under NT showed higher RLD and greater root accumulation in the upper layers than MP
possibly in response to nutrient availability and stratifications with higher nutrient contents in the top
layers (0–10 cm) after 24 years of continuous NT practice.
ã 2016 Elsevier B.V. All rights reserved.
Abbreviations: MP, Moldboard plough; NT, No-till; 0 P, 05 P and 1 P, P fertilization rates of 0 17.5 and 35 kg P haÀ1
applied every two years on corn phase; RMD, Root mass
density (cm cmÀ3
); RSD, Root surface density (cm2
cmÀ3
); RLD, Root length density (cm cmÀ3
); RND, Root nodule density per root length (cmÀ1
); 3rdRLD, 2ndRLD 1stRLD root
length densities of tertiary secondary and primary roots (cm cmÀ3
); 3rdRL%, 2ndRL% 1stRL% root length proportions of tertiary secondary and primary roots; RLilr1, Isometric
log ratio transformation of root length proportions (tertiary roots vs. secondary and primary roots); RLilr2, Isometric log ratio transformation of root length proportions
(secondary roots vs. primary roots); Vilr1, Isometric log ratio transformation of vertical root length proportions (root lengths at 0–20 cm vs. roots at 20–60 cm); Vilr2, Isometric
log ratio transformation of vertical root length proportions (roots at 0–10 cm vs. roots at 10–20 cm); Vilr3, Isometric log ratio transformation of vertical root length proportions
(roots at 0–5 cm vs. roots at 5–10 cm); Vilr4, Isometric log ratio transformation of vertical root length proportions (roots at 20–40 cm vs. roots at 40–60 cm); Vilr5, Isometric log
ratio transformation of vertical root length proportions (roots at 20–30 cm vs. roots at 30–40 cm).
* Corresponding author.
E-mail address: noura.ziadi@agr.gc.ca (N. Ziadi).
http://dx.doi.org/10.1016/j.still.2016.09.002
0167-1987/ã 2016 Elsevier B.V. All rights reserved.
Soil & Tillage Research 165 (2017) 258–267
Contents lists available at ScienceDirect
Soil & Tillage Research
journal homepage: www.elsevier.com/locate/still](https://image.slidesharecdn.com/152287b9-1841-46fa-8e22-f1a224c0c96d-161109153036/75/Lietal-2016STR-1-2048.jpg)
![1. Introduction
Conservation agriculture, as defined by Kassam et al. (2012), has
been widely adopted to reduce soil erosion, decrease input costs,
and sustain long-term crop productivity (Pittelkow et al., 2015;
Soane et al., 2012). Legumes are typically implemented in
conservation agricultural systems as row crops (Vanhie et al.,
2015) or cover crops (Sainju et al., 2005) due to their roles in
nitrogen fixation and weed control. Long-term conservation
systems, especially no-till (NT) without soil inversion, result in
the alteration of soil properties (Madejón et al., 2007) and the
heterogonous distribution of relatively immobile nutrients (e.g.,
phosphorus (P)) compared to conventional tillage systems
(Messiga et al., 2011). Consequently, root growth, crop yields
and plant nutrition can be affected in legume crops (e.g., soybean)
under NT.
Greater soil bulk density and resistance usually observed under
NT (Gantzer and Blake, 1978; Guan et al., 2014; Javeed et al., 2013;
Soane et al., 2012); such soil properties can hinder root penetration
and reduce root length density (Nunes et al., 2015; Qin et al., 2005).
Lal et al. (1989) reported a 45% reduction in soybean root length
density (RLD) under NT compared with plow-till in a calcareous
soil; this was a result of the greater soil bulk density and
penetration resistance caused by wheel traffic. It was also reported
that soil compaction could affect soybean root branching and
diameter (Cesar Ramos et al., 2010; Colombi and Walter, 2016; de
Assis Valadao et al., 2015). In contrast, Micucci and Taboada (2006)
did not observe any differences in soybean RLD between
conventional and NT systems. Therefore, there is a critical soil
bulk density or resistance for successful soybean root growth
(Keisuke Sato et al., 2015). No-till usually provides a stable soil
environment for micro-organisms (Helgason et al., 2010; Scopel
et al., 2013) that is favorable for nodulation and biological nitrogen
fixation by soybean roots (Muchabi et al., 2014). Modified soil
temperature, water availability and crop residues under NT could
also influence soybean root growth and nutrient uptake (Farmaha
et al., 2012; Vanhie et al., 2015).
The morphological traits of soybean roots are also related to soil
P status. Fernandez and Rubio (2015) reported higher specific root
length and smaller average root diameter in soybean where P-
uptake efficiency increased under P deficit. Higher P concen-
trations in the topsoil under NT results in P stratification, with a
higher P concentration in the topsoil (Calegari et al., 2013; Costa
et al., 2010; Lupwayi et al., 2006; Messiga et al., 2010). Such
stratification could stimulate the growth of soybean roots
(Holanda et al., 1998). It was also reported that soybean roots
respond to local P fertility, but only under low soil P test levels
(Farmaha et al., 2012).
The effects of tillage and P fertilization on soybean root growth
are generally studied separately. In this study, however, we
evaluated the combined effects of tillage [moldboard plough (MP)
vs. no-till (NT)] and mineral P fertilization (0, 17.5 and 35 kg P haÀ1
applied every two years as triple-superphosphate) on soybean root
distribution and morphology at a long-term (24 years) corn-
soybean rotation field experimental site in Eastern Canada. We
hypothesized that soybean root distribution and morphology
would respond to P fertilization and the subsequent effects of
tillage practices on the vertical distribution of nutrients.
2. Materials and methods
2.1. Site description
The site was established in 1992 at the L’Acadie Experimental
Farm (45
180
N; 73
210
W) of Agriculture and Agri-Food Canada.
Details on this rain-fed field experiment are reported in Ziadi et al.
(2014). Briefly, the soil is a deep clay loam soil (364 g kgÀ1
of clay
and 204 g kgÀ1
of sand in the Ap horizon) and classified as Humic
Orthic Gleysol, Typic Haplaquept. From 1992–1994, the site was
planted with corn (Zea mays L.). The corn and soybean (Glycine max
L.) rotation were initiated in 1995. The experimental set-up was a
split-split-plot replicated four times with two tillage practices
[Moldboard Plough (MP) and No-Till (NT)] randomized into main
plots and nine combinations of nitrogen (N) and P levels
randomized into subplots including three N (0, 80, 160 kg N haÀ1
)
and three P (0, 17.5, and 35 kg P haÀ1
) regimes, which were applied
every two years during the corn phase. The three P rates were
referred to as 0P, 0.5 P and 1 P, which corresponded to approxi-
mately 0, 0.5 and 1 time(s) the P exported every two years by
harvest, respectively. For the purpose of this study, we only
considered the optimal N level of 160 kg N haÀ1
, the two tillage
practices (MP and NT) and the three P fertilization rates. We
therefore considered a total of 24 field-plots measuring 25-m in
length by 4.5-m in width. The moldboard plough operation to a
depth of 20 cm occurred in the fall after crops were harvested. Each
spring, the soil was tilled by disking and harrowing to 10 cm before
seeding. For the NT treatment, plots were ridge-tilled from 1992 to
1997 and then flat direct-seeded starting in 1998. For all
treatments, crop residues were left on the soil surface after
harvest. At planting, fertilizers were banded-applied (5 cm from
the seeding row with a commercial seeder). Whereas, side-dress N
was applied using a disk opener (3–4 cm deep; CRAAQ, 2003) at
approximately the 8-leaf stage of corn growth. The P fertilizers
were applied as granules of commercial triple-superphosphate (Ca
(H2PO4)2, H2O) during a single operation at seeding. Nitrogen at a
rate of 160 kg haÀ1
was applied first at seeding, as urea at
48 kg N haÀ1
; this was followed by the addition of 112 kg N haÀ1
side-dressed as ammonium nitrate. All plots received 50 kg K2O
haÀ1
, band-applied at planting in 1992 and 2007; this was based on
soil analyses and local recommendations (CRAAQ, 2003). Herbi-
cides were applied based on provincial recommendations. In
soybean years, plots were sprayed with a tank mix of bentazon
(0.72 kg ai/ha) and imazethapyr (0.074 kg ai/ha) and 2 L/ha
ammonium sulfate (28–0–0) (Légère et al., 2008). Soybean
(Pioneer 2510RY) was sown with 75-cm inter-row at a plant
density of 45 Â104
plants haÀ1
. Soybean seeds were inoculated
with a commercial formulation of Bradyrhizobium japonicum (Hi
Coat N/TS225, Becker Underwood, Saskatoon, SK, Canada). Due to
unfavorable climatic conditions, soybeans were sown on June 26,
2015; this was relatively late compared to previous growing
seasons (in which sowing occurred in early June).
2.2. Root sampling and analysis
Root samples were collected on August 19–20, 2015 (54 days
after seeding, at approximately the end of the soybean vegetative
stage). Five consecutive soybean plants were randomly selected
from the 3rd or 4th row of each field-plot to avoid side effects. The
root samples were taken using the soil core method (Bohm, 1979)
with Giddings soil coring sampler (5.25-cm inner diameter)
(Giddings Machine Company, Inc.). In each field-plot, soil cores
were sampled perpendicularly from one side of one chosen plant.
Cores were taken up to a depth of 60 cm at three horizontal
distances (5,15 and 25 cm) perpendicular to the soybean row. Core
samples were sliced as follows: 0–5, 5–10, 10–20, 20–30, 30–40
and 40–60 cm. A total of 432 root samples were collected. Root
samples were placed in plastic bags and stored at 4
C for a few
days before soil-root separation was performed. Root samples
were first soaked in a 1 M solution of NaCl (1 L per 5-cm soil core)
for 16 h to disperse soil aggregates. Samples were then transferred
to a hydro-pneumatic elutriation washing machine (Smucker et al.,
1982). Cleaned roots were first collected on a 760 mm primary
H. Li et al. / Soil Tillage Research 165 (2017) 258–267 259](https://image.slidesharecdn.com/152287b9-1841-46fa-8e22-f1a224c0c96d-161109153036/85/Lietal-2016STR-2-320.jpg)
![sieve and then on a 400 mm secondary sieve (Bolinder et al., 2002).
The roots recovered on the secondary sieve were selected by hand
to remove the remaining mineral particles and organic debris.
Roots were then rinsed and placed on a transparent tray with
distilled water, dispersed with tweezers and scanned in black and
white (400 dpi, tagged image file format [TIF], white background)
using an Imagery Scan Screen (EPSON Expression 10000XL) (Sheng
et al., 2012). Root length, surface area and average diameter were
automatically analyzed using the professional image analysis
software “WinRhizo” (Regent Instruments Inc., Quebec). Root
length was classified into three diameter classes (0–0.2 mm
[tertiary roots], 0.2–0.8 mm [secondary roots] and 0.8 mm
[primary roots]). After scanning, the roots were dried with paper
towels to determine the fresh weight. Root nodules were separated
and counted. Then, roots were oven dried at 55
C to a constant
weight to determine the dry weight. Root length density (RLD),
surface area density (RSD) and mass density (RMD) were
calculated as root length, surface area and dry mass divided by
soil core volume, respectively. Root nodule density (RND) was
calculated by dividing the root nodule number by the root length.
The root length proportions of tertiary, secondary and primary
roots (3rdRL%, 2ndRL% and 1stRL%, respectively) were calculated as
the root lengths of each root order divided by total root length in
each sample.
2.3. Soil sampling and analysis
Soils were sampled on August 19–20, 2014, using a hydraulic
power sampler (5.25–cm inner diameter; Giddings Machine
Company, Inc.). Samples were air-dried, grinded manually, sieved
through a 2-mm sieve and stored before analysis. Phosphorus
(P-M3) and potassium (K-M3) were extracted by Mehlich-3
solution (Mehlich, 1984); 2.5 g of soil with 25 mL of Mehlich-3
extractant solution was shaken for 5 min. The P concentrations
were determined based on Murphy Riley method (Murphy and
Riley,1962) with a spectrophotometer (Jenway 6320D) (at 882 nm)
with a 1–cm long optical cell. Potassium concentrations were
determined with an Inductively Coupled Plasma Optical Emission
Spectrometer (Optima 4300 DV, PerkinElmer Corp., Norwalk, CT).
Total carbon (C) and N were quantified by dry combustion with a
LECO CNS-1000 analyzer (LECO Corp., St. Joseph, MI).
2.4. Crop harvest
Crop-yield data were collected from 1992 to 2015. Crops were
harvested at maturity, generally in September for soybean and
grain yield was determined by harvesting plants over 10 m in two
middle rows of each plot. Grain was threshed and weighed, and
yields were adjusted to a moisture content of 14%. Grain P content
was measured by mineralizing 0.1 g grain ground (0.2 mm) with a
mixture of sulfuric and selenious acids, as described by Isaac and
Johson (1976). The P concentrations were measured with a
QuikChem 8000 Lachat autoanalyzer (Zellweger Analytic Inc.,
Lachat Instruments Division, Milwaukee, WI) using the Lachat
method 13-107-06-2-E (Instruments, 2008; Ziadi et al., 2007).
2.5. Statistical analysis
All root data were first subjected to a screening to identify
outliers. No outliers were found; however two samples went
missing during transportation. The screened data were tested
using the GLIMMIX procedure and transformed (if necessary)
using the transreg procedure (SAS Institute Inc., 2010) to achieve
normality of distribution and homogeneity of variance before
conducting ANOVA. Root length proportions were treated as
compositional data. To avoid biases, data were transformed into
isometric log ratios (ilr) according to sequential binary repartitions
(RLilr1: tertiary roots|(secondary and primary roots); RLilr2:
secondary roots|primary roots) and the following equation
(Eq. (1)), which was described previously (Egozcue et al., 2003):
ilri ¼
ffiffiffiffiffiffiffiffiffiffiffi
rs
r þ s
r
ln
ð
Y
þ
xjÞ
1
r
Y
À
xk
1
s
i ¼ 1; 2; 3; . . . ; D À 1; j þ k ¼ D ð1Þ
where D is the number of all data parts in the i-th order partition; xj
and xk is the root lengths of positive and negative parts in the i-th
order position; the products P+ and PÀ only include parts coded
with + and À, and r and s are the numbers of the positive and
negative signs (parts) in the i-th order partition.
The vertical partitions of soybean root lengths were also
analyzed by compositional data analysis with sequential binary
partitions (Vilr1: root lengths at 0–5, 5–10, and 10–20 cm|root
lengths at 20–30, 30–40, and 40–60 cm; Vilr2: root lengths at 0–5
and 5–10 cm|root lengths at 10–20 cm; Vilr3: root lengths at
0–5 cm|root lengths at 5–10 cm; Vilr4: root lengths at 20–30 and
30–40 cm|root lengths at 40–60 cm; Vilr5: root lengths at
20–30 cm|root lengths at 30–40 cm). Canonical discrimination
analysis was performed using the CANDISC procedure (SAS
Institute Inc., 2010) and Vilrs root distribution values for the six
depths. Six combined tillage and P fertilization treatments ([NTand
0P], [NT and 0.5P], [NT and 1 P], [MP and 0 P], [MP and 0.5 P] and
[MP and 1 P]) were tested by discrimination analysis.
ANOVA was performed using the MIXED procedure (SAS
Institute Inc., 2010) to evaluate the fixed effects of tillage, P
fertilization, sampling depth and perpendicular distance to the
soybean row and the interactions between these factors on root
distribution and morphology and soil nutrient concentrations. The
random effects were set as blocks and block  tillage interactions.
In addition, the sampling depth and perpendicular distance to the
soybean row were repeated-measures. Crop-yield data were
subjected to ANOVA using the MIXED procedure to evaluate the
effects of tillage practice, P fertilization, and year along with the
interactions between these factors. Random effects were set as the
block and its interaction with tillage. Treatment effects were
deemed significant when P 0.05; differences among least square
means for treatment pairs were identified using the LSMEANS
(/diff) statement (t-test) (SAS Institute Inc., 2010).
3. Results and discussion
3.1. Soil nutrient stratification
Nutrient stratification refers to a distribution of nutrients that is
non-uniform with soil depth and especially to situations with
higher concentrations of nutrients near to the soil surface.
Phosphorus stratification along the soil profile with high soil P
concentrations in the upper layers was observed for the NT system
(Fig. 1). Soil under NT generally had higher P-M3 values in the
upper soil layers (0–20 cm) compared with soil under MP; several
of these differences were significant; the differences in P-M3
between NT and MP treatments increased as P rates increased
(Table 1, Fig. 1). In contrast, MP soil had significant higher P-M3
than NT soil at a depth of 20–30 cm. As P fertilization was banded
applied, soil P was significantly influenced by sampling distances
(Table 1) with greater P-M3 (20.43 mg kgÀ1
) at 5-cm distance
compared to those at 15- and 25-cm distances (15.70 and
15.84 mg kgÀ1
).
Similar vertical stratifications under NT and MP treatments
were also observed for soil C, N and K (Table 1, Fig. 2). Soil C, N and K
contents were distributed homogenously throughout the upper
260 H. Li et al. / Soil Tillage Research 165 (2017) 258–267](https://image.slidesharecdn.com/152287b9-1841-46fa-8e22-f1a224c0c96d-161109153036/85/Lietal-2016STR-3-320.jpg)
![Over the entire 60-cm soil profile, soybean roots under MP were
similar to the pattern observed at 10–20 cm (1 P: 1.14 cm cmÀ3
;
0.5 P: 1.72 cm cmÀ3
; 0 P: 1.82 cm cmÀ3
). However, soybean roots
under NT tended to increase with increasing P fertilization over the
entire soil profile (1 P: 2.05 cm cmÀ3
; 0.5 P: 2.00 cm cmÀ3
; 0P:
1.81 cm cmÀ3
). This might be caused by soil P stratification, with
high soil P status (P-M3) in upper soil layers under NT (Fig.1). Such
a soil P stratification could stimulate soybean root growth
(Holanda et al., 1998), especially in the early stage of growth
(Zia et al., 1988). However, why soybean roots responded to P
fertilization differently under NT and MP could not be fully
explained in this study.
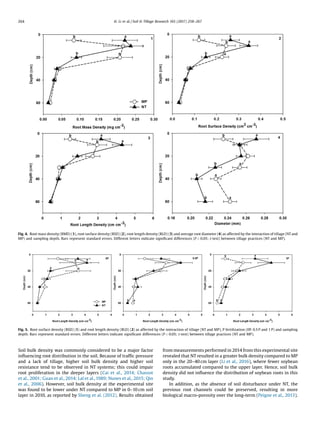
3.4. Vertical root length proportion affected by tillage and P
fertilization
According to the RLD results above, tillage and P fertilization
affected root length proportions along the soil profile. The results
of the canonical discriminant analysis for vertical root length
proportions are shown in Fig. 6. Along the axis of Can1, which
explained 65% of the total variance, treatment [NT, 0P] was
significantly separated from treatments [MP, 0P] (P = 0.0067), [MP,
0.5P] (P = 0.0227) and [MP, 1 P] (P = 0.0191) (Fig. 6.1). Treatments
[NT, 0.5P] and [NT, 1 P] were intermediated. The balance between
the root lengths at 0–10 cm and 10–20 cm (Vilr2) contributed most
to the treatment separation (Fig. 6.2). Root lengths at 0–10 and
10–20 cm layers under [NT and 0P] accounted for 52% and 18%,
respectively, of the total root length over the entire soil profile
(Fig. 6.3). In contrast, root lengths in the 0–10 and 10–20 cm layers
accounted for 27–29% and 33–41%, respectively, of the total length
under MP.
One cause of the differential distribution of soybean roots could
be nutrient stratifications along the soil profile under NT and MP.
As crop roots tend to accumulated in nutrient-rich zones in the soil
(Li et al., 2012), increases in soil nutrients (C, N, P, K) in the top
layers under NTcould lead to a greater proportion of roots in the 0–
10 cm layer. Compared with the deep-banded P fertilization
observed under NT, Farmaha et al. (2012) reported a greater
proportion of soybean roots in the 0–5 cm layer under broad P
fertilization treatment. Farmaha et al. (2012) also observed that the
response of soybean roots to localized P resources might only occur
under low soil P levels; these findings suggest that the disparities
in soybean root length proportions along the soil profile between
NT and MP tend to be mitigated by increasing rates of P
fertilization. In our study, the treatments [NT, 0.5P] and [NT, 1 P]
could not be significantly distinguished from the MP treatments
(Fig. 6.1).
Briefly, tillage had significant effects on soybean root propor-
tions along the soil profile. Soybean roots tended to accumulate in
the 0–10 cm layer under NT, and in the 10–20 cm layer under MP.
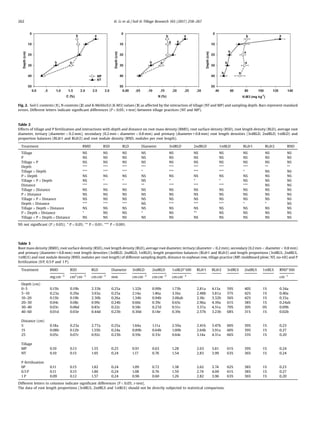
Fig. 3. Root mass density (RMD) (1), root surface density (RSD) (2), root length density (RLD) (3) and average root diameter (4) under different sampling depths and
perpendicular distances to the corn row. Bars represent standard errors. Different letters indicate significant differences (P 0.05; t-test) among depths (0–5, 5–10,10–20, 20–
30 and 30–40 cm) for each perpendicular distance (5-cm, 15-cm and 25-cm).
H. Li et al. / Soil Tillage Research 165 (2017) 258–267 263](https://image.slidesharecdn.com/152287b9-1841-46fa-8e22-f1a224c0c96d-161109153036/85/Lietal-2016STR-6-320.jpg)
![This was reported by Messiga et al. (2011) at the experimental site.
Such a net of macro-pores could facilitate root proliferation in soil
(Calonego and Rosolem, 2013). Our study conducted in 2014
demonstrated a biomass accumulation of corn roots in the upper
layers, with 38–49% of the total root length in the 0–10 cm layer in
both NT and MP (Li et al., 2016). However, the high proportions of
macro-pores formed by previous corn roots in the 0–10 cm layer
was preserved only under NT, possibly contributing to a greater
accumulation of soybean roots in the 0–10 cm layer. It was partially
confirmed by the previous study of Messiga et al. (2011) conducted
in the same site, who observed higher macro aggregation (2000–
250 mm) content in NT (60.2% of whole soil weight) than that in MP
(48.5%) of whole soil weight, which would lead to more macro-
pores in NT. Besides, some studies (Francis and Fraser, 1998;
Lachnicht et al., 1997) mentioned that earthworms contributed to
create more macro-pores in soil. Since the activity of earthworms
tended to be intensified in relatively stable soil environment in NT
(Helgason et al., 2010), it could be another reason why soybean
roots in NT accumulated primarily at 0–10 cm depth. In contrast,
Chassot et al. (2001) and Costa et al. (2010) mentioned that more
vertical macro-pores in NT than MP could also encourage roots to
proliferate into deeper layers. Thus, further studies are needed to
clarify the relation between macro-pore and crop root distribution
in NT system.
3.5. Root morphology affected by tillage and P fertilization
In addition to root quantity and distribution, root morphologic
traits such as average root diameter and fine root proportion, are
important for crop growth. Fine roots are considered more efficient
in nutrient uptake (Bakker et al., 2009; Zobel et al., 2007).
Tillage and sampling depth interacted significantly on the
average root diameter and the root length proportions of tertiary,
secondary and primary roots (1stRL%, 2ndRL% and 3rdRL%)
(Table 2). Variations in the distribution of tertiary, secondary
and primary root lengths (1stRLD, 2ndRLD and 3rdRLD) were
similar to those of total RLD (Table 3).
Compared to MP, the average root diameter under NT was
significantly larger in the 0–5 cm layer and significantly smaller in
the 20–30, 30–40 and 40–60 cm layers (Fig. 4.4); similar variations
were observed for 1stRL%, 2ndRL% and 3rdRL%. The interaction
between tillage and sampling depth had a significant effect on root
length proportion balances (RLilr1 and RLilr2), with significant
differences observed between NT and MP in the 0–5, 10–20 and
20–30 cm layers (Table 4). Correspondingly, these results indicated
that 3rdRL% was significantly smaller under NT (54.4%) compared
with MP (63.3%) in the 0–5 cm layer, resulting in a larger average
root diameter. Smaller average root diameters were observed in
the 30–40 and 40–60 cm layers under NT, which corresponded
with a higher 3rdRL% (Table 4).
The proportion of soybean roots along the soil profile might
explain the differences in root morphology observed between NT
and MP treatments. As soybean roots primarily accumulated in the
0–10 cm layer under NT, more primary and secondary roots were
located in the upper soil layers; this results in a smaller proportion
of tertiary roots and, consequently, a larger average root diameter.
However, tillage and P fertilization had no effect on the root length
proportions of tertiary, secondary and primary roots or the average
root diameter across the entire soil profile (Table 2). Soybeans may
prefer to modify the root biomass rather than root morphology in
response to variations of soil P status (Fernandez and Rubio, 2015).
3.6. Soybean yields
Soybean yields obtained in 2015 were much smaller than those
in other years over the 24 years of experimentation. This was
Fig. 6. (1) Scatterplot for six combined treatments ([MP and 0P], [MP and 0.5 P], [MP and 1 P], [NT and 0P], [NT and 0.5 P] and [NT and 1 P]) and (2) bi-plot for five vertical root
length distribution variables (Vilr1, Vilr2, Vilr3, Vilr4 and Vilr5) of canonical discriminant analysis based on Mahalanobis distance for vertical distribution under combined
tillage and P fertilization treatments. The analysis explained 85% of the variance (Axis of Can1 and Can2), suggesting that combined treatments can be discriminated by
vertical root length distribution. (3) Vertical root length proportions in percentage of each sampled depth for six combined treatments.
Table 4
Tertiary (diameter 0.2 mm), secondary (0.2 mm diameter 0.8 mm) and primary (diameter 0.8 mm) root length proportion balances (RLilr1 and RLilr2) and root length
proportions (3rdRL%, 2ndRL% and 1stRL%) for different sampling depth under two tillage practices (MP, moldboard plow; NT, no-till).
Depth (cm) RLilr1 RLilr2 3rdRL% 2ndRL% 1stRL%
MP NT MP NT MP NT MP NT MP NT
0–5 3.26a 2.36b 4.59 3.67 63.6% 54.4% 35.6% 43.8% 0.8% 1.9%
5–10 2.62 2.34 4.11 3.52 56.1% 58.0% 43.4% 41.2% 0.6% 0.7%
10–20 2.00 2.36 2.98b 3.66a 56.6% 56.8% 42.4% 42.5% 1.0% 0.7%
20–30 2.50b 3.42a 3.89 4.89 56.8% 65.7% 42.6% 33.9% 0.7% 0.4%
30–40 3.08 3.67 4.25 4.79 66.7% 73.5% 32.8% 26.1% 0.5% 0.4%
40–60 2.28 2.85 3.05 3.41 64.0% 71.9% 34.7% 27.2% 1.2% 0.8%
Different letters for each variable indicate significant differences (P 0.05; t-test) between tillage practices.
The data of root length proportions (3rdRL%, 2ndRL% and 1stRL%) should not be directly subjected to statistical comparison.
H. Li et al. / Soil Tillage Research 165 (2017) 258–267 265](https://image.slidesharecdn.com/152287b9-1841-46fa-8e22-f1a224c0c96d-161109153036/85/Lietal-2016STR-8-320.jpg)