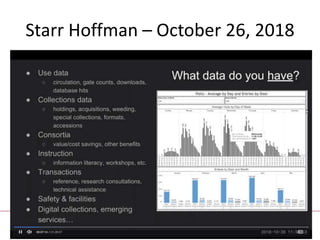
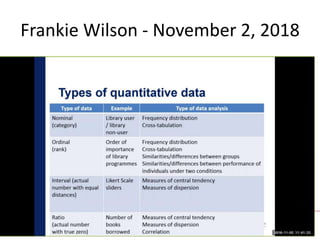
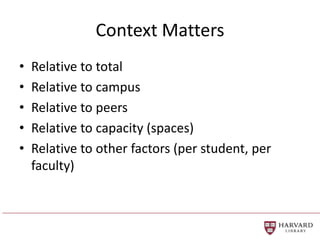
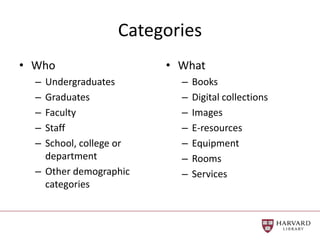
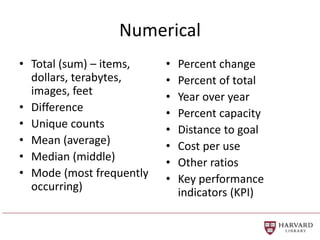
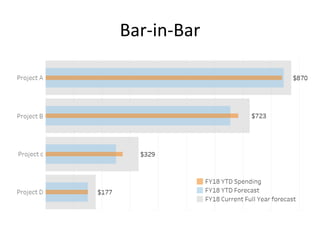
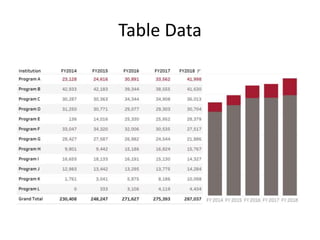
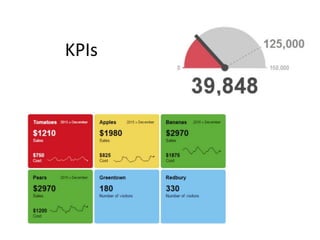
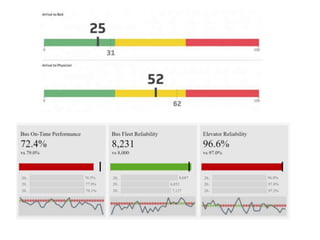
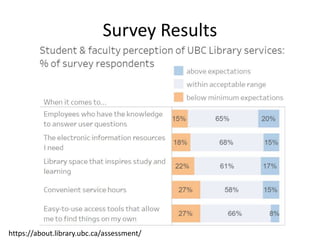
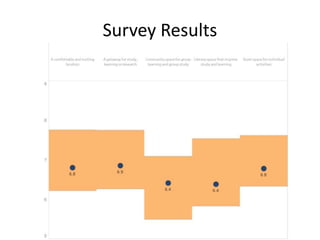
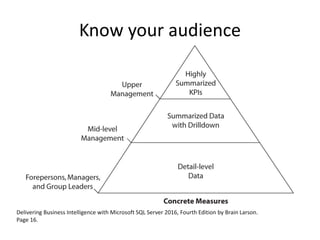
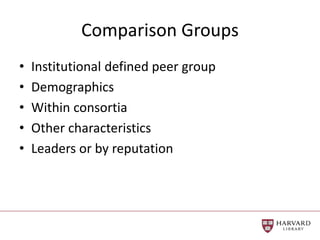
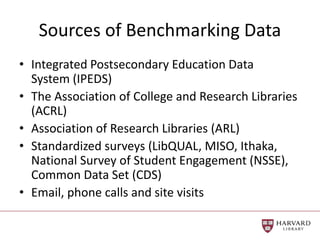
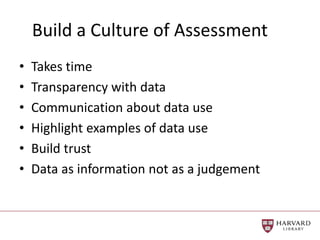
Formulating, Interpretation and
Presentation of Data
Rachel Lewellen
Head of Assessment and Program Management
NISO Webinar November 9, 2018
Introduction
• Data visualization
• Correlational and causation
• Benchmarking
• Data discomfort
Starr Hoffman – October 26, 2018
Frankie Wilson - November 2, 2018
Sample Visualizations
• Categories
• Maps
• Time
• Numbers
Context Matters
• Relative to total
• Relative to campus
• Relative to peers
• Relative to capacity (spaces)
• Relative to other factors (per student, per
faculty)
Categories
• Who
– Undergraduates
– Graduates
– Faculty
– Staff
– School, college or
department
– Other demographic
categories
• What
– Books
– Digital collections
– Images
– E-resources
– Equipment
– Rooms
– Services
Bar Charts
Stacked Bar
Pie, Donuts, and Treemaps
Mapping
• On-campus
– In library spaces
– In other spaces
• Off-campus
– Local
– Far away
• Collaborative or quiet study
• Open stacks, storage, or partner libraries
https://guides.lib.vt.edu/VTechWorksStatistics
Campus Map
https://visualibrarian.wordpress.com/2016/10/07/library-space-assessment-in-
tableau-a-step-by-step-guide-to-custom-polygon-maps-and-dashboard-actions/
Art Traffic at the Louvre
A study of visitors’ behavior using Bluetooth data
http://senseable.mit.edu/louvre/#
https://youtu.be/rRjWaH1QHJU
Time Series Data
• Time of day
• Day of week
• Week number
• Month
• By semester
• During extended hours
• By cyclical periods (exams, spring break, grant
periods)
• Calendar year/fiscal year
• Project tracking
Line Chart
Monthly and Running Total
https://library.buffalo.edu/aboutus/about-the-libraries/factbook/roombooking.html
Highlight Table
Time of Day and Day of Week
Heat Map
Gantt Chart
Numerical
• Total (sum) – items,
dollars, terabytes,
images, feet
• Difference
• Unique counts
• Mean (average)
• Median (middle)
• Mode (most frequently
occurring)
• Percent change
• Percent of total
• Year over year
• Percent capacity
• Distance to goal
• Cost per use
• Other ratios
• Key performance
indicators (KPI)
Bar-in-Bar
Table Data
KPIs
Survey Data
• Satisfaction
• Importance
• Interest
• Skill
• Learning
• Value
Survey Results
https://about.library.ubc.ca/assessment/
Survey Results
Small Multiples
Satisfaction and Importance
https://extremepresentation.typepad.com/blog/2006/09/choosing_a_good.html
https://www.techprevue.com/wp-content/uploads/2016/12/abela-chart-chooser.jpg
Know your audience
Delivering Business Intelligence with Microsoft SQL Server 2016, Fourth Edition by Brain Larson.
Page 16.
Operational Manager
Middle Management
Executive Management
Correlation and Causation
xkcd – a webcomic of romance, sarcasm, math and language
https://xkcd.com/552/
The danger of mixing up causality and correlation: Ionica Smeets at TEDxDelft
https://youtu.be/8B271L3NtAw
Evidence to Establish Causality
• Association
– Is there a relationship, is there a correlation?
– Is x related to y?
• Direction of influence
– Temporal factors (chicken and the egg)
– Does x come first?
• Absence of alternative explanations
– Non-spuriousness
Randomized Controlled Studies
https://hsl.lib.umn.edu/biomed/help/understanding-research-study-designs
Randomized Double Blind
Controlled Studies
Benchmarking
• Benchmarking is a comparison of performance
measures between similar entities and/or
against recognized standards.
• Library benchmarks are typically comparisons
of numerical (quantitative) statistics such as
circulation, visits, and revenues.
https://ivygroup.com/blog/benchmarking-library-performance/
How Benchmarking Works
• Select an aspect, service or process to benchmark
• Identify the key performance metrics
• Choose comparison group to benchmark
• Collect data on performance and practices
• Analyze the data and identify opportunities for
improvement
• Adapt and implement the best practices, setting
reasonable goals and ensuring organizational
acceptance
Examples of Library Benchmarking
• Resource Comparison
– Funding levels
– % of budget on collections or format
– Size and type of staff
• Service models
– Reference service models
– Writing center collaborations
– Learning Commons
– Copyright services
• Reorganization
– Administrative structure
– Department alignments
• Best Practices
– Recruitment and retention
– Improve printing
– Staff training programs
Comparison Groups
• Institutional defined peer group
• Demographics
• Within consortia
• Other characteristics
• Leaders or by reputation
Sources of Benchmarking Data
• Integrated Postsecondary Education Data
System (IPEDS)
• The Association of College and Research Libraries
(ACRL)
• Association of Research Libraries (ARL)
• Standardized surveys (LibQUAL, MISO, Ithaka,
National Survey of Student Engagement (NSSE),
Common Data Set (CDS)
• Email, phone calls and site visits
Data Discomfort
Build a Culture of Assessment
• Takes time
• Transparency with data
• Communication about data use
• Highlight examples of data use
• Build trust
• Data as information not as a judgement
Practices
• Explicitly acknowledge when data is used
– Highlight positive outcomes big and small
• Support data allies and champions
– Honor and recognize data practitioners and
practices
• Normalize everyday data use
– Include data competencies and practices in all job
descriptions
• Communication and transparency
Interpersonal Effectiveness
• Validate and understand concerns
• Acknowledge limitations of data when
appropriate
• Be trustworthy
– Professional credibility
– Personal credibility
• Be reasonable
• Be a leader
• Best change management strategies
Thank you!

Lewellen - Formulating, Interpretation and Presentation of Data