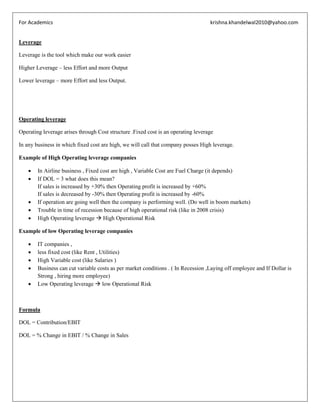
Leverage
•
0 likes•244 views
Financial Management - Leverage For Academics Use For Any queries please contact the email id mentioned in file
Report
Share
Report
Share
Download to read offline

Recommended
Trade-off theory in capital structure
This document provides an outline for a presentation on capital structure and the trade off theory. It introduces the presenters and outlines topics to be covered, including definitions of capital structure and firm value, the trade off theory, benefits and costs of leverage, and balancing costs and benefits to find an optimal capital structure. The trade off theory suggests there is an optimal mix of debt and equity that maximizes firm value by balancing the tax shield benefits of debt against the financial distress costs.
Testing the pecking order theory of capital structure
The paper examines the empirical validity of the pecking order theory of capital structure. It finds mixed support for the theory. While the pecking order works reasonably well for large, established firms in earlier decades, it receives weaker support among smaller, high-growth firms and in later periods like the 1980s-1990s. Equity issues, rather than debt issues, are more closely correlated with financing deficits, contrary to what the theory predicts. Overall, the pecking order theory provides only a partial description of corporate financing behavior.
Capital structure defenition
The document discusses capital structure, which refers to the proportion of debt and equity used to finance a company's assets. An optimal capital structure maximizes share price value and minimizes cost of capital. Factors that affect a company's capital structure include financial risk, growth opportunities, cash flows, and tax policies. Several theories on capital structure are presented, including the Net Income, Net Operating Income, and Modigliani-Miller approaches.
Pecking Order Theory - components
The pecking order theory suggests that firms prefer internal financing over external financing and debt over equity. Under this theory, firms will first use retained earnings to finance projects and needs before considering external funds. If additional funds are needed, firms will take on debt before issuing new equity. The pecking order theory is based on the ideas that internal funds are cheapest, debt is cheaper than equity, and managers have more information about their firm than outside investors.
Static trade off theory or pecking order theory which one suits best to the f...
This document summarizes a research study that investigated factors influencing the capital structure of the leasing sector in Pakistan from 2001-2010. The study found that size of assets had a negative and significant impact on leverage for leasing companies. Liquidity, tangibility, profitability, and capital intensity did not significantly influence leverage. Therefore, the study concluded that Pakistan's leasing sector follows the pecking order theory in determining its capital structure based on these factors. The document provides context on the leasing sector in Pakistan and reviews several other studies on factors influencing capital structure decisions.
Profit analysis and profit policies
The document discusses profit analysis and profit policies. It defines profit as the compensation received by a firm and distinguishes between normal profit needed to remain in business and supernormal profit. Profit analysis simplifies calculations like breakeven analysis and is used for short-term decisions assuming constant costs and revenues. While economic theory advocates for profit maximization, modern businesses aim to maximize profit but also consider other goals like industry leadership, restricting competition, political and consumer impacts, labor relations, financial liquidity, and risk avoidance.
Capital structure
This document discusses capital structure, which refers to the mix of debt and equity used by a company to finance its long-term operations. It raises capital from different sources based on principles that provide the optimal system for maximum returns at minimum cost. The capital structure is influenced by internal factors like business size and nature, and external factors like capital market conditions and taxation policies. The optimal capital structure maximizes company value and minimizes capital costs. There are different theories around capital structure like the net income theory, which suggests maximizing debt to reduce costs, and the net operating income theory, which argues the capital structure mix does not affect overall costs.
Determinants of capitalstructure
1) The document summarizes a research paper that examines the determinants of capital structure for Chinese listed companies using market and accounting data up to 2000.
2) The findings show that leverage is negatively correlated with profitability but positively correlated with firm size, volatility, tangibility, growth, and dividends. Leverage is also negatively correlated with non-debt tax shields and intangibility.
3) These results are consistent with predictions from both the tradeoff theory and pecking order theory of capital structure. Larger, more tangible firms with growth opportunities tend to have higher leverage, while more profitable firms with non-debt tax shields tend to have lower leverage.
Acnts peckin
The document discusses theories of capital structure and financial distress. It explains that the trade-off theory views capital structure as a balance between the tax benefits of debt and costs of financial distress. The pecking order theory states that firms prefer internal financing, then debt, and equity as a last resort, to avoid sending negative signals to investors. The pecking order theory is based on the idea that managers have more information than investors, so equity issuance could be seen as bad news.
Profit
This document defines profit and distinguishes between accounting and economic profit. It states that profit is the reward to owners for taking risks and is the difference between revenue and costs. While accountants view costs as expenses, economists see costs as also including opportunity costs of using resources. Economic profit subtracts normal profit, which is the amount that could be earned elsewhere, from accounting profit. Abnormal profit occurs when economic profit is positive, indicating resources could be better allocated to that good's production. The document encourages testing understanding of these profit concepts through a worksheet task.
Pecking and tradeoff theory
The document discusses two theories of capital structure - the pecking order theory and the trade-off theory. The pecking order theory states that firms prefer internal financing, then debt, and lastly equity if external financing is needed. This is due to problems with adverse selection and managerial preference for internal funds. The trade-off theory views capital structure as a trade-off between tax benefits of debt and costs of financial distress, predicting an optimal debt level where benefits equal costs. The document provides details on both theories and their implications for company financing decisions and performance.
Leverage Ratios | Finance
Leverage ratio is the ratio which states the mixture of debts and equity in the company that is associated with the investments made by the company. Leverage ratio clearly explains the capitals structure of the company which includes equity and debts. Copy the link given below and paste it in new browser window to get more information on Leverage Ratios:- http://www.transtutors.com/homework-help/finance/leverage-ratios.aspx
Agency theory and capital structure
This document summarizes research on the relationship between agency theory and capital structure. Agency theory describes conflicts of interest that can arise between managers, shareholders, and debt holders in a company. These agency costs impact a company's optimal capital structure. The study aims to describe how agency problems influence changes to a company's capital structure and how different financing choices like debt and equity can help optimize capital structure by mitigating agency costs. It discusses how debt can help align manager and shareholder interests while also creating conflicts between managers/shareholders and creditors. The ideal debt level minimizes total agency costs.
Static trade off
This study examines the static trade-off theory and pecking order theory of capital structure using data from 279 companies on the Tehran Stock Exchange over 5 years. The static trade-off theory posits that firms seek an optimal capital structure that balances the costs and benefits of debt, while the pecking order theory states that firms prioritize internal financing and use debt over equity when external funds are needed. The results show that neither theory fully explains the capital structures. However, evidence is found for the static trade-off theory when analyzed by industry, supporting the importance of industry in financing decisions per the pecking order theory. The conclusions differ from some prior studies but are consistent with others that found more support for the static
Business Ratios are Indicators of Company Health
Business ratios are mathematical calculations that provide insights into a company's financial health and performance. Common ratios include profitability, sales to inventory, current, acid test, debt, and debt-to-equity ratios. These ratios allow companies to evaluate their performance over time and compare themselves to industry benchmarks to identify areas for improvement. Calculating and analyzing key financial ratios is an important management tool for understanding a business's fiscal condition.
Financial Ratios - Introduction to Profitability Ratios
The document discusses various profitability ratios that are used to analyze a business's ability to generate earnings compared to expenses, including gross profit ratio, net profit ratio, operating ratio, and operating profit ratio. These ratios are calculated using figures from a company's income statement and balance sheet to evaluate metrics like gross margins, net income, costs of operations, and operating efficiency. Having higher ratio values relative to competitors or previous periods generally indicates better financial performance.
How to analyze profitability
1) The document discusses various methods for analyzing company profitability including margin ratios, break-even analysis, and calculating returns on assets and investment.
2) It provides examples of calculating gross profit margin, operating profit margin, and net profit margin ratios.
3) Break-even analysis examples demonstrate calculating the break-even point for both sales and units sold.
4) Return on assets and return on investment are calculated using the company's net profit, total assets, and net worth.
Determinants of capital structure
This document summarizes a study on the determinants of capital structure in Thailand. The study analyzed data on 144 Thai listed companies from 2000 to 2011 to examine how firm-specific factors like size, profitability, asset tangibility, growth opportunities, and volatility influence a company's leverage ratios. The results showed that leverage ratios increased significantly with firm size but decreased significantly with profitability, in line with trade-off and pecking order theories. However, tangibility, growth, and volatility did not have significant relationships with leverage ratios. Therefore, the study concluded that firm size and profitability are the main determinants of capital structure for companies in Thailand.
Ratio analysis
Ratios are used to analyze various aspects of a business's performance including liquidity, shareholders returns, efficiency, and profitability. Key ratios discussed include the current ratio and acid test ratio for liquidity, dividends per share and dividend yield for shareholders, gearing and asset turnover for efficiency, and gross profit margin, net profit margin, and return on capital employed for profitability. Limitations of ratio analysis include the need to compare ratios over time, between companies, and across industries to fully understand a business's performance.
Theory of Irrelevance of Capital Structure
The document summarizes the theory of irrelevance of capital structure developed by Modigliani and Miller in 1958. It states that under certain assumptions, like no taxes or bankruptcy costs, the value of a firm is unaffected by its capital structure. The theory established that the proportion of debt and equity on a company's balance sheet does not impact its overall valuation. It outlines the assumptions of the theory, provides an example, and notes criticisms of removing real world factors like taxes from the analysis.
Interpreting published accounts
Ratio analysis involves calculating and comparing financial ratios to assess a company's performance and financial position. There are five main types of ratios: liquidity, profitability, efficiency, gearing, and shareholders' ratios. Ratios provide a framework to compare a company's performance over time, between divisions, and against industry peers. However, ratios only show one part of a company's overall situation and financial statements can sometimes be manipulated, so ratio analysis must be considered alongside other information.
Meeting 3 - Profitability Ratios (Financial Reporting and Analysis)
The document discusses various profitability ratios used to analyze a company's financial performance, including:
1. Gross profit margin - Measures profitability after direct costs are subtracted from revenue.
2. Operating profit margin - Accounts for indirect costs in addition to direct costs.
3. Net profit margin - Shows profitability after all expenses including interest and taxes.
4. Return on assets - Measures how efficiently a company uses its assets to generate earnings.
5. Return on equity - Assesses how efficiently a company generates profit relative to shareholders' equity.
Profit maximisation & its alternatives
The document discusses profit maximization and different approaches companies take to maximize profit. It provides two approaches to profit maximization in the short run using total revenue and total cost curves, and marginal revenue and marginal cost curves. Profit is maximized where marginal revenue equals marginal cost. The document also discusses factors that can prevent companies from strictly pursuing profit maximization and alternative objectives companies may pursue like long-run survival, maintaining market share, and managerial utility.
Capital structure and theories
This is a capital structure PowerPoint presentation those who can help to create a ppt see this and create your own ppt
3.4 interpreting published accounts (part 1) - moodle
This document provides an overview of how to interpret published financial accounts using ratio analysis. It discusses liquidity ratios like the current ratio and acid test ratio, which measure a firm's ability to meet short-term obligations. It also covers profitability ratios like gross profit margin, operating profit margin, and return on capital employed, which assess how efficiently a firm generates profits. The document uses examples to demonstrate how to calculate these ratios and interpret the results. It prompts the reader to calculate ratios for a sample company and provides guidance on analyzing the findings.
Financial Ratio analysis Of Gul Ahmed Textile Ltd.
This document analyzes various financial ratios for Gul Ahmed Textile Mill from 2013-2017. It discusses different types of ratios including activity, liquidity, solvency, profitability, valuation, and DuPont ratios. The DuPont analysis breaks down return on equity into its components: net profit margin, total asset turnover, and financial leverage. It finds Gul Ahmed's fluctuating ROE over this period was influenced by multiple changing factors rather than one aspect alone, such as increasing tax burden, unstable interest costs, and lower use of leverage.
capital structure
This document discusses various theories of capital structure and their impact on firm value. It begins by outlining learning objectives around capital structure theories and their relationship to cost of capital and firm value. It then covers the net operating income, traditional, and Modigliani-Miller approaches. It discusses how taxes impact the MM hypotheses and introduces the trade-off theory weighing costs and benefits of leverage. The document also summarizes pecking order theory and approaches to establishing an optimal capital structure.
Business Viability
The document discusses different perspectives on what makes a business viable or able to survive, including economic viability through profitability, social viability through value delivered, and sustainability over time. It examines factors like growth, competition, size, product lifecycles, and protecting a business from threats both internal and external.
Chap006
This document discusses key concepts around a company's financing decision of whether to issue debt or equity. It covers factors to consider like taxes, financial distress, signaling effects, and how financial leverage can increase expected returns but also amplify risk for shareholders. Examples and equations are provided to illustrate how different financing options like debt versus equity impact returns and financial ratios.
More Related Content
What's hot
Acnts peckin
The document discusses theories of capital structure and financial distress. It explains that the trade-off theory views capital structure as a balance between the tax benefits of debt and costs of financial distress. The pecking order theory states that firms prefer internal financing, then debt, and equity as a last resort, to avoid sending negative signals to investors. The pecking order theory is based on the idea that managers have more information than investors, so equity issuance could be seen as bad news.
Profit
This document defines profit and distinguishes between accounting and economic profit. It states that profit is the reward to owners for taking risks and is the difference between revenue and costs. While accountants view costs as expenses, economists see costs as also including opportunity costs of using resources. Economic profit subtracts normal profit, which is the amount that could be earned elsewhere, from accounting profit. Abnormal profit occurs when economic profit is positive, indicating resources could be better allocated to that good's production. The document encourages testing understanding of these profit concepts through a worksheet task.
Pecking and tradeoff theory
The document discusses two theories of capital structure - the pecking order theory and the trade-off theory. The pecking order theory states that firms prefer internal financing, then debt, and lastly equity if external financing is needed. This is due to problems with adverse selection and managerial preference for internal funds. The trade-off theory views capital structure as a trade-off between tax benefits of debt and costs of financial distress, predicting an optimal debt level where benefits equal costs. The document provides details on both theories and their implications for company financing decisions and performance.
Leverage Ratios | Finance
Leverage ratio is the ratio which states the mixture of debts and equity in the company that is associated with the investments made by the company. Leverage ratio clearly explains the capitals structure of the company which includes equity and debts. Copy the link given below and paste it in new browser window to get more information on Leverage Ratios:- http://www.transtutors.com/homework-help/finance/leverage-ratios.aspx
Agency theory and capital structure
This document summarizes research on the relationship between agency theory and capital structure. Agency theory describes conflicts of interest that can arise between managers, shareholders, and debt holders in a company. These agency costs impact a company's optimal capital structure. The study aims to describe how agency problems influence changes to a company's capital structure and how different financing choices like debt and equity can help optimize capital structure by mitigating agency costs. It discusses how debt can help align manager and shareholder interests while also creating conflicts between managers/shareholders and creditors. The ideal debt level minimizes total agency costs.
Static trade off
This study examines the static trade-off theory and pecking order theory of capital structure using data from 279 companies on the Tehran Stock Exchange over 5 years. The static trade-off theory posits that firms seek an optimal capital structure that balances the costs and benefits of debt, while the pecking order theory states that firms prioritize internal financing and use debt over equity when external funds are needed. The results show that neither theory fully explains the capital structures. However, evidence is found for the static trade-off theory when analyzed by industry, supporting the importance of industry in financing decisions per the pecking order theory. The conclusions differ from some prior studies but are consistent with others that found more support for the static
Business Ratios are Indicators of Company Health
Business ratios are mathematical calculations that provide insights into a company's financial health and performance. Common ratios include profitability, sales to inventory, current, acid test, debt, and debt-to-equity ratios. These ratios allow companies to evaluate their performance over time and compare themselves to industry benchmarks to identify areas for improvement. Calculating and analyzing key financial ratios is an important management tool for understanding a business's fiscal condition.
Financial Ratios - Introduction to Profitability Ratios
The document discusses various profitability ratios that are used to analyze a business's ability to generate earnings compared to expenses, including gross profit ratio, net profit ratio, operating ratio, and operating profit ratio. These ratios are calculated using figures from a company's income statement and balance sheet to evaluate metrics like gross margins, net income, costs of operations, and operating efficiency. Having higher ratio values relative to competitors or previous periods generally indicates better financial performance.
How to analyze profitability
1) The document discusses various methods for analyzing company profitability including margin ratios, break-even analysis, and calculating returns on assets and investment.
2) It provides examples of calculating gross profit margin, operating profit margin, and net profit margin ratios.
3) Break-even analysis examples demonstrate calculating the break-even point for both sales and units sold.
4) Return on assets and return on investment are calculated using the company's net profit, total assets, and net worth.
Determinants of capital structure
This document summarizes a study on the determinants of capital structure in Thailand. The study analyzed data on 144 Thai listed companies from 2000 to 2011 to examine how firm-specific factors like size, profitability, asset tangibility, growth opportunities, and volatility influence a company's leverage ratios. The results showed that leverage ratios increased significantly with firm size but decreased significantly with profitability, in line with trade-off and pecking order theories. However, tangibility, growth, and volatility did not have significant relationships with leverage ratios. Therefore, the study concluded that firm size and profitability are the main determinants of capital structure for companies in Thailand.
Ratio analysis
Ratios are used to analyze various aspects of a business's performance including liquidity, shareholders returns, efficiency, and profitability. Key ratios discussed include the current ratio and acid test ratio for liquidity, dividends per share and dividend yield for shareholders, gearing and asset turnover for efficiency, and gross profit margin, net profit margin, and return on capital employed for profitability. Limitations of ratio analysis include the need to compare ratios over time, between companies, and across industries to fully understand a business's performance.
Theory of Irrelevance of Capital Structure
The document summarizes the theory of irrelevance of capital structure developed by Modigliani and Miller in 1958. It states that under certain assumptions, like no taxes or bankruptcy costs, the value of a firm is unaffected by its capital structure. The theory established that the proportion of debt and equity on a company's balance sheet does not impact its overall valuation. It outlines the assumptions of the theory, provides an example, and notes criticisms of removing real world factors like taxes from the analysis.
Interpreting published accounts
Ratio analysis involves calculating and comparing financial ratios to assess a company's performance and financial position. There are five main types of ratios: liquidity, profitability, efficiency, gearing, and shareholders' ratios. Ratios provide a framework to compare a company's performance over time, between divisions, and against industry peers. However, ratios only show one part of a company's overall situation and financial statements can sometimes be manipulated, so ratio analysis must be considered alongside other information.
Meeting 3 - Profitability Ratios (Financial Reporting and Analysis)
The document discusses various profitability ratios used to analyze a company's financial performance, including:
1. Gross profit margin - Measures profitability after direct costs are subtracted from revenue.
2. Operating profit margin - Accounts for indirect costs in addition to direct costs.
3. Net profit margin - Shows profitability after all expenses including interest and taxes.
4. Return on assets - Measures how efficiently a company uses its assets to generate earnings.
5. Return on equity - Assesses how efficiently a company generates profit relative to shareholders' equity.
Profit maximisation & its alternatives
The document discusses profit maximization and different approaches companies take to maximize profit. It provides two approaches to profit maximization in the short run using total revenue and total cost curves, and marginal revenue and marginal cost curves. Profit is maximized where marginal revenue equals marginal cost. The document also discusses factors that can prevent companies from strictly pursuing profit maximization and alternative objectives companies may pursue like long-run survival, maintaining market share, and managerial utility.
Capital structure and theories
This is a capital structure PowerPoint presentation those who can help to create a ppt see this and create your own ppt
3.4 interpreting published accounts (part 1) - moodle
This document provides an overview of how to interpret published financial accounts using ratio analysis. It discusses liquidity ratios like the current ratio and acid test ratio, which measure a firm's ability to meet short-term obligations. It also covers profitability ratios like gross profit margin, operating profit margin, and return on capital employed, which assess how efficiently a firm generates profits. The document uses examples to demonstrate how to calculate these ratios and interpret the results. It prompts the reader to calculate ratios for a sample company and provides guidance on analyzing the findings.
Financial Ratio analysis Of Gul Ahmed Textile Ltd.
This document analyzes various financial ratios for Gul Ahmed Textile Mill from 2013-2017. It discusses different types of ratios including activity, liquidity, solvency, profitability, valuation, and DuPont ratios. The DuPont analysis breaks down return on equity into its components: net profit margin, total asset turnover, and financial leverage. It finds Gul Ahmed's fluctuating ROE over this period was influenced by multiple changing factors rather than one aspect alone, such as increasing tax burden, unstable interest costs, and lower use of leverage.
capital structure
This document discusses various theories of capital structure and their impact on firm value. It begins by outlining learning objectives around capital structure theories and their relationship to cost of capital and firm value. It then covers the net operating income, traditional, and Modigliani-Miller approaches. It discusses how taxes impact the MM hypotheses and introduces the trade-off theory weighing costs and benefits of leverage. The document also summarizes pecking order theory and approaches to establishing an optimal capital structure.
What's hot (20)
Financial Ratios - Introduction to Profitability Ratios
Financial Ratios - Introduction to Profitability Ratios
Meeting 3 - Profitability Ratios (Financial Reporting and Analysis)
Meeting 3 - Profitability Ratios (Financial Reporting and Analysis)
3.4 interpreting published accounts (part 1) - moodle
3.4 interpreting published accounts (part 1) - moodle
Financial Ratio analysis Of Gul Ahmed Textile Ltd.
Financial Ratio analysis Of Gul Ahmed Textile Ltd.
Similar to Leverage
Business Viability
The document discusses different perspectives on what makes a business viable or able to survive, including economic viability through profitability, social viability through value delivered, and sustainability over time. It examines factors like growth, competition, size, product lifecycles, and protecting a business from threats both internal and external.
Chap006
This document discusses key concepts around a company's financing decision of whether to issue debt or equity. It covers factors to consider like taxes, financial distress, signaling effects, and how financial leverage can increase expected returns but also amplify risk for shareholders. Examples and equations are provided to illustrate how different financing options like debt versus equity impact returns and financial ratios.
Chapter 13 pen
This document discusses leverage and capital structure. It defines operating leverage as the use of fixed costs rather than variable costs, which increases business risk when sales decline. Financial leverage refers to the use of debt in the capital structure. While financial leverage can increase expected return on equity if the business' earnings before interest and taxes covers the cost of debt, it also increases risk for equity holders. There is an optimal capital structure that balances the higher expected returns from leverage against the increased financial risk.
Formulae and Ratio Analysis
The document discusses various financial ratios used to analyze a company's profitability, liquidity, efficiency, gearing, and evaluate investments. It provides examples and definitions of key ratios including gross profit margin, net profit margin, current ratio, acid test (quick) ratio, return on capital employed, stock turnover, gearing ratio, and average rate of return.
Seminar 7 evaluating companies with financial metrics
The document provides an overview of evaluating companies using financial metrics and ratios. It discusses key metrics for analyzing income statements, including revenue growth, operating income growth, EPS growth, margins, and comparisons of metrics between companies. It also covers balance sheet metrics like the current ratio, return on equity, return on assets, and debt-to-equity ratio. The document concludes by discussing common valuation metrics like price-to-earnings ratios and how they can be used to evaluate if a stock is cheap or expensive relative to its peers and growth prospects.
Chap012
The document discusses the cost of equity capital and methods for estimating it. It covers estimating beta based on a company's sensitivity to market returns. Determinants of beta include business risk from cyclicality and operating leverage, as well as financial risk from leverage. The weighted average cost of capital incorporates both equity and debt costs. Firms can potentially lower their cost of capital by increasing stock liquidity through greater disclosure, reducing information gaps.
Chap012
The document discusses the cost of equity capital and methods for estimating it. It covers estimating beta based on a firm's sensitivity to market returns. Determinants of beta include business risk from cyclicality and operating leverage, as well as financial risk from leverage. The weighted average cost of capital incorporates both equity and debt costs. Firms can potentially lower their cost of capital by increasing stock liquidity through measures like stock splits and disclosure.
capital structure and leverage
The document discusses capital structure and leverage. It defines operating leverage as using fixed costs which increases business risk when sales decline. Financial leverage is using debt which increases financial risk for stockholders. The optimal capital structure balances higher expected returns from debt against increased risk. Signaling theory suggests firms should use less debt than predicted to avoid signaling effects from stock sales that could lower stock prices.
Imp ratios & there usage
The document discusses various types of ratios used to evaluate companies, including efficiency ratios, liquidity ratios, leverage ratios, and profitability ratios. Efficiency ratios measure how effectively a company uses its assets. Liquidity ratios evaluate a company's ability to meet short-term obligations. Leverage ratios assess how much debt a company has relative to equity. Profitability ratios provide information on a company's margins and returns. Comparing ratios over time and across peers can provide insights into a company's performance and financial health.
Leverage ratios
This document discusses various leverage ratios that can be used to measure how leveraged or indebted a company is. It defines leverage ratios as ratios that measure how much debt a company is using compared to its equity. It then lists some common leverage ratios including debt-equity ratio, interest coverage ratio, debt service coverage ratio, and debt ratio. For each ratio, it provides the formula and an example calculation to illustrate how to use the ratio. The document emphasizes that leverage ratios indicate a company's ability to repay its long-term debts and service the interest on its debt. Too much debt can make a company riskier and more vulnerable to changes in interest rates.
Economis assigignmet 1
This document provides an overview of organizational assessments conducted by Management Systems. It discusses the following:
- The assessment process includes reviewing documents, conducting interviews, and administering surveys to evaluate an organization's strengths and limitations.
- A report is prepared that summarizes findings based on the Pyramid of Organizational Development model, presents survey results, and provides recommendations to build on strengths and address limitations.
- The assessment evaluates an organization's current state and provides a customized evaluation and recommendations to guide its further development.
Capital structure
This document discusses capital structure and the tradeoffs between debt and equity financing. It notes that the two ways for a business to make money are through debt, which requires fixed payments, or equity, where cash flows are left over after debt payments. It then discusses the costs and benefits of using debt, including tax benefits, added management discipline, bankruptcy costs, agency costs, and loss of flexibility. The document analyzes how these factors impact a firm's optimal capital structure and financing decisions.
Fixed cost and operating leverage
This document discusses fixed costs and operating leverage. It defines operating leverage as the degree to which a company incurs fixed costs versus variable costs. Companies with high operating leverage can benefit greatly from increased revenues but are also at risk if revenues decline. The document also discusses financial leverage, which results from fixed financial costs like interest and dividends. It provides examples of how operating and financial leverage can magnify the effects of changes in revenues and earnings. Total leverage considers the combined effects of operating and financial leverage on a company's earnings per share.
Step-by-Step: How To Analyze A Company
The document discusses valuation techniques for businesses and analysis of company financials. It provides examples of how to calculate the value of a business based on earnings, dividends, or required rate of return. It also outlines key areas to analyze for a company including products, markets, competitors, and impact of news/developments. Financial statement analysis techniques are presented for revenue, costs, balance sheet ratios, and interpreting what ratios indicate.
Warren buffett & interpretation of financial statements
Its a summary of Interpretation of Financial Statement. Good for those which are new in Value Investing and want to learn about accounting & Identifying company's with competitive advantage.
Danspresentationnpmaacademy09 12566688864796 Phpapp02
This document discusses measuring performance in pest control businesses. It covers measuring financial performance through profit and loss statements and key ratios. It also discusses measuring marketing, sales, and operational performance through metrics like leads generated, proposals written, jobs completed efficiently. Overall it emphasizes the importance of measurement and data to effectively manage a pest control business for growth.
Value stock drivers
Warren Buffett rarely invests in tech stocks because he often does not understand them, which is outside his area of expertise. Unless an investor understands a company's business model and the drivers of future growth, they risk being blindsided. Fundamental analysis attempts to determine a company's value by focusing on internal factors like finances, management, and products, as well as external factors such as the economy and interest rates, to evaluate growth potential and investment risk. Performing various financial ratio calculations and comparing them over time and between competitors can provide important insights for fundamental investors.
Sources of capital on the basis of ownership & Cost Of Borrowed Capital & Lev...
Operating leverage measures how fixed costs affect operating income with changes in sales. It is calculated as contribution/EBIT and relates to assets. Financial leverage measures how fixed financial charges affect earnings, calculated as OP/PBT and relates to liabilities. Combined leverage considers both operating and financial leverage and their compounding effects on earnings. Leverage allows profits to rise with sales but also increases risk if sales decline.
197.capital structure lecture
This document summarizes key concepts regarding capital structure analysis:
1) EBIT/EPS analysis examines how different capital structures affect earnings available to shareholders and risk based on different levels of EBIT. Leverage increases EPS at high EBIT levels but decreases it at low levels.
2) Debt provides a tax shield benefit as interest payments reduce taxable income. This increases overall returns to investors compared to an unlevered firm.
3) There is a trade-off between the tax benefits of debt and the financial distress and agency costs of debt as leverage increases. Optimal capital structure balances these factors.
4) Practical considerations like industry standards, creditor requirements, maintaining borrowing capacity, and manager
Corporate finance
1. The document discusses key inventory management terms like reorder level, minimum level, maximum level, and average stock level. It defines each term and how they are calculated.
2. It then discusses operating leverage, financial leverage, and combined leverage. Operating leverage is the ability of a firm to use fixed operating costs to impact earnings. Financial leverage is the ability to use fixed financing costs. Combined leverage considers the impact of both.
3. The document provides an example calculation of the leverages. It analyzes the results, finding the firm has low operating and financial leverage but moderate combined leverage, suggesting room to improve individual leverages.
Similar to Leverage (20)
Seminar 7 evaluating companies with financial metrics
Seminar 7 evaluating companies with financial metrics
Warren buffett & interpretation of financial statements
Warren buffett & interpretation of financial statements
Danspresentationnpmaacademy09 12566688864796 Phpapp02
Danspresentationnpmaacademy09 12566688864796 Phpapp02
Sources of capital on the basis of ownership & Cost Of Borrowed Capital & Lev...
Sources of capital on the basis of ownership & Cost Of Borrowed Capital & Lev...
More from Krishna Khandelwal
Interview Techniques - While applying for job
The document provides tips for job applicants on preparing resumes and following up with recruiters. It advises to ensure resumes are free of flaws, tailored to each job, and highlight relevant skills and keywords. Cover letters should specifically address why the applicant fits the role. When following up, timing is important - wait 1-2 weeks before contacting a recruiter, as responses can take longer for junior versus senior roles, and non-responses may mean the applicant is not the top candidate. Recruiters may also keep profiles on file without immediate openings.
Interview Techniques - Before applying for job
Networking through friends and former colleagues is the best way to look for opportunities, rather than randomly searching online or sending unsolicited emails. It is important to have the right skills for the job and understand how your skills align with the company's needs and vision. Candidates should thoroughly review all social media profiles and ensure information is consistent across platforms, as many employers will research candidates online and unprofessional content could deter hiring.
Interview Techniques - After the Interview
Changing expectations after an interview reflects badly on the candidate and increases chances of rejection. Proper market research on prevailing rates for the role and location is important before an interview to avoid expressing unrealistic expectations during negotiations. Candidates should also follow up if not contacted after an interview, thank recruiters for their time, and stay connected on professional networks even if not selected in order to maintain positive relationships.
Interview Techniques - During the interview
This document provides tips for phone interviews and in-person interactions. For phone interviews, candidates should keep an relaxed tone, take notes of their questions, and avoid multitasking. During interactions, candidates should prepare about themselves and the company, do research on the company, remain humble and polite without seeming nervous. Candidates should ask the right questions without dominating the conversation. For in-person interviews, candidates should make eye contact, arrive on time, dress neatly to convey seriousness, avoid unkempt appearance, and remain attentive with an appropriate energy level.
Analysis of Quarterly Results
This document tell you information for how to analyze the quarter results of the company. Quarter results published by company , in which they showcase their performance to shareholders and analyst.
Stocks - Corporate Action
This documents tell about various stocks corporate action such as Rights issue, Bonus Share, Stocks Split, Dividend and Share Buyback.
Portfolio strategy
Different type of strategy followed by investor to invest in stocks market. basically 3 type of strategy generally followed which are Dividend Investing , Buy and Hold Investing and Trend Investing
Economic Moat
An economic moat refers to a company's ability to maintain competitive advantages and protect its profits and market share from competitors over the long run. The document outlines several types of economic moats that can provide advantages, including high switching costs for customers, efficient scaling, low cost production, network effects from larger user bases, and strong intangible assets like patents and trademarks.
Personal Finance
This document talks about how to manage money,do budgeting,tracking expenses and creating investment portfolio.
Financial Derivative
This document tell about Basics of Financial Derivatives.It Focus on Forwards , Futures , Option - Call Option and Put Options, and Swaps
Logistics regression
Logistics Regression
MBA , Business Analysis Problems ,For Academics Use
For any queries contact at below email id
krishna.khandelwal2010@yahoo.com
Multiple Regression
Business Analytics , MBA , Academics use only , Multiple Regression
For Any Queries , Contact at below email id
krishna.khandelwal2010@yahoo.com
Factor Analysis
Factor Analysis Numerical and Solution , MBA , Analytics , Data Analysis , Marketing Analytics , Business Analytics , For Academics use only.
For any Queries
Email me at : krishna.khandelwal2010@yahoo.com
Rupee vs dollar
Weakening Rupee Impact in Indian Economy. Industries which get impact due to weak rupee or strong rupee.
MBA , Placements, Academics Use ,
RBI and Indian Govt Tussle
The document summarizes tensions between the Reserve Bank of India (RBI) and the Indian government over several issues: interest rates, dividend payments, loan restructuring, regulation of public sector banks, corrective action for struggling banks, payments regulation, board appointments, liquidity support for non-banking financial companies, foreign exchange reserves, and more. Key points of contention have been the RBI's refusal to cut interest rates as desired by the government, lower than expected dividend payments from the RBI to the government, and the RBI's regulatory actions around struggling banks which put pressure on the government.
Organizational behaviour 02
Contact me if you need to help
Email: krishna.khandelwal2010@yahoo.com
LinkedIn: https://www.linkedin.com/in/krishna-khandelwal-57656a85/
Organizational behaviour 01
Contact me if you need to any help
Email: krishna.khandelwal2010@yahoo.com
LinkedIn: https://www.linkedin.com/in/krishna-khandelwal-57656a85/
Information System for Managers
Contact me if you need any help regarding the Document
Email: krishna.khandelwal2010@yahoo.com
LinkedIn: https://www.linkedin.com/in/krishna-khandelwal-57656a85/
Consumer market
Contact me if you need any help
Email: krishna.khandelwal2010@yahoo.com
LinkedIn: https://www.linkedin.com/in/krishna-khandelwal-57656a85/
Marketing Management - Pricing
Contact me if you need any help
Email: krishna.khandelwal2010@yahoo.com
LinkedIn: https://www.linkedin.com/in/krishna-khandelwal-57656a85/
More from Krishna Khandelwal (20)
Recently uploaded
KYC Compliance: A Cornerstone of Global Crypto Regulatory Frameworks
This presentation explores the pivotal role of KYC compliance in shaping and enforcing global regulations within the dynamic landscape of cryptocurrencies. Dive into the intricate connection between KYC practices and the evolving legal frameworks governing the crypto industry.
1比1复刻(ksu毕业证书)美国堪萨斯州立大学毕业证本科文凭证书原版一模一样
原版定制【微信:bwp0011】《(ksu毕业证书)美国堪萨斯州立大学毕业证本科文凭证书》【微信:bwp0011】成绩单 、雅思、外壳、留信学历认证永久存档查询,采用学校原版纸张、特殊工艺完全按照原版一比一制作(包括:隐形水印,阴影底纹,钢印LOGO烫金烫银,LOGO烫金烫银复合重叠,文字图案浮雕,激光镭射,紫外荧光,温感,复印防伪)行业标杆!精益求精,诚心合作,真诚制作!多年品质 ,按需精细制作,24小时接单,全套进口原装设备,十五年致力于帮助留学生解决难题,业务范围有加拿大、英国、澳洲、韩国、美国、新加坡,新西兰等学历材料,包您满意。
【业务选择办理准则】
一、工作未确定,回国需先给父母、亲戚朋友看下文凭的情况,办理一份就读学校的毕业证【微信bwp0011】文凭即可
二、回国进私企、外企、自己做生意的情况,这些单位是不查询毕业证真伪的,而且国内没有渠道去查询国外文凭的真假,也不需要提供真实教育部认证。鉴于此,办理一份毕业证【微信bwp0011】即可
三、进国企,银行,事业单位,考公务员等等,这些单位是必需要提供真实教育部认证的,办理教育部认证所需资料众多且烦琐,所有材料您都必须提供原件,我们凭借丰富的经验,快捷的绿色通道帮您快速整合材料,让您少走弯路。
留信网认证的作用:
1:该专业认证可证明留学生真实身份
2:同时对留学生所学专业登记给予评定
3:国家专业人才认证中心颁发入库证书
4:这个认证书并且可以归档倒地方
5:凡事获得留信网入网的信息将会逐步更新到个人身份内,将在公安局网内查询个人身份证信息后,同步读取人才网入库信息
6:个人职称评审加20分
7:个人信誉贷款加10分
8:在国家人才网主办的国家网络招聘大会中纳入资料,供国家高端企业选择人才
【关于价格问题(保证一手价格)】
我们所定的价格是非常合理的,而且我们现在做得单子大多数都是代理和回头客户介绍的所以一般现在有新的单子 我给客户的都是第一手的代理价格,因为我想坦诚对待大家 不想跟大家在价格方面浪费时间
对于老客户或者被老客户介绍过来的朋友,我们都会适当给一些优惠。
TechnoXander Confirmation of Payee Product Pack 1.pdf
Confirmation of Payee (CoP) is a vital security measure adopted by financial institutions and payment service providers. Its core purpose is to confirm that the recipient’s name matches the information provided by the sender during a banking transaction, ensuring that funds are transferred to the correct payment account.
Confirmation of Payee was built to tackle the increasing numbers of APP Fraud and in the landscape of UK banking, the spectre of APP fraud looms large. In 2022, over £1.2 billion was stolen by fraudsters through authorised and unauthorised fraud, equivalent to more than £2,300 every minute. This statistic emphasises the urgent need for robust security measures like CoP. While over £1.2 billion was stolen through fraud in 2022, there was an eight per cent reduction compared to 2021 which highlights the positive outcomes obtained from the implementation of Confirmation of Payee. The number of fraud cases across the UK also decreased by four per cent to nearly three million cases during the same period; latest statistics from UK Finance.
In essence, Confirmation of Payee plays a pivotal role in digital banking, guaranteeing the flawless execution of banking transactions. It stands as a guardian against fraud and misallocation, demonstrating the commitment of financial institutions to safeguard their clients’ assets. The next time you engage in a banking transaction, remember the invaluable role of CoP in ensuring the security of your financial interests.
For more details, you can visit https://technoxander.com.
BIHC Briefing June 2024 from Bank+Insurance Hybrid Capital in association wit...
Our latest market and regulatory coverage and analysis
TEST BANK Principles of cost accounting 17th edition edward j vanderbeck mari...
TEST BANK Principles of cost accounting 17th edition edward j vanderbeck maria r mitchell.docx
TEST BANK Principles of cost accounting 17th edition edward j vanderbeck maria r mitchell.docx
TEST BANK Principles of cost accounting 17th edition edward j vanderbeck maria r mitchell.docx
Independent Study - College of Wooster Research (2023-2024)
"Does Foreign Direct Investment Negatively Affect Preservation of Culture in the Global South? Case Studies in Thailand and Cambodia."
Do elements of globalization, such as Foreign Direct Investment (FDI), negatively affect the ability of countries in the Global South to preserve their culture? This research aims to answer this question by employing a cross-sectional comparative case study analysis utilizing methods of difference. Thailand and Cambodia are compared as they are in the same region and have a similar culture. The metric of difference between Thailand and Cambodia is their ability to preserve their culture. This ability is operationalized by their respective attitudes towards FDI; Thailand imposes stringent regulations and limitations on FDI while Cambodia does not hesitate to accept most FDI and imposes fewer limitations. The evidence from this study suggests that FDI from globally influential countries with high gross domestic products (GDPs) (e.g. China, U.S.) challenges the ability of countries with lower GDPs (e.g. Cambodia) to protect their culture. Furthermore, the ability, or lack thereof, of the receiving countries to protect their culture is amplified by the existence and implementation of restrictive FDI policies imposed by their governments.
My study abroad in Bali, Indonesia, inspired this research topic as I noticed how globalization is changing the culture of its people. I learned their language and way of life which helped me understand the beauty and importance of cultural preservation. I believe we could all benefit from learning new perspectives as they could help us ideate solutions to contemporary issues and empathize with others.
Discover the Future of Dogecoin with Our Comprehensive Guidance
Learn in-depth about Dogecoin's trajectory and stay informed with 36crypto's essential and up-to-date information about the crypto space.
Our presentation delves into Dogecoin's potential future, exploring whether it's destined to skyrocket to the moon or face a downward spiral. In addition, it highlights invaluable insights. Don't miss out on this opportunity to enhance your crypto understanding!
https://36crypto.com/the-future-of-dogecoin-how-high-can-this-cryptocurrency-reach/
falcon-invoice-discounting-a-premier-investment-platform-for-superior-returns...
falcon-invoice-discounting-a-premier-investment-platform-for-superior-returns...Falcon Invoice Discounting
Falcon stands out as a top-tier P2P Invoice Discounting platform in India, bridging esteemed blue-chip companies and eager investors. Our goal is to transform the investment landscape in India by establishing a comprehensive destination for borrowers and investors with diverse profiles and needs, all while minimizing risk. What sets Falcon apart is the elimination of intermediaries such as commercial banks and depository institutions, allowing investors to enjoy higher yields.Accounting Information Systems (AIS).pptx
An accounting information system (AIS) refers to tools and systems designed for the collection and display of accounting information so accountants and executives can make informed decisions.
Governor Olli Rehn: Inflation down and recovery supported by interest rate cu...
Governor Olli Rehn
Bank of Finland
Press conference on the outlook for the Finnish economy
Helsinki, 11 June 2024
Fabular Frames and the Four Ratio Problem
Digital, interactive art showing the struggle of a society in providing for its present population while also saving planetary resources for future generations. Spread across several frames, the art is actually the rendering of real and speculative data. The stereographic projections change shape in response to prompts and provocations. Visitors interact with the model through speculative statements about how to increase savings across communities, regions, ecosystems and environments. Their fabulations combined with random noise, i.e. factors beyond control, have a dramatic effect on the societal transition. Things get better. Things get worse. The aim is to give visitors a new grasp and feel of the ongoing struggles in democracies around the world.
Stunning art in the small multiples format brings out the spatiotemporal nature of societal transitions, against backdrop issues such as energy, housing, waste, farmland and forest. In each frame we see hopeful and frightful interplays between spending and saving. Problems emerge when one of the two parts of the existential anaglyph rapidly shrinks like Arctic ice, as factors cross thresholds. Ecological wealth and intergenerational equity areFour at stake. Not enough spending could mean economic stress, social unrest and political conflict. Not enough saving and there will be climate breakdown and ‘bankruptcy’. So where does speculative design start and the gambling and betting end? Behind each fabular frame is a four ratio problem. Each ratio reflects the level of sacrifice and self-restraint a society is willing to accept, against promises of prosperity and freedom. Some values seem to stabilise a frame while others cause collapse. Get the ratios right and we can have it all. Get them wrong and things get more desperate.
一比一原版宾夕法尼亚大学毕业证(UPenn毕业证书)学历如何办理
挂科购买【微信号:176555708】【挂科购买(UPenn毕业证书)】【微信号:176555708】《成绩单、外壳、offer、真实留信官方学历认证(永久存档/真实可查)》采用学校原版纸张、特殊工艺完全按照原版一比一制作(包括:隐形水印,阴影底纹,钢印LOGO烫金烫银,LOGO烫金烫银复合重叠,文字图案浮雕,激光镭射,紫外荧光,温感,复印防伪)行业标杆!精益求精,诚心合作,真诚制作!多年品质 ,按需精细制作,24小时接单,全套进口原装设备,十五年致力于帮助留学生解决难题,业务范围有加拿大、英国、澳洲、韩国、美国、新加坡,新西兰等学历材料,包您满意。
【我们承诺采用的是学校原版纸张(纸质、底色、纹路)我们拥有全套进口原装设备,特殊工艺都是采用不同机器制作,仿真度基本可以达到100%,所有工艺效果都可提前给客户展示,不满意可以根据客户要求进行调整,直到满意为止!】
【业务选择办理准则】
一、工作未确定,回国需先给父母、亲戚朋友看下文凭的情况,办理一份就读学校的毕业证【微信号:176555708】文凭即可
二、回国进私企、外企、自己做生意的情况,这些单位是不查询毕业证真伪的,而且国内没有渠道去查询国外文凭的真假,也不需要提供真实教育部认证。鉴于此,办理一份毕业证【微信号:176555708】即可
三、进国企,银行,事业单位,考公务员等等,这些单位是必需要提供真实教育部认证的,办理教育部认证所需资料众多且烦琐,所有材料您都必须提供原件,我们凭借丰富的经验,快捷的绿色通道帮您快速整合材料,让您少走弯路。
留信网认证的作用:
1:该专业认证可证明留学生真实身份
2:同时对留学生所学专业登记给予评定
3:国家专业人才认证中心颁发入库证书
4:这个认证书并且可以归档倒地方
5:凡事获得留信网入网的信息将会逐步更新到个人身份内,将在公安局网内查询个人身份证信息后,同步读取人才网入库信息
6:个人职称评审加20分
7:个人信誉贷款加10分
8:在国家人才网主办的国家网络招聘大会中纳入资料,供国家高端企业选择人才
留信网服务项目:
1、留学生专业人才库服务(留信分析)
2、国(境)学习人员提供就业推荐信服务
3、留学人员区块链存储服务
【关于价格问题(保证一手价格)】
我们所定的价格是非常合理的,而且我们现在做得单子大多数都是代理和回头客户介绍的所以一般现在有新的单子 我给客户的都是第一手的代理价格,因为我想坦诚对待大家 不想跟大家在价格方面浪费时间
对于老客户或者被老客户介绍过来的朋友,我们都会适当给一些优惠。
选择实体注册公司办理,更放心,更安全!我们的承诺:客户在留信官方认证查询网站查询到认证通过结果后付款,不成功不收费!
一比一原版(cwu毕业证书)美国中央华盛顿大学毕业证如何办理
原版一模一样【微信:741003700 】【(cwu毕业证书)美国中央华盛顿大学毕业证成绩单】【微信:741003700 】学位证,留信认证(真实可查,永久存档)原件一模一样纸张工艺/offer、雅思、外壳等材料/诚信可靠,可直接看成品样本,帮您解决无法毕业带来的各种难题!外壳,原版制作,诚信可靠,可直接看成品样本。行业标杆!精益求精,诚心合作,真诚制作!多年品质 ,按需精细制作,24小时接单,全套进口原装设备。十五年致力于帮助留学生解决难题,包您满意。
本公司拥有海外各大学样板无数,能完美还原。
1:1完美还原海外各大学毕业材料上的工艺:水印,阴影底纹,钢印LOGO烫金烫银,LOGO烫金烫银复合重叠。文字图案浮雕、激光镭射、紫外荧光、温感、复印防伪等防伪工艺。材料咨询办理、认证咨询办理请加学历顾问Q/微741003700
【主营项目】
一.毕业证【q微741003700】成绩单、使馆认证、教育部认证、雅思托福成绩单、学生卡等!
二.真实使馆公证(即留学回国人员证明,不成功不收费)
三.真实教育部学历学位认证(教育部存档!教育部留服网站永久可查)
四.办理各国各大学文凭(一对一专业服务,可全程监控跟踪进度)
如果您处于以下几种情况:
◇在校期间,因各种原因未能顺利毕业……拿不到官方毕业证【q/微741003700】
◇面对父母的压力,希望尽快拿到;
◇不清楚认证流程以及材料该如何准备;
◇回国时间很长,忘记办理;
◇回国马上就要找工作,办给用人单位看;
◇企事业单位必须要求办理的
◇需要报考公务员、购买免税车、落转户口
◇申请留学生创业基金
留信网认证的作用:
1:该专业认证可证明留学生真实身份
2:同时对留学生所学专业登记给予评定
3:国家专业人才认证中心颁发入库证书
4:这个认证书并且可以归档倒地方
5:凡事获得留信网入网的信息将会逐步更新到个人身份内,将在公安局网内查询个人身份证信息后,同步读取人才网入库信息
6:个人职称评审加20分
7:个人信誉贷款加10分
8:在国家人才网主办的国家网络招聘大会中纳入资料,供国家高端企业选择人才
办理(cwu毕业证书)美国中央华盛顿大学毕业证【微信:741003700 】外观非常简单,由纸质材料制成,上面印有校徽、校名、毕业生姓名、专业等信息。
办理(cwu毕业证书)美国中央华盛顿大学毕业证【微信:741003700 】格式相对统一,各专业都有相应的模板。通常包括以下部分:
校徽:象征着学校的荣誉和传承。
校名:学校英文全称
授予学位:本部分将注明获得的具体学位名称。
毕业生姓名:这是最重要的信息之一,标志着该证书是由特定人员获得的。
颁发日期:这是毕业正式生效的时间,也代表着毕业生学业的结束。
其他信息:根据不同的专业和学位,可能会有一些特定的信息或章节。
办理(cwu毕业证书)美国中央华盛顿大学毕业证【微信:741003700 】价值很高,需要妥善保管。一般来说,应放置在安全、干燥、防潮的地方,避免长时间暴露在阳光下。如需使用,最好使用复印件而不是原件,以免丢失。
综上所述,办理(cwu毕业证书)美国中央华盛顿大学毕业证【微信:741003700 】是证明身份和学历的高价值文件。外观简单庄重,格式统一,包括重要的个人信息和发布日期。对持有人来说,妥善保管是非常重要的。
Seeman_Fiintouch_LLP_Newsletter_Jun_2024.pdf
The Impact of the 2024 Indian
Election Beyond Borders
01. Investment Gyan
02. Market Update
03. Inspiration investment story
Recently uploaded (20)
KYC Compliance: A Cornerstone of Global Crypto Regulatory Frameworks
KYC Compliance: A Cornerstone of Global Crypto Regulatory Frameworks
TechnoXander Confirmation of Payee Product Pack 1.pdf
TechnoXander Confirmation of Payee Product Pack 1.pdf
BIHC Briefing June 2024 from Bank+Insurance Hybrid Capital in association wit...
BIHC Briefing June 2024 from Bank+Insurance Hybrid Capital in association wit...
TEST BANK Principles of cost accounting 17th edition edward j vanderbeck mari...
TEST BANK Principles of cost accounting 17th edition edward j vanderbeck mari...
Independent Study - College of Wooster Research (2023-2024)
Independent Study - College of Wooster Research (2023-2024)
Discover the Future of Dogecoin with Our Comprehensive Guidance
Discover the Future of Dogecoin with Our Comprehensive Guidance
falcon-invoice-discounting-a-premier-investment-platform-for-superior-returns...
falcon-invoice-discounting-a-premier-investment-platform-for-superior-returns...
Governor Olli Rehn: Inflation down and recovery supported by interest rate cu...
Governor Olli Rehn: Inflation down and recovery supported by interest rate cu...
Power point analisis laporan keuangan chapter 7 subramanyam
Power point analisis laporan keuangan chapter 7 subramanyam
Importance of community participation in development projects.pdf
Importance of community participation in development projects.pdf
Leverage
- 1. For Academics krishna.khandelwal2010@yahoo.com Leverage Leverage is the tool which make our work easier Higher Leverage – less Effort and more Output Lower leverage – more Effort and less Output. Operating leverage Operating leverage arises through Cost structure .Fixed cost is an operating leverage In any business in which fixed cost are high, we will call that company posses High leverage. Example of High Operating leverage companies In Airline business , Fixed cost are high , Variable Cost are Fuel Charge (it depends) If DOL = 3 what does this mean? If sales is increased by +30% then Operating profit is increased by +60% If sales is decreased by -30% then Operating profit is increased by -60% If operation are going well then the company is performing well. (Do well in boom markets) Trouble in time of recession because of high operational risk (like in 2008 crisis) High Operating leverage High Operational Risk Example of low Operating leverage companies IT companies , less fixed cost (like Rent , Utilities) High Variable cost (like Salaries ) Business can cut variable costs as per market conditions . ( In Recession ,Laying off employee and If Dollar is Strong , hiring more employee) Low Operating leverage low Operational Risk Formula DOL = Contribution/EBIT DOL = % Change in EBIT / % Change in Sales
- 2. For Academics krishna.khandelwal2010@yahoo.com Financial leverage Financial leverage arises through Capital structure. Depend on portion of Debt and Equity is financial leverage. If the loan amount is high that means business is using someone else money business is putting less effort and they can get more output . Hence, company posses high financial leverage. Example of High Financial leverage companies In Real Estate ,Companies usually Take loan to build Flat. They take loan from Bank and make, due to which they make good returns. If ROI > Interest : Company can grow very Fast.(under good market condition) Let assume ROI (Return on Investment is 15% ) and bank gave loan at 12% .This means Company is earning 3% profit If ROI < Interest : Company may not grow Fast.(under bad market condition) High Financial leverage Higher Solvency Risk ( higher chance of Bankruptcy) Example of low Financial leverage companies In IT Companies or Product development, they have zero or low debt Companies can survive with low ROI as well Interest = 0 ROI = 6% Any way you are making profit. Formula DFL = EBIT/PBT DFL = % Change in EPS / % Change in EBIT