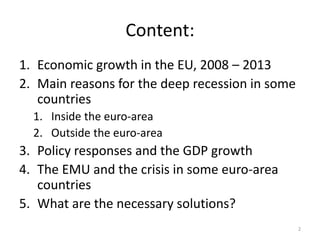
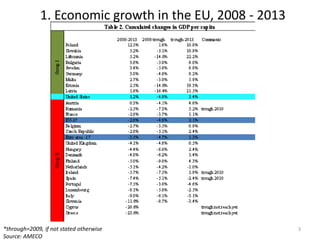
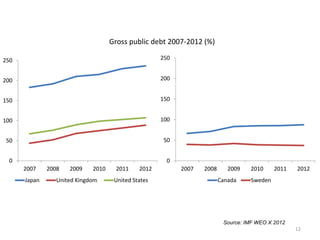
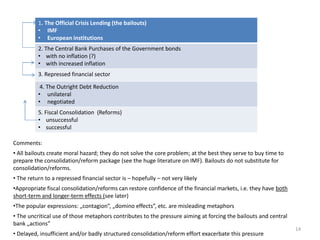
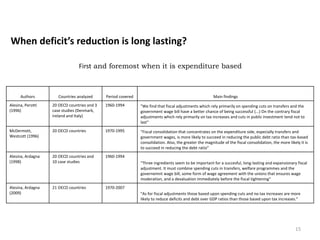
Euro: problems and solutions* 
Leszek Balcerowicz 
Warsaw School of Economics 
November 2014 
*I am grateful to Aleksander Łaszek, Marek Tatała and Dawid Samoń for their 
assistance in preparing this presentation.
Content: 
1. Economic growth in the EU, 2008 – 2013 
2. Main reasons for the deep recession in some 
countries 
1. Inside the euro-area 
2. Outside the euro-area 
3. Policy responses and the GDP growth 
4. The EMU and the crisis in some euro-area 
countries 
5. What are the necessary solutions? 
2
1. Economic growth in the EU, 2008 - 2013 
*through=2009, if not stated otherwise 
Source: AMECO 
3
2.1. Main reasons for the deep 
recession in euro-area countries 
4
Two types of crises which include the fiscal crises (Sovereign 
Debt Distress) in the market economies 
A. The financial (banking) crisis fiscal crisis 
B. The fiscal crisis the financial (banking) 
crisis 
5
Figure 1. The dynamics of the Financial-Fiscal Crisis 
Wrong policies 
Vs. 
Inherant instability of the 
markets? 
Private sector 
boom 
The bust 
The recession 
The financial crisis 
The fiscal 
problems 
Inflated tax revenues 
2001 2002 2003 2004 2005 2006 2007 2008 2009 2010 
Household loans 
to GDP 
Ireland 49,62% 54,79% 62,59% 72,70% 85,99% 94,41% 101,70% 112,55% 123,28% 118,89% 
Spain 48,14% 52,08% 57,61% 64,41% 71,87% 79,22% 83,24% 83,92% 86,43% 85,69% 
United Kingdom 74,89% 76,15% 82,73% 87,53% 92,55% 98,34% 92,81% 84,45% 103,68% 99,16% 
Property price 
index 
Ireland 60,6 64,9 74,1 82,4 88,5 100,5 100,0 90,9 78,5 66,3 
Spain 47,0 54,4 64,0 75,2 85,6 94,6 100,0 100,7 93,2 89,6 
United Kingdom 50,3 63,0 72,8 82,9 85,6 93,5 100,0 85,3 88,1 88,6 
Source: Eurostat, ECB, Nationwide 
6
Policies which contribute to financial crises 
My reading of the empirical literature on the causes of the financial crises leads me to the following list of policies which 
contribute to the financial crises: 
1. Politicized (or state-directed) credit allocation: it is usually driven by political considerations which dominate the economic risk 
assessment and, thus, leads to large banking losses and/or to Sovereign debt distress. The activity of Fannie May and Freddie 
Mac in the US is the recent example. 
2. Persistently expansionary fiscal policy: it contributes to spending booms and may also result in the banking losses and in the 
public debt problems. 
3. Monetary policy which occasionally leans “with the wind”, i.e. fuels asset bubbles (Fed’s policy in the 2000s being the main 
recent example). It has been linked to a doctrine of monetary policy which narrows its goal to the short-term CPJ inflation, 
and excludes from its purview asset price developments and the related factors (e.g. the growth of monetary and credit 
aggregates). 
4. Tax regulations which favour debt financing relative to equity finance. 
5. Subsidies to mortgage borrowing. 
6. Financial regulations which encouraged excessive securitization, e.g. the risk-weights contained in Basel 1 and the mandatory 
use of credit rating by the financial investors. 
7. Generous deposit insurance which eliminates an important source of market discipline. 
8. Regulations which limit the shareholders concentration in large banks and thus increase the agency problems and weaken 
market discipline (Calomiris, 2009a). This may be an important source of the managers compensation schemes which favour 
short-term gains and disregard longer –term risks. 
9. Policies which have resulted in the “too big to fail” syndrome, i.e. financial markets’ subsidization – vía reduced risk premiums – 
of the large financial conglomerates. This is another important instance of public interventions which weaken the market 
discipline. The resulting concentration, in the face of the financial crisis, exerts an enormous pressure upon the decision-makers 
to bail-out large financial companies again, thus creating a sort of a vicious circle. The policies in question included an 
easy acceptance of the mergers of already huge financial companies and an easy-money policy which fuelled the growth of 
already large financial conglomerates. 
7
Figure 2. The dynamics of Fiscal- Financial Crisis 
•The destructive 
political competition 
•Weak constraint on 
the government 
The systematic 
over-spending 
(welfare spending, 
government 
consumption) 
Windfall gains 
•Discovery of gas etc. (the 
Netherlands in the 1970s) 
•Lowering of the interest rates 
(Greece, Portugal, Spain, Italy) 
Slow growth due to the worsening 
institutional system 
•Falling employment and/or increasing 
structural unemployment 
•Anti-market or anticompetitive regulations 
•Growing public sector 
Problems in 
financial sector 
The fiscal 
problems 
sometimes sometimes 
1990 1995 2000 2005 2006 2007 2008 2009 2010 
Greece 
General government total 
expenditure 43,43 43,17 46,64 44,60 45,21 47,61 50,60 53,81 50,20 
General government net 
lending/borrowing -14,51 -6,99 -3,69 -5,64 -6,03 -6,80 -9,91 -15,56 -10,50 
General government net debt 64,22 66,40 77,41 101,21 107,33 107,45 112,62 128,95 144,55 
Portugal 
General government total 
expenditure 39,26 39,66 39,29 46,56 44,34 44,36 44,80 49,76 51,26 
General government net 
lending/borrowing -5,06 -3,41 -1,09 -6,49 -3,75 -3,21 -3,70 -10,17 -9,84 
8 
General government net debt n/a n/a 41,97 57,75 58,56 63,66 67,38 79,03 88,89 
Source: IMF
Italy: high public debt and long-term economic stagnation 
10 
8 
6 
4 
2 
0 
-2 
-4 
-6 
-8 
140 
120 
100 
80 
60 
40 
20 
0 
in % of GDP in % 
1961 
1963 
1965 
1967 
1969 
1971 
1973 
1975 
1977 
1979 
1981 
1983 
1985 
1987 
1989 
1991 
1993 
1995 
1997 
1999 
2001 
2003 
2005 
2007 
2009 
2011 
Public debt (left scale) GDP per capita growth (right scale) 
Trend line (GDP growth) 
Sources: IMF and Ameco (2013)9
2.2. Recent crises outside the 
eurozone 
10
GDP growth 2007-2012 (%) 
Source: IMF WEO X 2012 
11 
8 
6 
4 
2 
0 
-2 
-4 
-6 
-8 
2007 2008 2009 2010 2011 2012 
Japan United Kingdom United States 
8 
6 
4 
2 
0 
-2 
-4 
-6 
-8 
2007 2008 2009 2010 2011 2012 
Canada Sweden
Gross public debt 2007-2012 (%) 
Source: IMF WEO X 2012 
12 
250 
200 
150 
100 
50 
0 
2007 2008 2009 2010 2011 2012 
Japan United Kingdom United States 
250 
200 
150 
100 
50 
0 
2007 2008 2009 2010 2011 2012 
Canada Sweden
3. Policy responses and the GDP 
growth 
13
1. The Official Crisis Lending (the bailouts) 
• IMF 
• European institutions 
2. The Central Bank Purchases of the Government bonds 
• with no inflation (?) 
• with increased inflation 
3. Repressed financial sector 
4. The Outright Debt Reduction 
• unilateral 
• negotiated 
5. Fiscal Consolidation (Reforms) 
• unsuccessful 
• successful 
14 
Comments: 
• All bailouts create moral hazard; they do not solve the core problem; at the best they serve to buy time to 
prepare the consolidation/reform package (see the huge literature on IMF). Bailouts do not substitute for 
consolidation/reforms. 
• The return to a repressed financial sector is – hopefully – not very likely 
•Appropriate fiscal consolidation/reforms can restore confidence of the financial markets, i.e. they have both 
short-term and longer-term effects (see later) 
•The popular expressions: „contagion”, „domino effects”, etc. are misleading metaphors 
• The uncritical use of those metaphors contributes to the pressure aiming at forcing the bailouts and central 
bank „actions” 
• Delayed, insufficient and/or badly structured consolidation/reform effort exacerbate this pressure
When deficit’s reduction is long lasting? 
First and foremost when it is expenditure based 
Authors Countries analyzed Period covered Main findings 
Alesina, Perotti 
(1996) 
20 OECD countries and 3 
case studies (Denmark, 
Ireland and Italy) 
1960-1994 "We find that fiscal adjustments which rely primarily on spending cuts on transfers and the 
government wage bill have a better chance of being successful (...) On the contrary fiscal 
adjustments which rely primarily on tax increases and cuts in public investment tend not to 
last" 
McDermott, 
Westcott (1996) 
20 OECD countries 1970-1995 "Fiscal consolidation that concentrates on the expenditure side, especially transfers and 
government wages, is more likely to succeed in reducing the public debt ratio than tax-based 
consolidation. Also, the greater the magnitude of the fiscal consolidation, the more likely it is 
to succeed in reducing the debt ratio" 
Alesina, Ardagna 
(1998) 
20 OECD countries and 
10 case studies 
1960-1994 
"Three ingredients seem to be important for a succesful, long-lasting and expansionary fiscal 
adjustment. It must combine spending cuts in transfers, welfare programmes and the 
governemnt wage bill, some form of wage agreement with the unions that ensures wage 
moderation, and a devaluation immediately before the fiscal tightening" 
Alesina, Ardagna 
(2009) 
21 OECD countries 1970-2007 
"As for fiscal adjustments those based upon spending cuts and no tax increases are more 
likely to reduce deficits and debt over GDP ratios than those based upon tax increases." 
15
Authors 
Countries 
analyzed 
Period 
covered Main findings 
Hagen von, 
Hallett, 
Strauch 
(2002) 
20 OECD 
countries 
1960–1998 
"(...) the likelihood of sustained consolidation efforts rises when governments tackle politically sensitive items on the 
budget, such as transfers, subsidies, and government wages. Switching strategies that start with rising taxes and later 
switching to reduced spending does not produce better results than consistently expenditure-based consolidations. Our 
analysis also indicates that consolidation fatigue is an important element which policymakers should take into account, 
since they are strongly time-dependent. Finally, the economic conditions at the start of and during the fiscal 
consolidation matter. A high debt–GDP ratio and fiscal tightening in other OECD countries raise the likelihood of 
consolidations to persist. In addition, a weak but recovering domestic economy contributes to the longevity of 
consolidations." 
Guichard, 
Kennedy, 
Wurzel, André 
(2007) 
24 OECD 
countries 
1978-2003 
"Large initial deficits and high interest rates have been important in prompting fiscal adjustment and also in boosting the 
overall size and duration of consolidation. Concerning the quality of fiscal policies, an emphasis on cutting current 
expenditures has been associated with overall larger consolidation. Fiscal rules with embedded expenditure targets 
tended to be associated with larger and longer adjustments, pointing to institutional features playing a potentially 
important role in generating successful consolation efforts. Experience across countries also shows that certain design 
features such as transparency, flexibility to face shocks and effective enforcement mechanisms seem important for the 
effectiveness of fiscal rules" 
Barrios, 
Langedijk, 
Pench (2010) 
EU27 and 8 
non EU OECD 
countries 
1970-2008 
"(i) in presence of a systemic financial crisis, the repair of the banking sector is a pre-condition for a fiscal consolidation 
to succeed in reducing debt levels, especially so when fiscal consolidations are sharp (ii) even after the banking sector is 
repaired, fiscal consolidations are usually less successful than in absence of financial crises, although more vigorous fiscal 
consolidations (i.e. cold shower) tend to yield higher results (iii) current debt dynamics in the EU are very unfavourable 
and in some cases, coupled with rising debt servicing costs and much deteriorated growth outlook warranting 
differentiated consolidation strategies across EU countries (iv) We do not find conclusive evidence in support of 
exchange rates (including real exchange rate) depreciation/devaluation as enhancing the success of fiscal consolidation 
as their effect appear to be low and insignificant." 
16
Under certain conditions fiscal consolidation may turn out to be 
expansionary. Theory indicates a number of channels through which fiscal 
adjustment may lead to such non-Keynesian effects 
Studies, in general, confirm that the non-Keynesian effects of fiscal consolidation are more likely to 
17 
occur, when: 
• public debt before fiscal consolidation is high or fast growing rather than low and 
slowly growing; 
• fiscal consolidation is of large size and long lasting; 
• deficit is reduced through cuts in expenditure rather than via tax increases; 
• fiscal consolidation is focused on wages and salaries in public sector and on 
transfers to households; 
• fiscal consolidation is introduced in an open economy.
18 
Non- Keynesian effects 
Authors 
Date of 
publication Countries analysed Period coveredMain findings 
Giavazzi F., 
Pagano M. 1996 
19 OECD 
countries and 
the case of 
Sweden 1970-1992 
"Our main results are: (i) fiscal policy changes can indeed have non-Keynesian effects if they are sufficiently 
large and protracted; (ii) these effects are present not only if the fiscal turnaround is obtained through 
changes in public consumption, but also if it is achieved through changes in taxes and transfers (...); (iii) 
non-Keynesian effects work, at least partly, by affecting private sector expectations about the future 
income from labor and capital, and not solely via the implied changes in the real interest rate and asset 
values" 
McDermott, 
Westcott 1996 
20 OECD 
countries 1970-1995 
"(…)fiscal consolidation need not trigger an economic slowdown, especially over the medium term. Fiscal 
consolidation that concentrates on the expenditure side, especially transfers and government wages, is 
more likely to succeed in reducing the public debt ratio than tax-based consolidation. Also, the greater the 
magnitude of the fiscal consolidation, the more likely it is to succeed in reducing the debt ratio" 
Perotti R. 1999 
19 OECD 
countries 1965-1994 
"I find strong evidence that expenditure shocks have Keynesian effects at low levels of debt or deficit, and 
non-Keynesian effects in the opposite circumstances. The evidence on similar switch in the effects of tax 
shocks is less strong." 
Lane P. R., 
Perotti R. 2001 
14-17 OECD 
countries 1964-93 
"A fiscal reform that takes the form of a reduction in wage government spending will crowd 
in an expansion in traded output and employment and improve the level of profitability. A reform that 
consists of an increase in labor taxation will have the opposite effect on the traded sector. (...) under 
flexible exchange rates, a reduction in wage government spending doubly improves profitability in the 
traded sector: not only do labor costs fall but firms in the traded sector also benefit from the induced 
exchange rate depreciation." 
Borys P., 
Cizkowicz P., 
Rzońca A. 2011 10 NMS 1995-2010 
"The results confirm that composition of the consolidation determines the output response. Moreover, we 
find evidence that all types of fiscal consolidations stimulate private investments, while export acceleration 
is observed only when consolidations involve mostly expenditure curtailment. Private consumption reaction 
to fiscal policy shows signs of nonlinearity - in the case 
of minor adjustments Keynesian effects dominate, but they are cancelled out when sizable consolidations 
are considered."
4. The EMU and the crisis in some 
euro-area countries 
19
What are the special (inherent) problems of the EMU-the 
main assertions: 
1. One monetary policy can not fit all, 
devaluation is not possible 
2. The monetary union without a „political” 
union 
20
One monetary policy can not fit all ? The nominal devaluation 
in necessary tool of adjustment? 
21 
• The temporal aspect (asymmetric shocks) - not a serious 
problems in view of the growing synchronization of the 
business cycles 
• The structural aspect: the ECB’s interest rate may be too low 
for some countries most of the time: boom bust; much 
more serious problem 
• The experience of hard pegs: PIIGS versus BELL
GDP growth 2007-2012 (%) 
15 PIIGS 
Source: IMF WEO IV 2012 
22 
15 BELL 
10 
5 
0 
-5 
-10 
-15 
-20 
Bulgaria Estonia 
Latvia Lithuania 
10 
5 
0 
-5 
-10 
-15 
-20 
Greece Ireland Italy 
Portugal Spain
Source: ECB 
23 
10Y Bond yields spreads relative to Germany 
-5 
0 
5 
10 
15 
JAN-2007 
APR-2007 
JUL-2007 
OCT-2007 
JAN-2008 
APR-2008 
JUL-2008 
OCT-2008 
JAN-2009 
APR-2009 
JUL-2009 
OCT-2009 
JAN-2010 
APR-2010 
JUL-2010 
OCT-2010 
JAN-2011 
APR-2011 
JUL-2011 
OCT-2011 
JAN-2012 
APR-2012 
JUL-2012 
OCT-2012 
JAN-2013 
BELL 
Bulgaria Latvia Lithuania 
0 
10 
20 
30 
JAN-2007 
APR-2007 
JUL-2007 
OCT-2007 
JAN-2008 
APR-2008 
JUL-2008 
OCT-2008 
JAN-2009 
APR-2009 
JUL-2009 
OCT-2009 
JAN-2010 
APR-2010 
JUL-2010 
OCT-2010 
JAN-2011 
APR-2011 
JUL-2011 
OCT-2011 
JAN-2012 
APR-2012 
JUL-2012 
OCT-2012 
JAN-2013 
PIIGS 
Greece Ireland Italy Portugal Spain
GDP per capita (peak = 100%) 
PIIGS 
Source: IMF WEO X 2012 
24 
120% 
110% 
100% 
90% 
80% 
70% 
60% 
BELL 
2004 
2005 
2006 
2007 
2008 
2009 
2010 
2011 
2012E 
2013E 
Bulgaria Estonia Latvia Lithuania 
120% 
110% 
100% 
90% 
80% 
70% 
60% 
2004 
2005 
2006 
2007 
2008 
2009 
2010 
2011 
2012E 
2013E 
Greece Ireland Italy Portugal Spain
Unemployment rate (%) 
30 PIIGS 
Source: IMF WEO X 2012 
25 
30 BELL 
25 
20 
15 
10 
5 
0 
Bulgaria Estonia Latvia Lithuania 
25 
20 
15 
10 
5 
0 
Greece Ireland Italy Portugal Spain
Current account balance (% GDP) 
PIIGS 
Source: IMF WEO X 2012 
26 
10 
0 
-10 
-20 
-30 
BELL 
2007 2008 2009 2010 2011 2012E 2013E 
Bulgaria Estonia 
Latvia Lithuania 
10 
0 
-10 
-20 
-30 
2007 2008 2009 2010 2011 2012E2013E 
Greece Ireland Italy 
Portugal Spain
27 
Unit Labor Costs (2007=100%) 
PIIGS (2007=100%) 
Source: ECB SDW 
140 
130 
120 
110 
100 
90 
BELL (2007=100%) 
2007 2008 2009 2010 2011 
Bulgaria Estonia Lithuania Latvia 
140 
130 
120 
110 
100 
90 
2007 2008 2009 2010 2011 
Greece Ireland Italy Portugal Spain
• The EMU is a special case of a hard-peg area; 
other cases include: 
– One country currency 
– Gold Standard 
– Currency boards 
• One should compare hard peg-areas from two 
points of view: 
– The propensity to generate boom-bust cycles 
– The strength of the adjustment mechanisms, once 
boom-bust occurs 
• EMU has turned out to be very poor on both 
counts. The reforms should address these and 
other deficiencies. 
• Most important reforms are at the national level. 
28
5. Some Necessary Reforms 
1. Reduce the risks that monetary policy would contribute to the private 
sector booms 
2. Macroprudential regulations 
3. The Elimination of wrong financial regulations 
4. Strengthen the Fiscal Monitoring and Fiscal Constraints: 
• At the EU level (credibility) 
• In the respective countries 
5. Radically increase the flexibility of the labor markets, where necessary 
to facilitate the internal devaluation 
6. Strengthen the economic growth through reforms on the supply side 
29

Leszek Balcerowicz. Euro: problems and solutions

  • 1.
    Euro: problems andsolutions* Leszek Balcerowicz Warsaw School of Economics November 2014 *I am grateful to Aleksander Łaszek, Marek Tatała and Dawid Samoń for their assistance in preparing this presentation.
  • 2.
    Content: 1. Economicgrowth in the EU, 2008 – 2013 2. Main reasons for the deep recession in some countries 1. Inside the euro-area 2. Outside the euro-area 3. Policy responses and the GDP growth 4. The EMU and the crisis in some euro-area countries 5. What are the necessary solutions? 2
  • 3.
    1. Economic growthin the EU, 2008 - 2013 *through=2009, if not stated otherwise Source: AMECO 3
  • 4.
    2.1. Main reasonsfor the deep recession in euro-area countries 4
  • 5.
    Two types ofcrises which include the fiscal crises (Sovereign Debt Distress) in the market economies A. The financial (banking) crisis fiscal crisis B. The fiscal crisis the financial (banking) crisis 5
  • 6.
    Figure 1. Thedynamics of the Financial-Fiscal Crisis Wrong policies Vs. Inherant instability of the markets? Private sector boom The bust The recession The financial crisis The fiscal problems Inflated tax revenues 2001 2002 2003 2004 2005 2006 2007 2008 2009 2010 Household loans to GDP Ireland 49,62% 54,79% 62,59% 72,70% 85,99% 94,41% 101,70% 112,55% 123,28% 118,89% Spain 48,14% 52,08% 57,61% 64,41% 71,87% 79,22% 83,24% 83,92% 86,43% 85,69% United Kingdom 74,89% 76,15% 82,73% 87,53% 92,55% 98,34% 92,81% 84,45% 103,68% 99,16% Property price index Ireland 60,6 64,9 74,1 82,4 88,5 100,5 100,0 90,9 78,5 66,3 Spain 47,0 54,4 64,0 75,2 85,6 94,6 100,0 100,7 93,2 89,6 United Kingdom 50,3 63,0 72,8 82,9 85,6 93,5 100,0 85,3 88,1 88,6 Source: Eurostat, ECB, Nationwide 6
  • 7.
    Policies which contributeto financial crises My reading of the empirical literature on the causes of the financial crises leads me to the following list of policies which contribute to the financial crises: 1. Politicized (or state-directed) credit allocation: it is usually driven by political considerations which dominate the economic risk assessment and, thus, leads to large banking losses and/or to Sovereign debt distress. The activity of Fannie May and Freddie Mac in the US is the recent example. 2. Persistently expansionary fiscal policy: it contributes to spending booms and may also result in the banking losses and in the public debt problems. 3. Monetary policy which occasionally leans “with the wind”, i.e. fuels asset bubbles (Fed’s policy in the 2000s being the main recent example). It has been linked to a doctrine of monetary policy which narrows its goal to the short-term CPJ inflation, and excludes from its purview asset price developments and the related factors (e.g. the growth of monetary and credit aggregates). 4. Tax regulations which favour debt financing relative to equity finance. 5. Subsidies to mortgage borrowing. 6. Financial regulations which encouraged excessive securitization, e.g. the risk-weights contained in Basel 1 and the mandatory use of credit rating by the financial investors. 7. Generous deposit insurance which eliminates an important source of market discipline. 8. Regulations which limit the shareholders concentration in large banks and thus increase the agency problems and weaken market discipline (Calomiris, 2009a). This may be an important source of the managers compensation schemes which favour short-term gains and disregard longer –term risks. 9. Policies which have resulted in the “too big to fail” syndrome, i.e. financial markets’ subsidization – vía reduced risk premiums – of the large financial conglomerates. This is another important instance of public interventions which weaken the market discipline. The resulting concentration, in the face of the financial crisis, exerts an enormous pressure upon the decision-makers to bail-out large financial companies again, thus creating a sort of a vicious circle. The policies in question included an easy acceptance of the mergers of already huge financial companies and an easy-money policy which fuelled the growth of already large financial conglomerates. 7
  • 8.
    Figure 2. Thedynamics of Fiscal- Financial Crisis •The destructive political competition •Weak constraint on the government The systematic over-spending (welfare spending, government consumption) Windfall gains •Discovery of gas etc. (the Netherlands in the 1970s) •Lowering of the interest rates (Greece, Portugal, Spain, Italy) Slow growth due to the worsening institutional system •Falling employment and/or increasing structural unemployment •Anti-market or anticompetitive regulations •Growing public sector Problems in financial sector The fiscal problems sometimes sometimes 1990 1995 2000 2005 2006 2007 2008 2009 2010 Greece General government total expenditure 43,43 43,17 46,64 44,60 45,21 47,61 50,60 53,81 50,20 General government net lending/borrowing -14,51 -6,99 -3,69 -5,64 -6,03 -6,80 -9,91 -15,56 -10,50 General government net debt 64,22 66,40 77,41 101,21 107,33 107,45 112,62 128,95 144,55 Portugal General government total expenditure 39,26 39,66 39,29 46,56 44,34 44,36 44,80 49,76 51,26 General government net lending/borrowing -5,06 -3,41 -1,09 -6,49 -3,75 -3,21 -3,70 -10,17 -9,84 8 General government net debt n/a n/a 41,97 57,75 58,56 63,66 67,38 79,03 88,89 Source: IMF
  • 9.
    Italy: high publicdebt and long-term economic stagnation 10 8 6 4 2 0 -2 -4 -6 -8 140 120 100 80 60 40 20 0 in % of GDP in % 1961 1963 1965 1967 1969 1971 1973 1975 1977 1979 1981 1983 1985 1987 1989 1991 1993 1995 1997 1999 2001 2003 2005 2007 2009 2011 Public debt (left scale) GDP per capita growth (right scale) Trend line (GDP growth) Sources: IMF and Ameco (2013)9
  • 10.
    2.2. Recent crisesoutside the eurozone 10
  • 11.
    GDP growth 2007-2012(%) Source: IMF WEO X 2012 11 8 6 4 2 0 -2 -4 -6 -8 2007 2008 2009 2010 2011 2012 Japan United Kingdom United States 8 6 4 2 0 -2 -4 -6 -8 2007 2008 2009 2010 2011 2012 Canada Sweden
  • 12.
    Gross public debt2007-2012 (%) Source: IMF WEO X 2012 12 250 200 150 100 50 0 2007 2008 2009 2010 2011 2012 Japan United Kingdom United States 250 200 150 100 50 0 2007 2008 2009 2010 2011 2012 Canada Sweden
  • 13.
    3. Policy responsesand the GDP growth 13
  • 14.
    1. The OfficialCrisis Lending (the bailouts) • IMF • European institutions 2. The Central Bank Purchases of the Government bonds • with no inflation (?) • with increased inflation 3. Repressed financial sector 4. The Outright Debt Reduction • unilateral • negotiated 5. Fiscal Consolidation (Reforms) • unsuccessful • successful 14 Comments: • All bailouts create moral hazard; they do not solve the core problem; at the best they serve to buy time to prepare the consolidation/reform package (see the huge literature on IMF). Bailouts do not substitute for consolidation/reforms. • The return to a repressed financial sector is – hopefully – not very likely •Appropriate fiscal consolidation/reforms can restore confidence of the financial markets, i.e. they have both short-term and longer-term effects (see later) •The popular expressions: „contagion”, „domino effects”, etc. are misleading metaphors • The uncritical use of those metaphors contributes to the pressure aiming at forcing the bailouts and central bank „actions” • Delayed, insufficient and/or badly structured consolidation/reform effort exacerbate this pressure
  • 15.
    When deficit’s reductionis long lasting? First and foremost when it is expenditure based Authors Countries analyzed Period covered Main findings Alesina, Perotti (1996) 20 OECD countries and 3 case studies (Denmark, Ireland and Italy) 1960-1994 "We find that fiscal adjustments which rely primarily on spending cuts on transfers and the government wage bill have a better chance of being successful (...) On the contrary fiscal adjustments which rely primarily on tax increases and cuts in public investment tend not to last" McDermott, Westcott (1996) 20 OECD countries 1970-1995 "Fiscal consolidation that concentrates on the expenditure side, especially transfers and government wages, is more likely to succeed in reducing the public debt ratio than tax-based consolidation. Also, the greater the magnitude of the fiscal consolidation, the more likely it is to succeed in reducing the debt ratio" Alesina, Ardagna (1998) 20 OECD countries and 10 case studies 1960-1994 "Three ingredients seem to be important for a succesful, long-lasting and expansionary fiscal adjustment. It must combine spending cuts in transfers, welfare programmes and the governemnt wage bill, some form of wage agreement with the unions that ensures wage moderation, and a devaluation immediately before the fiscal tightening" Alesina, Ardagna (2009) 21 OECD countries 1970-2007 "As for fiscal adjustments those based upon spending cuts and no tax increases are more likely to reduce deficits and debt over GDP ratios than those based upon tax increases." 15
  • 16.
    Authors Countries analyzed Period covered Main findings Hagen von, Hallett, Strauch (2002) 20 OECD countries 1960–1998 "(...) the likelihood of sustained consolidation efforts rises when governments tackle politically sensitive items on the budget, such as transfers, subsidies, and government wages. Switching strategies that start with rising taxes and later switching to reduced spending does not produce better results than consistently expenditure-based consolidations. Our analysis also indicates that consolidation fatigue is an important element which policymakers should take into account, since they are strongly time-dependent. Finally, the economic conditions at the start of and during the fiscal consolidation matter. A high debt–GDP ratio and fiscal tightening in other OECD countries raise the likelihood of consolidations to persist. In addition, a weak but recovering domestic economy contributes to the longevity of consolidations." Guichard, Kennedy, Wurzel, André (2007) 24 OECD countries 1978-2003 "Large initial deficits and high interest rates have been important in prompting fiscal adjustment and also in boosting the overall size and duration of consolidation. Concerning the quality of fiscal policies, an emphasis on cutting current expenditures has been associated with overall larger consolidation. Fiscal rules with embedded expenditure targets tended to be associated with larger and longer adjustments, pointing to institutional features playing a potentially important role in generating successful consolation efforts. Experience across countries also shows that certain design features such as transparency, flexibility to face shocks and effective enforcement mechanisms seem important for the effectiveness of fiscal rules" Barrios, Langedijk, Pench (2010) EU27 and 8 non EU OECD countries 1970-2008 "(i) in presence of a systemic financial crisis, the repair of the banking sector is a pre-condition for a fiscal consolidation to succeed in reducing debt levels, especially so when fiscal consolidations are sharp (ii) even after the banking sector is repaired, fiscal consolidations are usually less successful than in absence of financial crises, although more vigorous fiscal consolidations (i.e. cold shower) tend to yield higher results (iii) current debt dynamics in the EU are very unfavourable and in some cases, coupled with rising debt servicing costs and much deteriorated growth outlook warranting differentiated consolidation strategies across EU countries (iv) We do not find conclusive evidence in support of exchange rates (including real exchange rate) depreciation/devaluation as enhancing the success of fiscal consolidation as their effect appear to be low and insignificant." 16
  • 17.
    Under certain conditionsfiscal consolidation may turn out to be expansionary. Theory indicates a number of channels through which fiscal adjustment may lead to such non-Keynesian effects Studies, in general, confirm that the non-Keynesian effects of fiscal consolidation are more likely to 17 occur, when: • public debt before fiscal consolidation is high or fast growing rather than low and slowly growing; • fiscal consolidation is of large size and long lasting; • deficit is reduced through cuts in expenditure rather than via tax increases; • fiscal consolidation is focused on wages and salaries in public sector and on transfers to households; • fiscal consolidation is introduced in an open economy.
  • 18.
    18 Non- Keynesianeffects Authors Date of publication Countries analysed Period coveredMain findings Giavazzi F., Pagano M. 1996 19 OECD countries and the case of Sweden 1970-1992 "Our main results are: (i) fiscal policy changes can indeed have non-Keynesian effects if they are sufficiently large and protracted; (ii) these effects are present not only if the fiscal turnaround is obtained through changes in public consumption, but also if it is achieved through changes in taxes and transfers (...); (iii) non-Keynesian effects work, at least partly, by affecting private sector expectations about the future income from labor and capital, and not solely via the implied changes in the real interest rate and asset values" McDermott, Westcott 1996 20 OECD countries 1970-1995 "(…)fiscal consolidation need not trigger an economic slowdown, especially over the medium term. Fiscal consolidation that concentrates on the expenditure side, especially transfers and government wages, is more likely to succeed in reducing the public debt ratio than tax-based consolidation. Also, the greater the magnitude of the fiscal consolidation, the more likely it is to succeed in reducing the debt ratio" Perotti R. 1999 19 OECD countries 1965-1994 "I find strong evidence that expenditure shocks have Keynesian effects at low levels of debt or deficit, and non-Keynesian effects in the opposite circumstances. The evidence on similar switch in the effects of tax shocks is less strong." Lane P. R., Perotti R. 2001 14-17 OECD countries 1964-93 "A fiscal reform that takes the form of a reduction in wage government spending will crowd in an expansion in traded output and employment and improve the level of profitability. A reform that consists of an increase in labor taxation will have the opposite effect on the traded sector. (...) under flexible exchange rates, a reduction in wage government spending doubly improves profitability in the traded sector: not only do labor costs fall but firms in the traded sector also benefit from the induced exchange rate depreciation." Borys P., Cizkowicz P., Rzońca A. 2011 10 NMS 1995-2010 "The results confirm that composition of the consolidation determines the output response. Moreover, we find evidence that all types of fiscal consolidations stimulate private investments, while export acceleration is observed only when consolidations involve mostly expenditure curtailment. Private consumption reaction to fiscal policy shows signs of nonlinearity - in the case of minor adjustments Keynesian effects dominate, but they are cancelled out when sizable consolidations are considered."
  • 19.
    4. The EMUand the crisis in some euro-area countries 19
  • 20.
    What are thespecial (inherent) problems of the EMU-the main assertions: 1. One monetary policy can not fit all, devaluation is not possible 2. The monetary union without a „political” union 20
  • 21.
    One monetary policycan not fit all ? The nominal devaluation in necessary tool of adjustment? 21 • The temporal aspect (asymmetric shocks) - not a serious problems in view of the growing synchronization of the business cycles • The structural aspect: the ECB’s interest rate may be too low for some countries most of the time: boom bust; much more serious problem • The experience of hard pegs: PIIGS versus BELL
  • 22.
    GDP growth 2007-2012(%) 15 PIIGS Source: IMF WEO IV 2012 22 15 BELL 10 5 0 -5 -10 -15 -20 Bulgaria Estonia Latvia Lithuania 10 5 0 -5 -10 -15 -20 Greece Ireland Italy Portugal Spain
  • 23.
    Source: ECB 23 10Y Bond yields spreads relative to Germany -5 0 5 10 15 JAN-2007 APR-2007 JUL-2007 OCT-2007 JAN-2008 APR-2008 JUL-2008 OCT-2008 JAN-2009 APR-2009 JUL-2009 OCT-2009 JAN-2010 APR-2010 JUL-2010 OCT-2010 JAN-2011 APR-2011 JUL-2011 OCT-2011 JAN-2012 APR-2012 JUL-2012 OCT-2012 JAN-2013 BELL Bulgaria Latvia Lithuania 0 10 20 30 JAN-2007 APR-2007 JUL-2007 OCT-2007 JAN-2008 APR-2008 JUL-2008 OCT-2008 JAN-2009 APR-2009 JUL-2009 OCT-2009 JAN-2010 APR-2010 JUL-2010 OCT-2010 JAN-2011 APR-2011 JUL-2011 OCT-2011 JAN-2012 APR-2012 JUL-2012 OCT-2012 JAN-2013 PIIGS Greece Ireland Italy Portugal Spain
  • 24.
    GDP per capita(peak = 100%) PIIGS Source: IMF WEO X 2012 24 120% 110% 100% 90% 80% 70% 60% BELL 2004 2005 2006 2007 2008 2009 2010 2011 2012E 2013E Bulgaria Estonia Latvia Lithuania 120% 110% 100% 90% 80% 70% 60% 2004 2005 2006 2007 2008 2009 2010 2011 2012E 2013E Greece Ireland Italy Portugal Spain
  • 25.
    Unemployment rate (%) 30 PIIGS Source: IMF WEO X 2012 25 30 BELL 25 20 15 10 5 0 Bulgaria Estonia Latvia Lithuania 25 20 15 10 5 0 Greece Ireland Italy Portugal Spain
  • 26.
    Current account balance(% GDP) PIIGS Source: IMF WEO X 2012 26 10 0 -10 -20 -30 BELL 2007 2008 2009 2010 2011 2012E 2013E Bulgaria Estonia Latvia Lithuania 10 0 -10 -20 -30 2007 2008 2009 2010 2011 2012E2013E Greece Ireland Italy Portugal Spain
  • 27.
    27 Unit LaborCosts (2007=100%) PIIGS (2007=100%) Source: ECB SDW 140 130 120 110 100 90 BELL (2007=100%) 2007 2008 2009 2010 2011 Bulgaria Estonia Lithuania Latvia 140 130 120 110 100 90 2007 2008 2009 2010 2011 Greece Ireland Italy Portugal Spain
  • 28.
    • The EMUis a special case of a hard-peg area; other cases include: – One country currency – Gold Standard – Currency boards • One should compare hard peg-areas from two points of view: – The propensity to generate boom-bust cycles – The strength of the adjustment mechanisms, once boom-bust occurs • EMU has turned out to be very poor on both counts. The reforms should address these and other deficiencies. • Most important reforms are at the national level. 28
  • 29.
    5. Some NecessaryReforms 1. Reduce the risks that monetary policy would contribute to the private sector booms 2. Macroprudential regulations 3. The Elimination of wrong financial regulations 4. Strengthen the Fiscal Monitoring and Fiscal Constraints: • At the EU level (credibility) • In the respective countries 5. Radically increase the flexibility of the labor markets, where necessary to facilitate the internal devaluation 6. Strengthen the economic growth through reforms on the supply side 29