Download to read offline

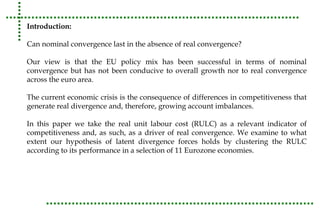
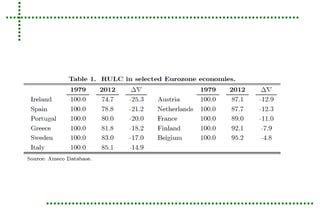
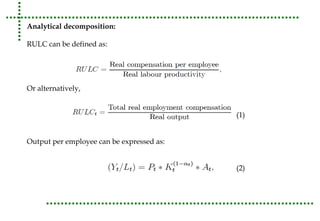
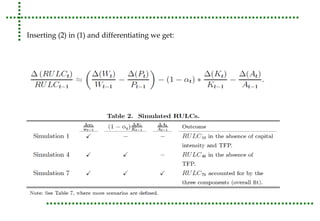
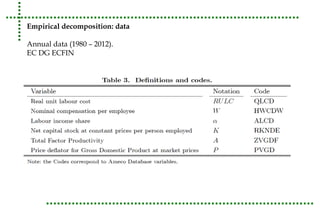
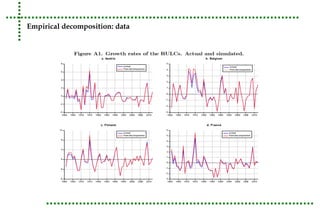
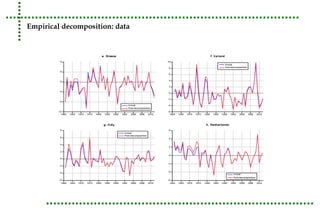
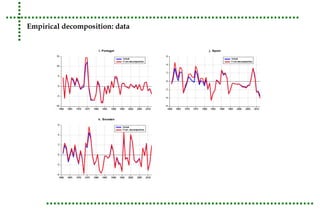
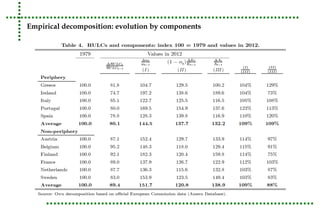
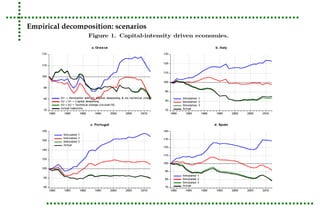
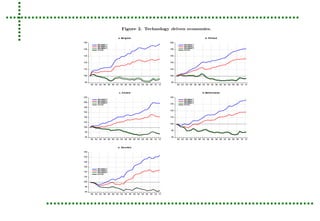
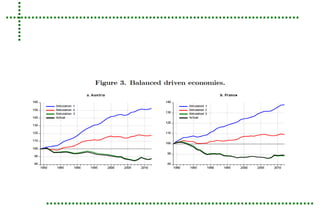
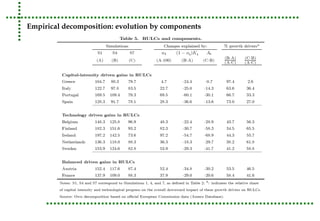
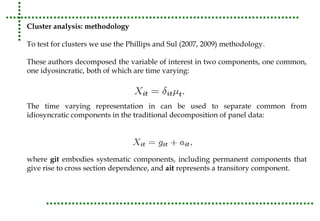
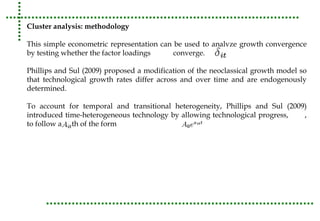
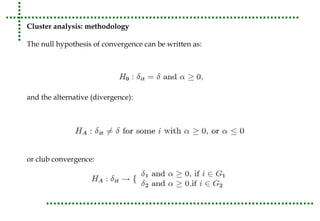
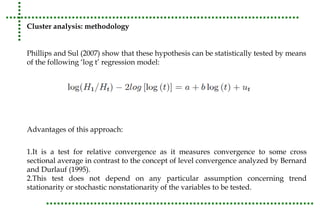
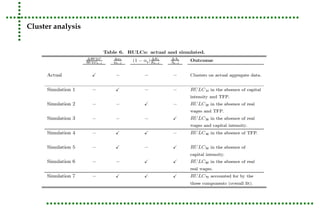
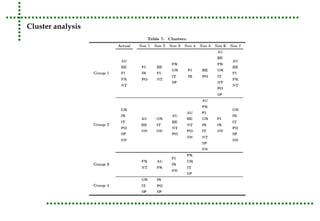

This document analyzes real unit labor costs (RULC) in 11 Eurozone countries from 1980 to 2012 to examine divergence forces. RULC is decomposed into components including labor productivity and nominal compensation per employee. A cluster analysis is performed using the Phillips and Sul methodology to test for convergence or divergence among the countries. The analysis finds that countries can be grouped into clusters based on their RULC performance, indicating latent divergence forces rather than overall convergence across the Eurozone. Internal devaluation policies are deemed insufficient and technology differences are identified as the main driver of observed divergences.


