Downloaded 93 times


![The Introduction [Fashion and the Environment] We are a team of [Fashion Marketing] students from Raffles College of Higher Education. We are conducting this survey as part of our research project for our Academic Research and Communication Skills module under our lecturer and research supervisor Kavita Parwani. The questionnaire should take about 5 minutes to complete. Our research project examines [the attitudes of the students of Raffles College of Higher Education towards the reuse, reduction and recycling of clothing.] We hope that your response will help us understand our subject in greater depth. The information we gather is confidential and anonymous, in other words, we will not name you or identify you in connection with the information you provide. If you have any questions about the survey or our research project, please feel free to contact me, [Josephine Lim, at josephinelim@gmail.com] or our supervisor Kavita Parwani at kavitaparwani@raffles-college.edu.sg](https://image.slidesharecdn.com/lesson6-primaryresearchmethods2-111022000014-phpapp02/85/Lesson-6-Primary-Research-Methods-2-24-320.jpg)
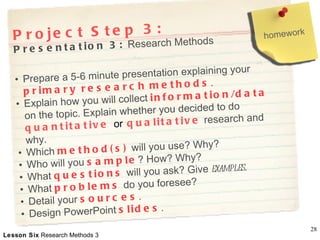

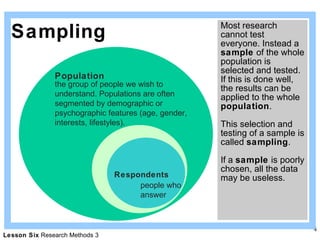
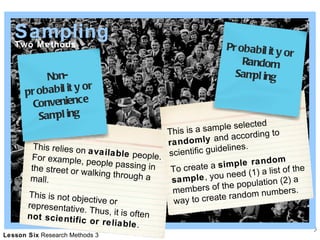
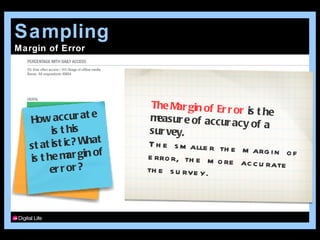
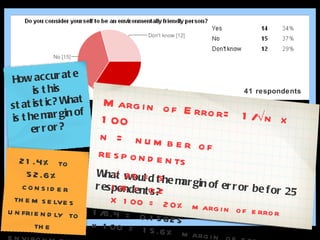
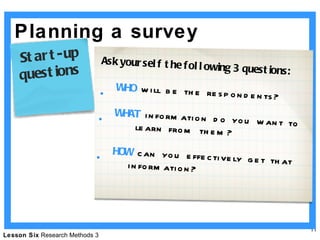
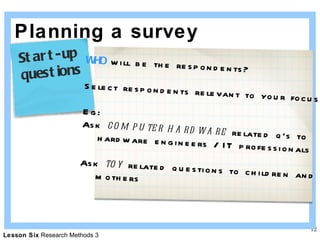
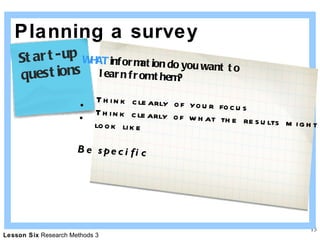
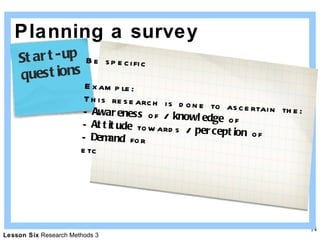
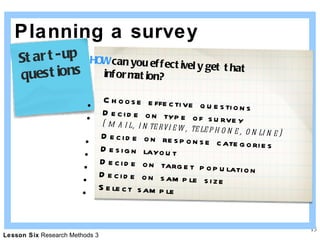
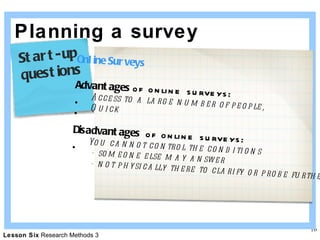
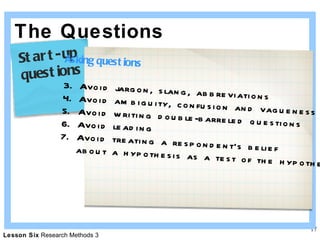
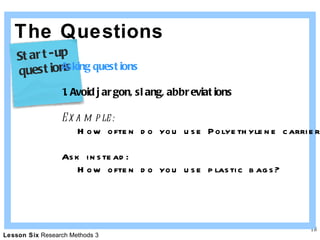
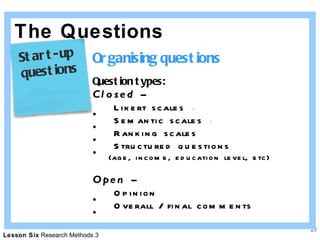
This document discusses research methods for conducting surveys. It covers topics such as sampling, developing research questions, planning a survey, question types, and analyzing results. Some key points include: - Sampling involves selecting a subset of a population to study. There are probability/random sampling methods and non-probability/convenience sampling methods. - When planning a survey, researchers should consider who the respondents will be, what information they want to learn, and how to effectively collect that information. - Questions should be clear, avoid bias and ambiguity, and not be leading. Common question types include closed-ended, open-ended, and scales. - Analyzing results includes calculating the margin of error to determine accuracy based


![Survey design-workshop-1234170716539145-3[1]](https://cdn.slidesharecdn.com/ss_thumbnails/survey-design-workshop-1234170716539145-31-120721053559-phpapp02-thumbnail.jpg?width=640&height=640&fit=bounds)