Download as PDF, PPTX


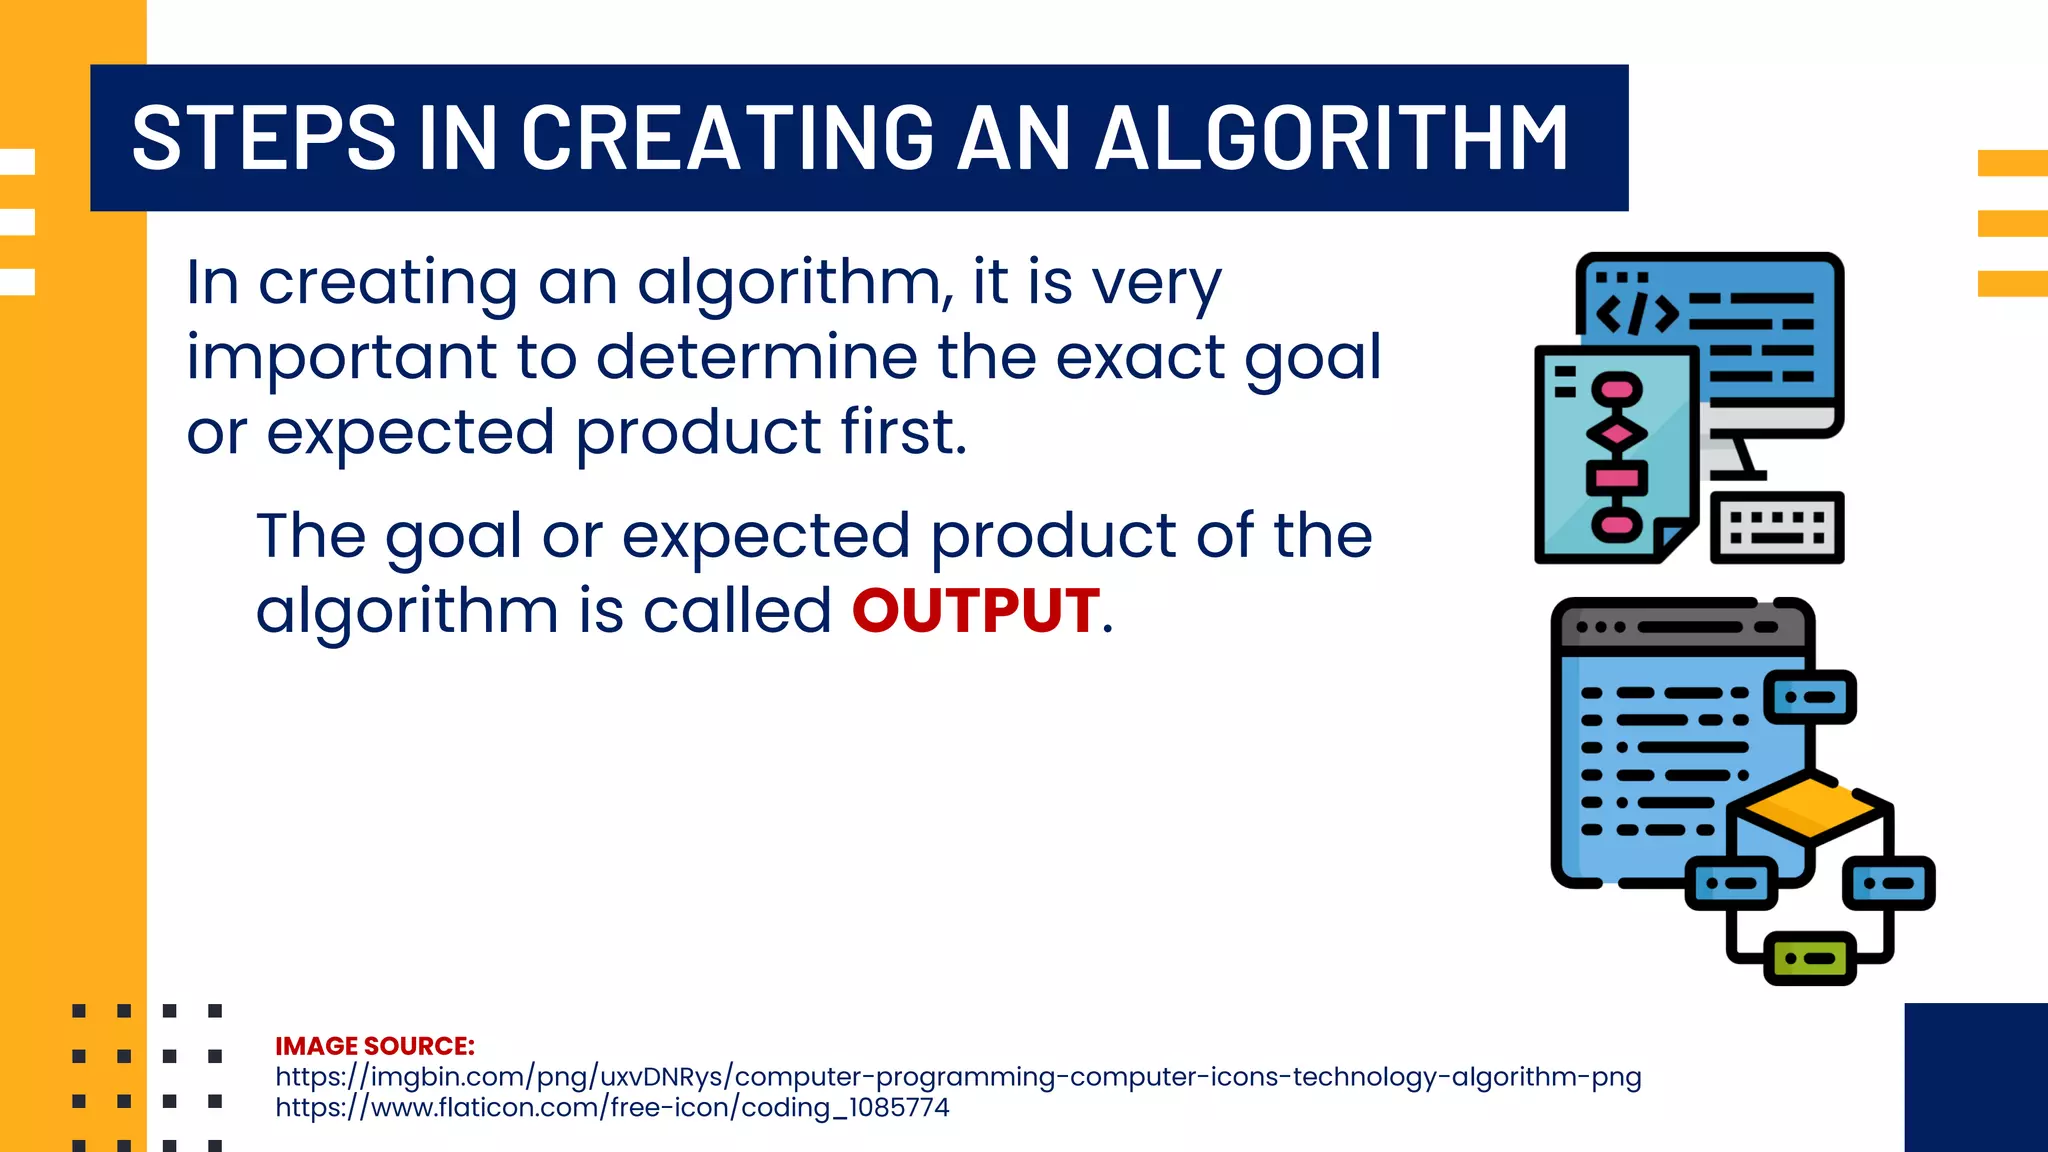
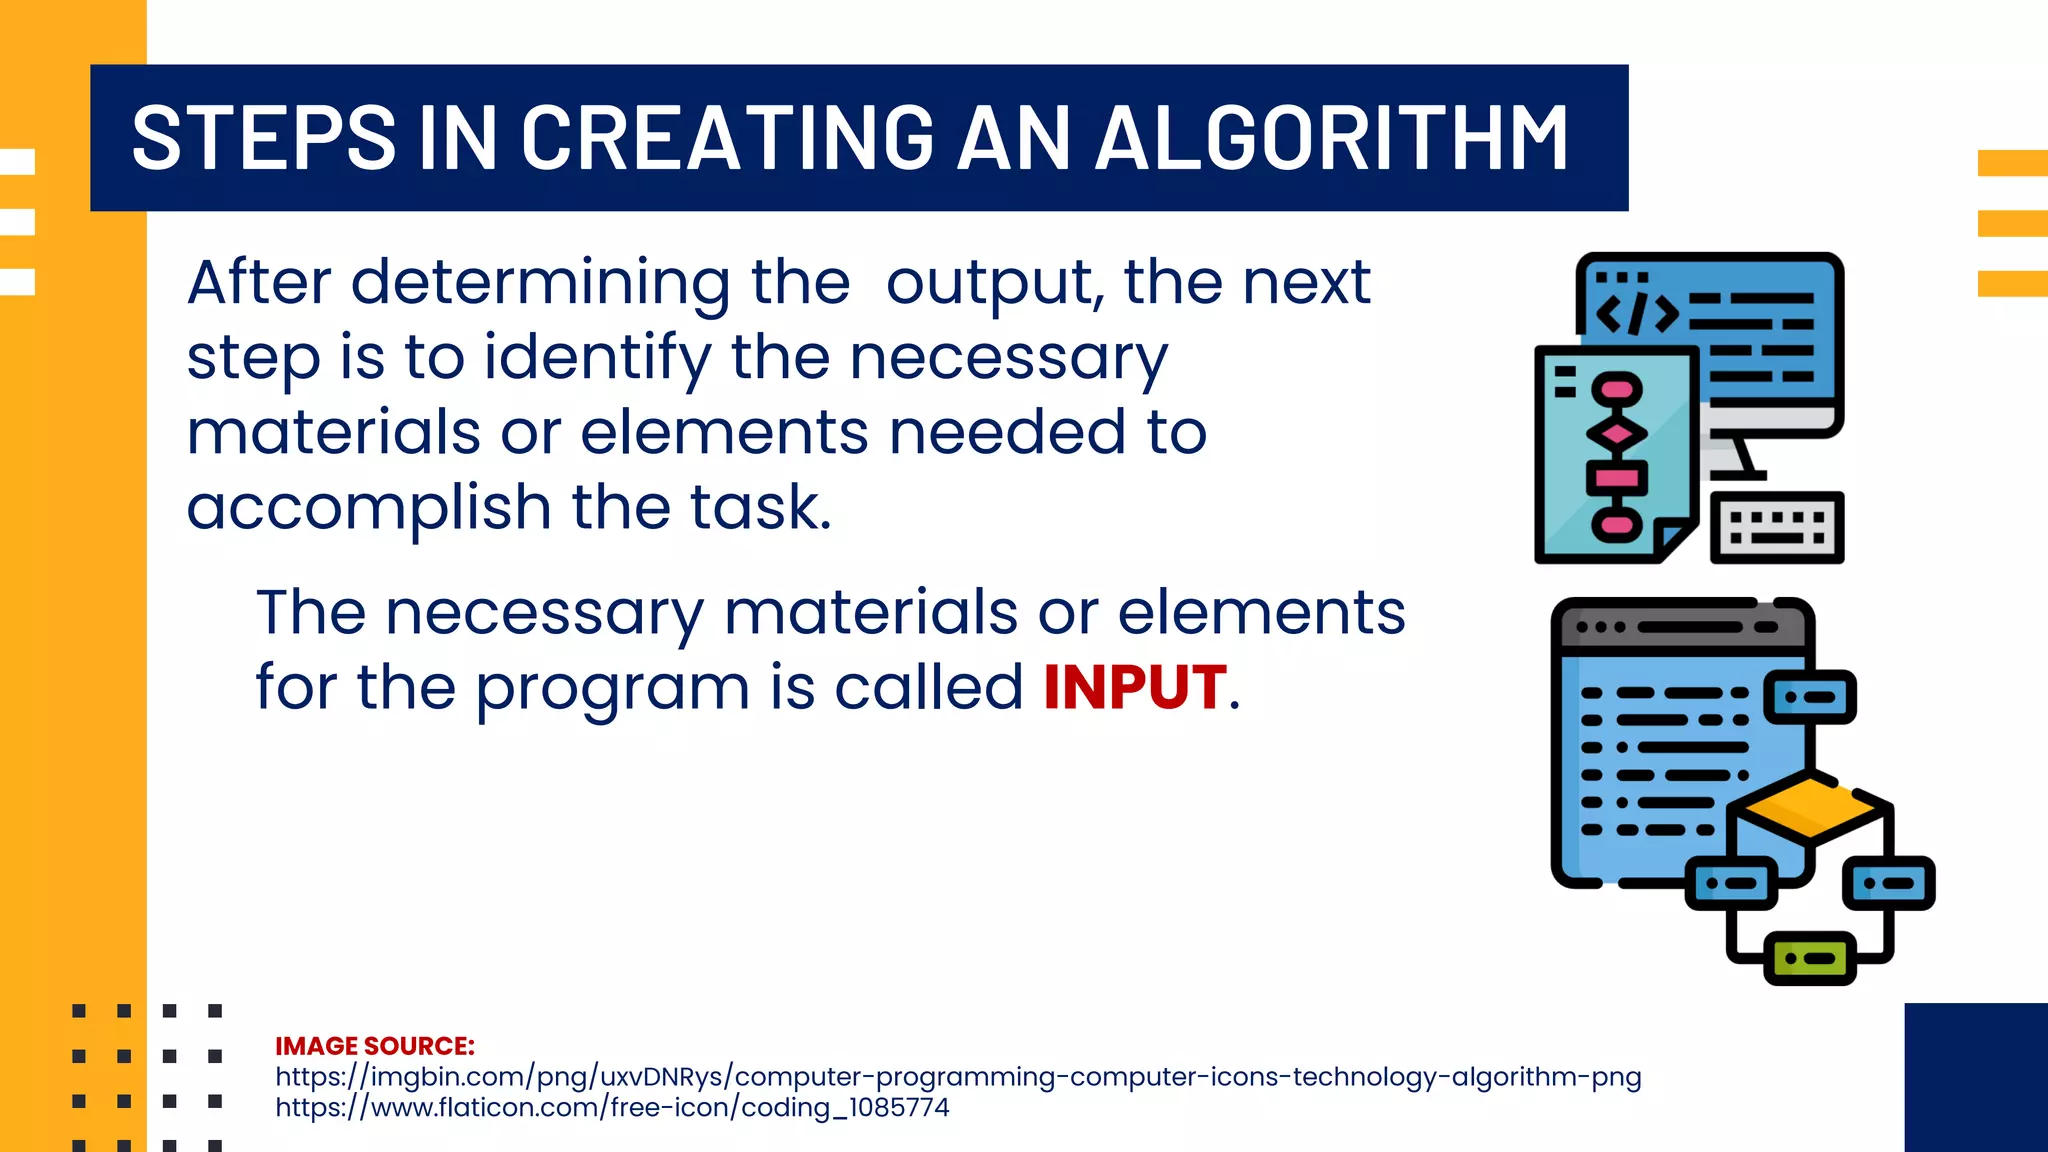
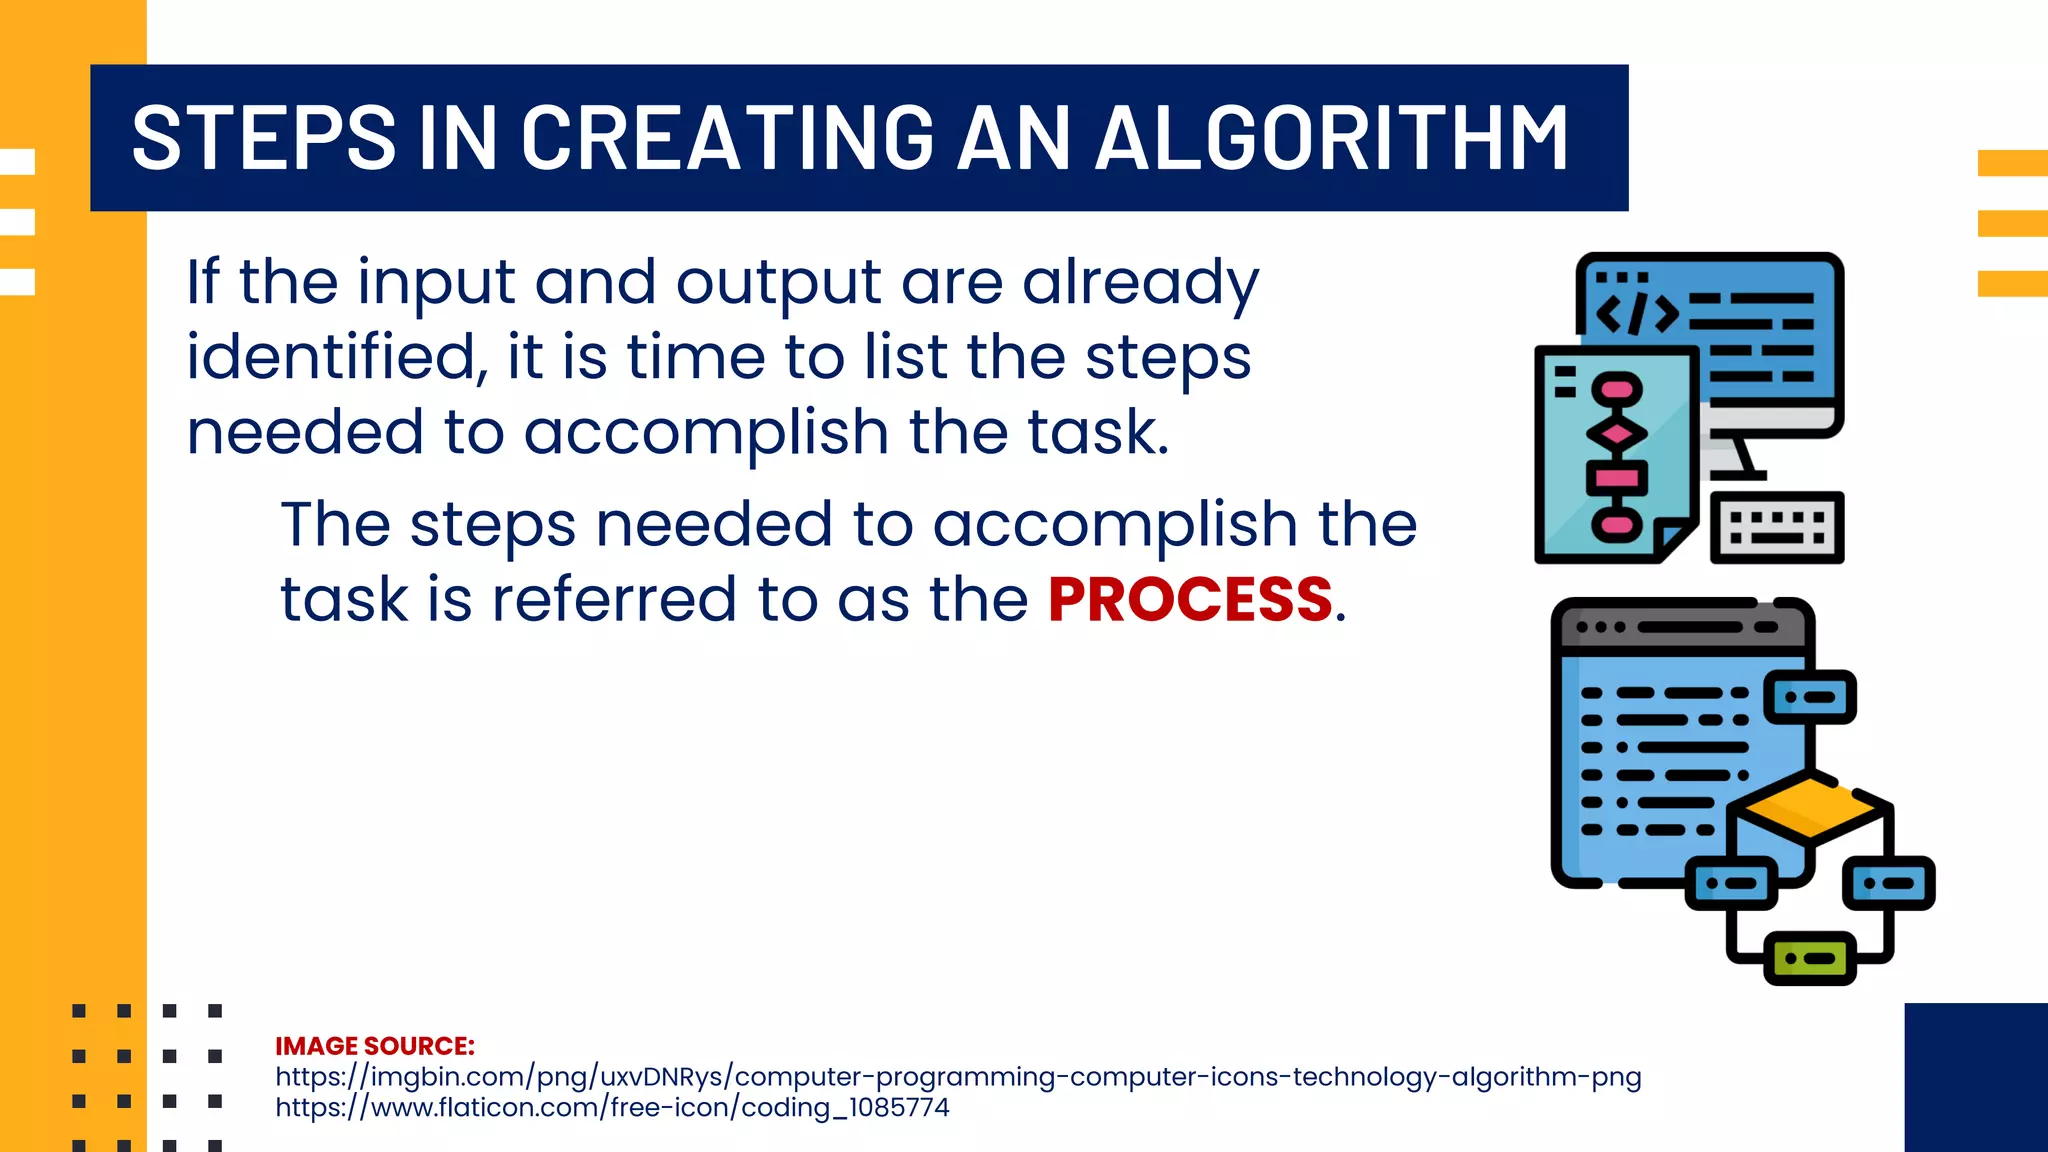

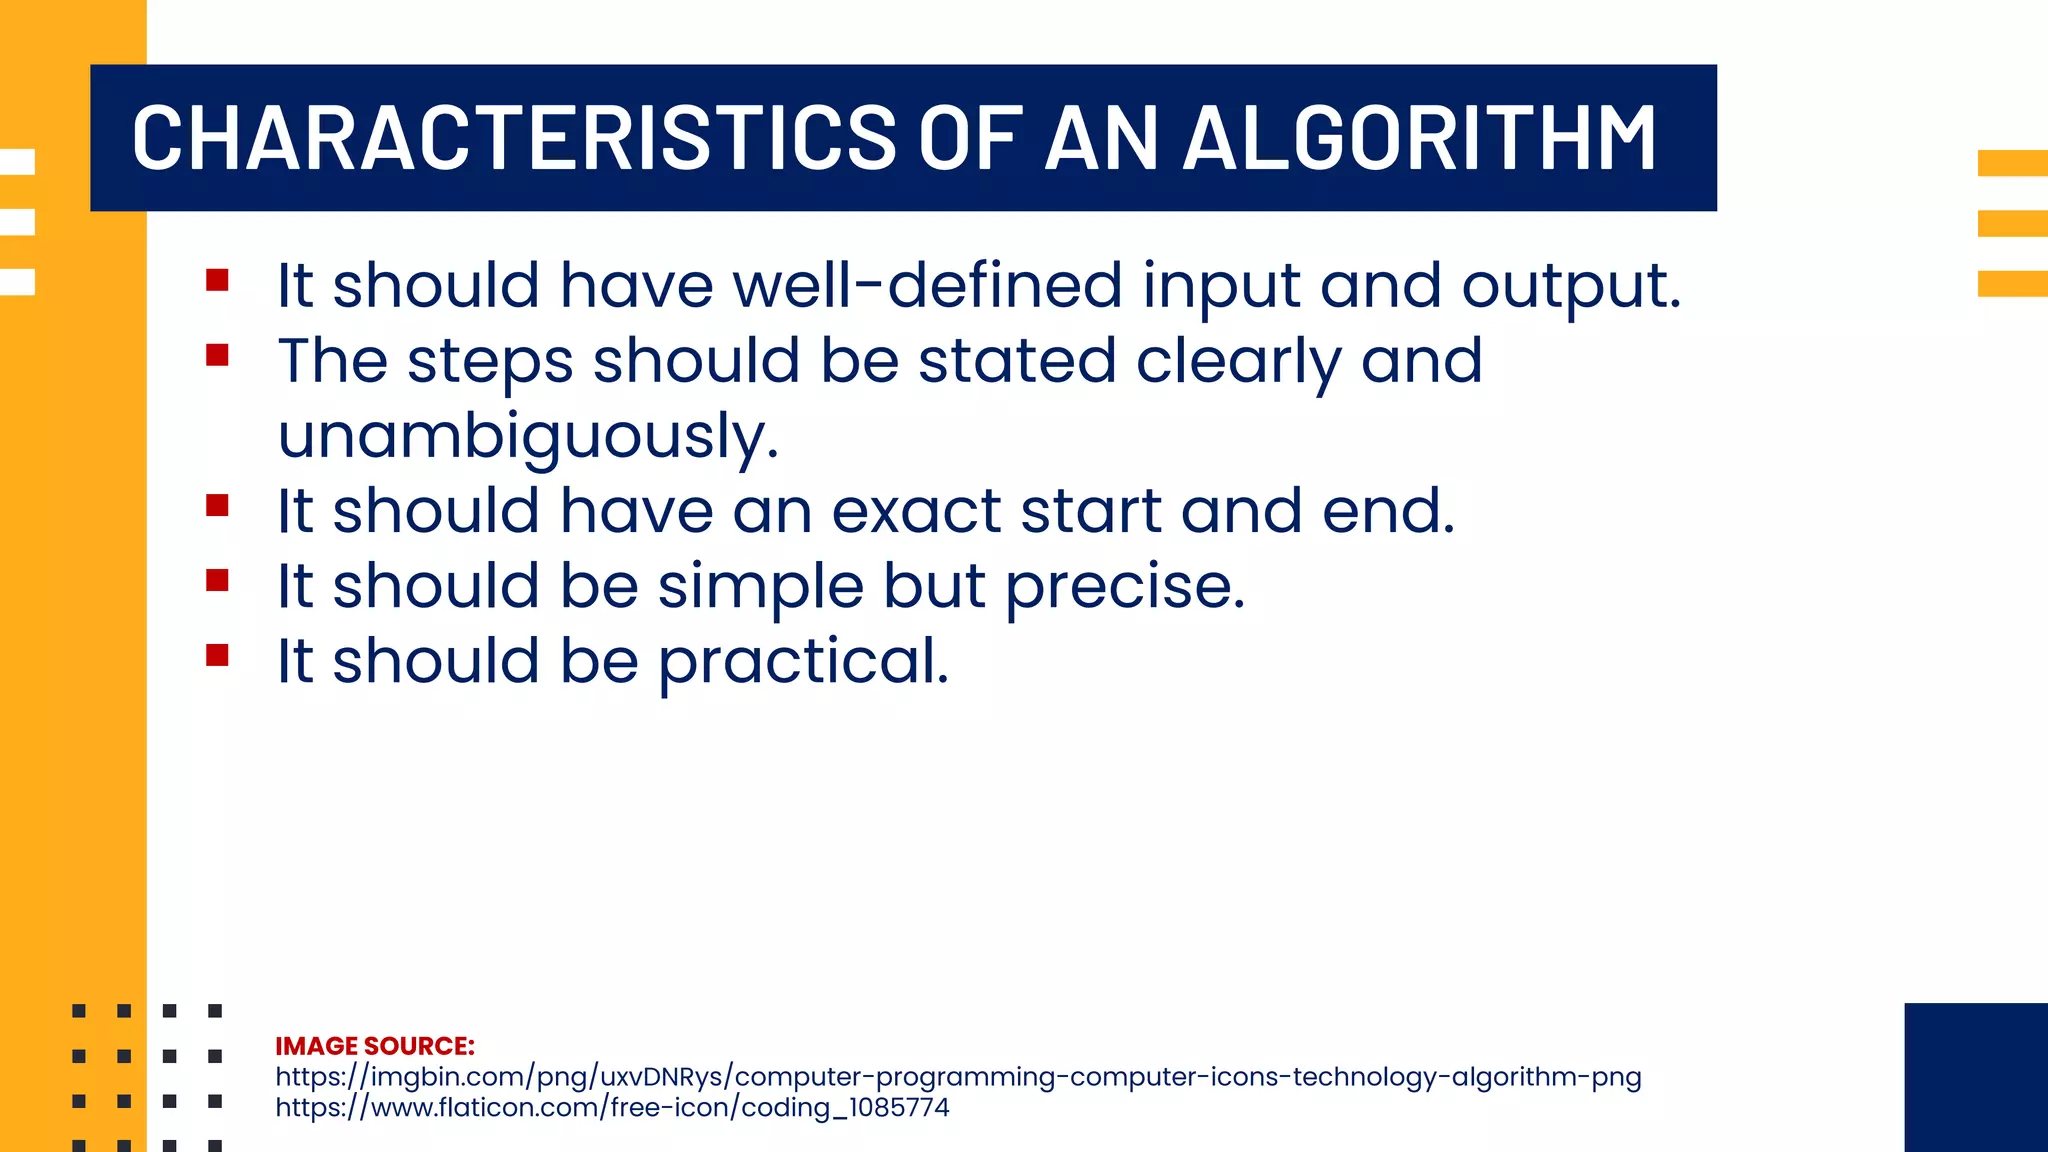

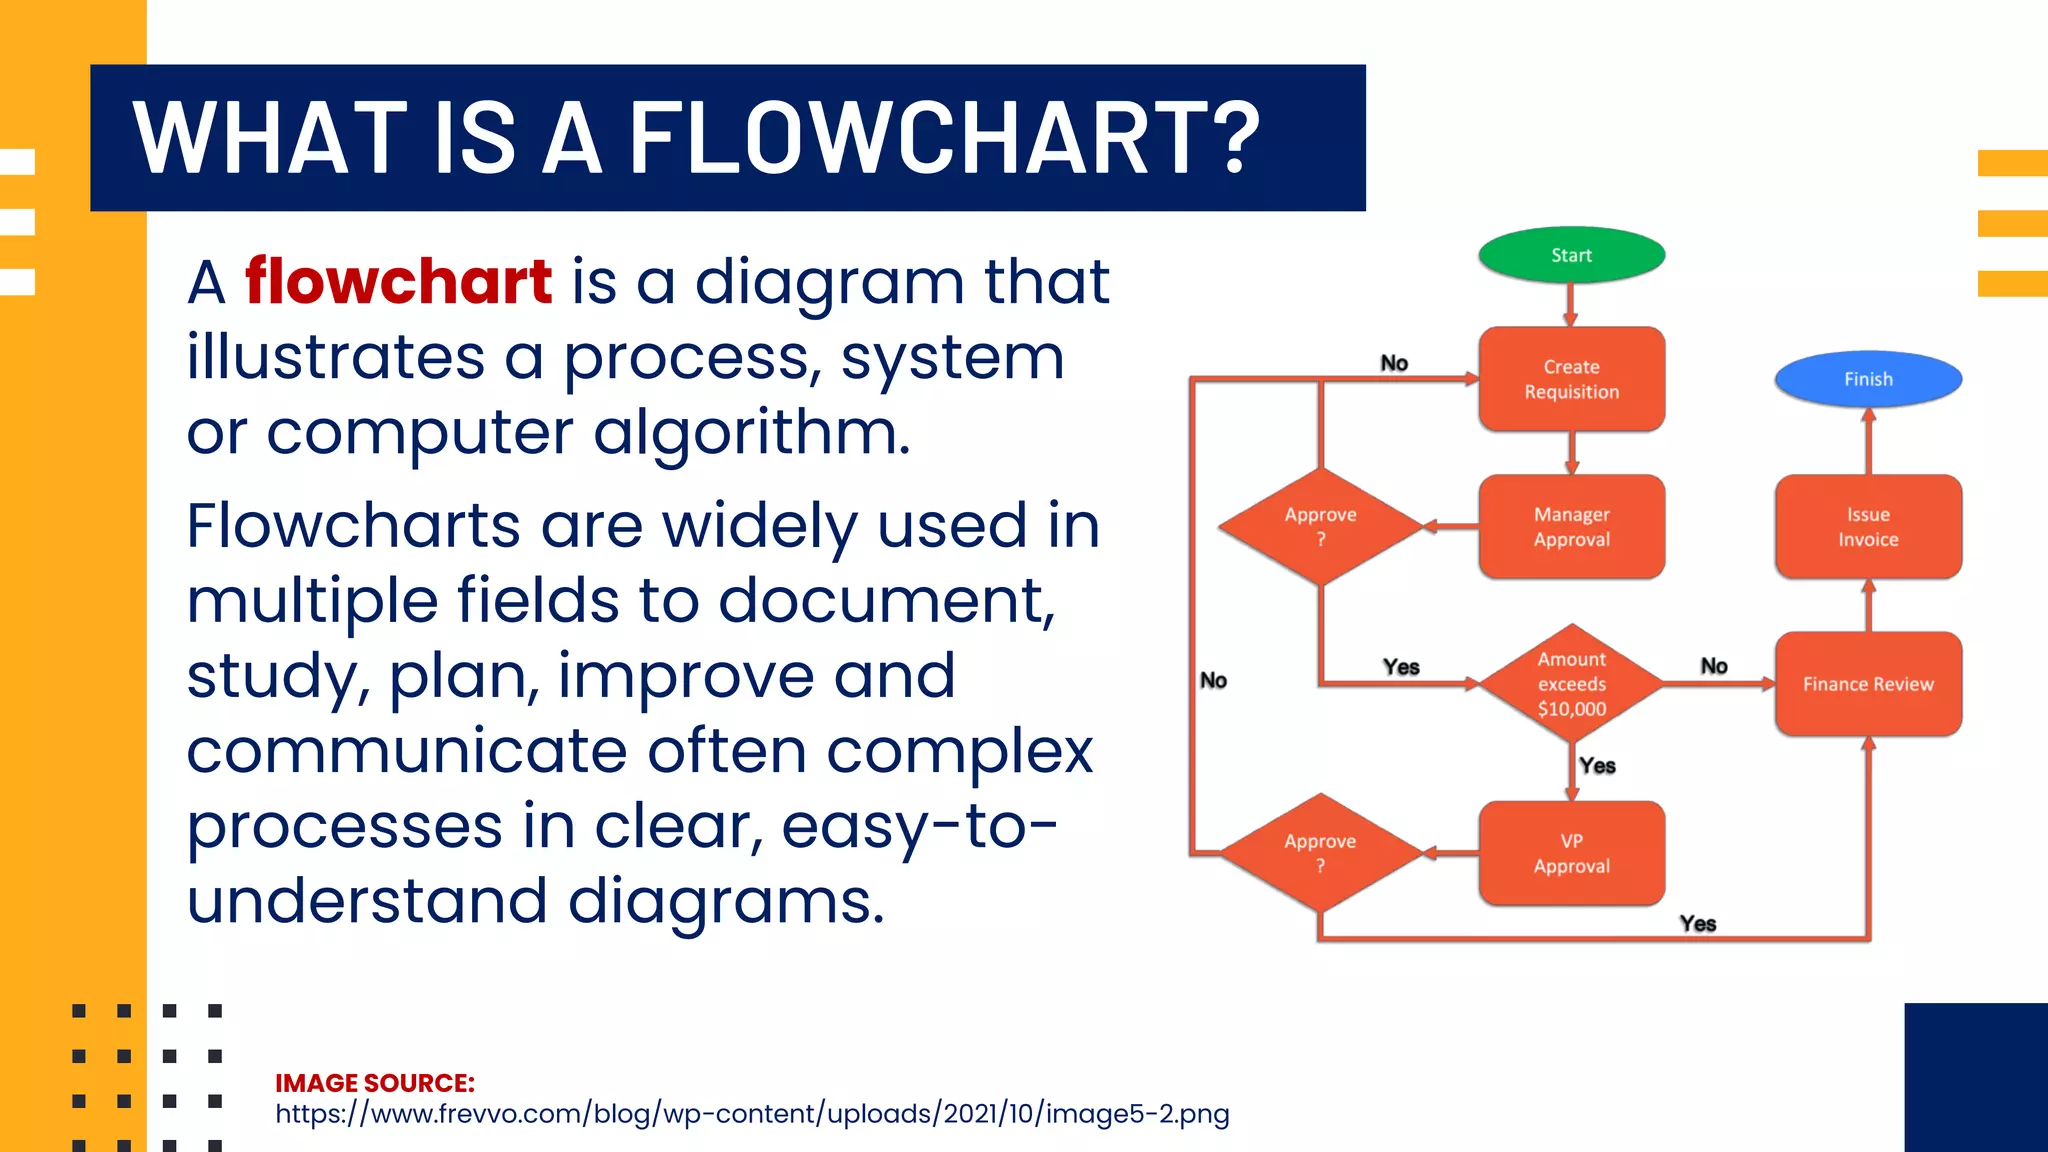
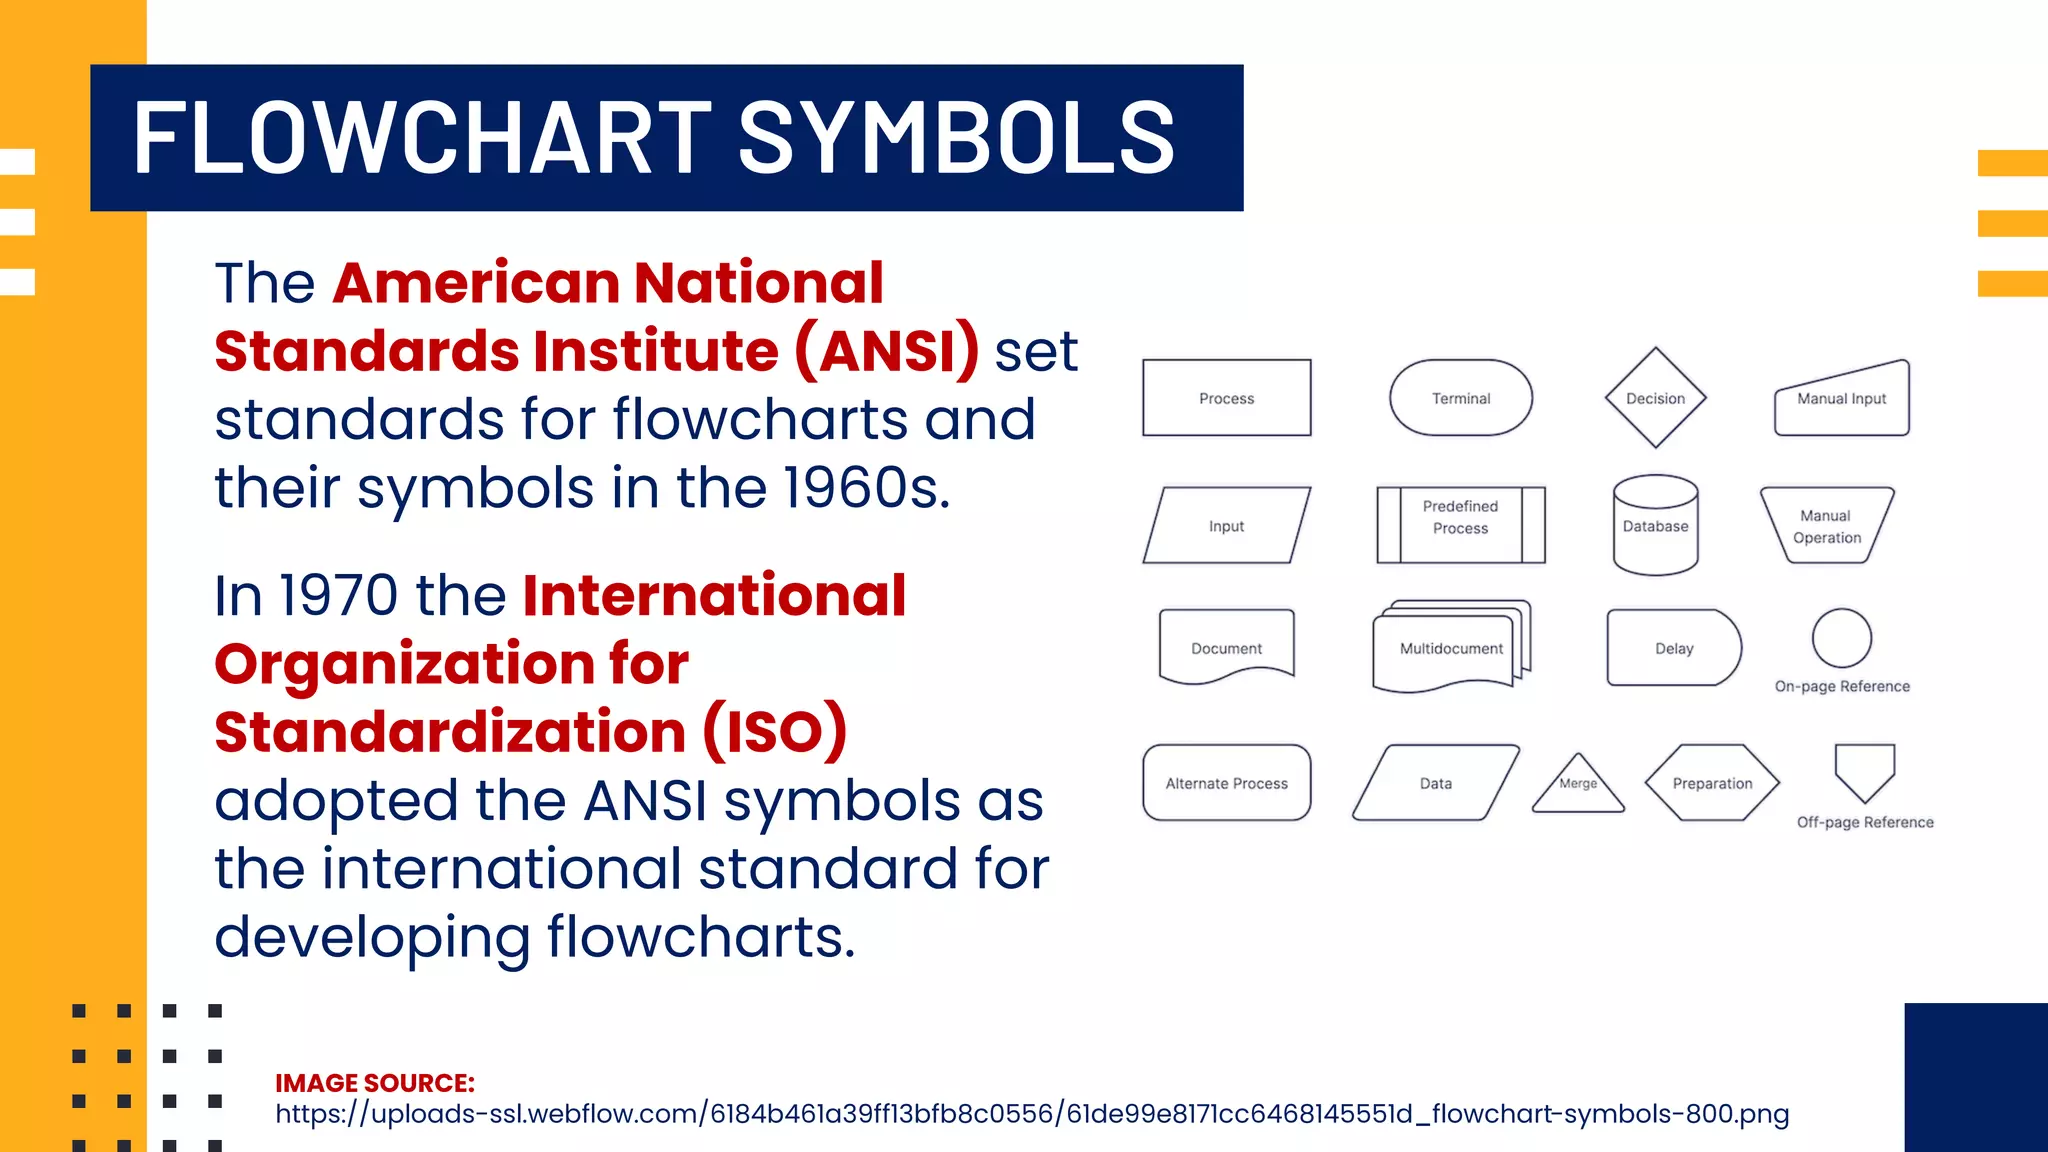
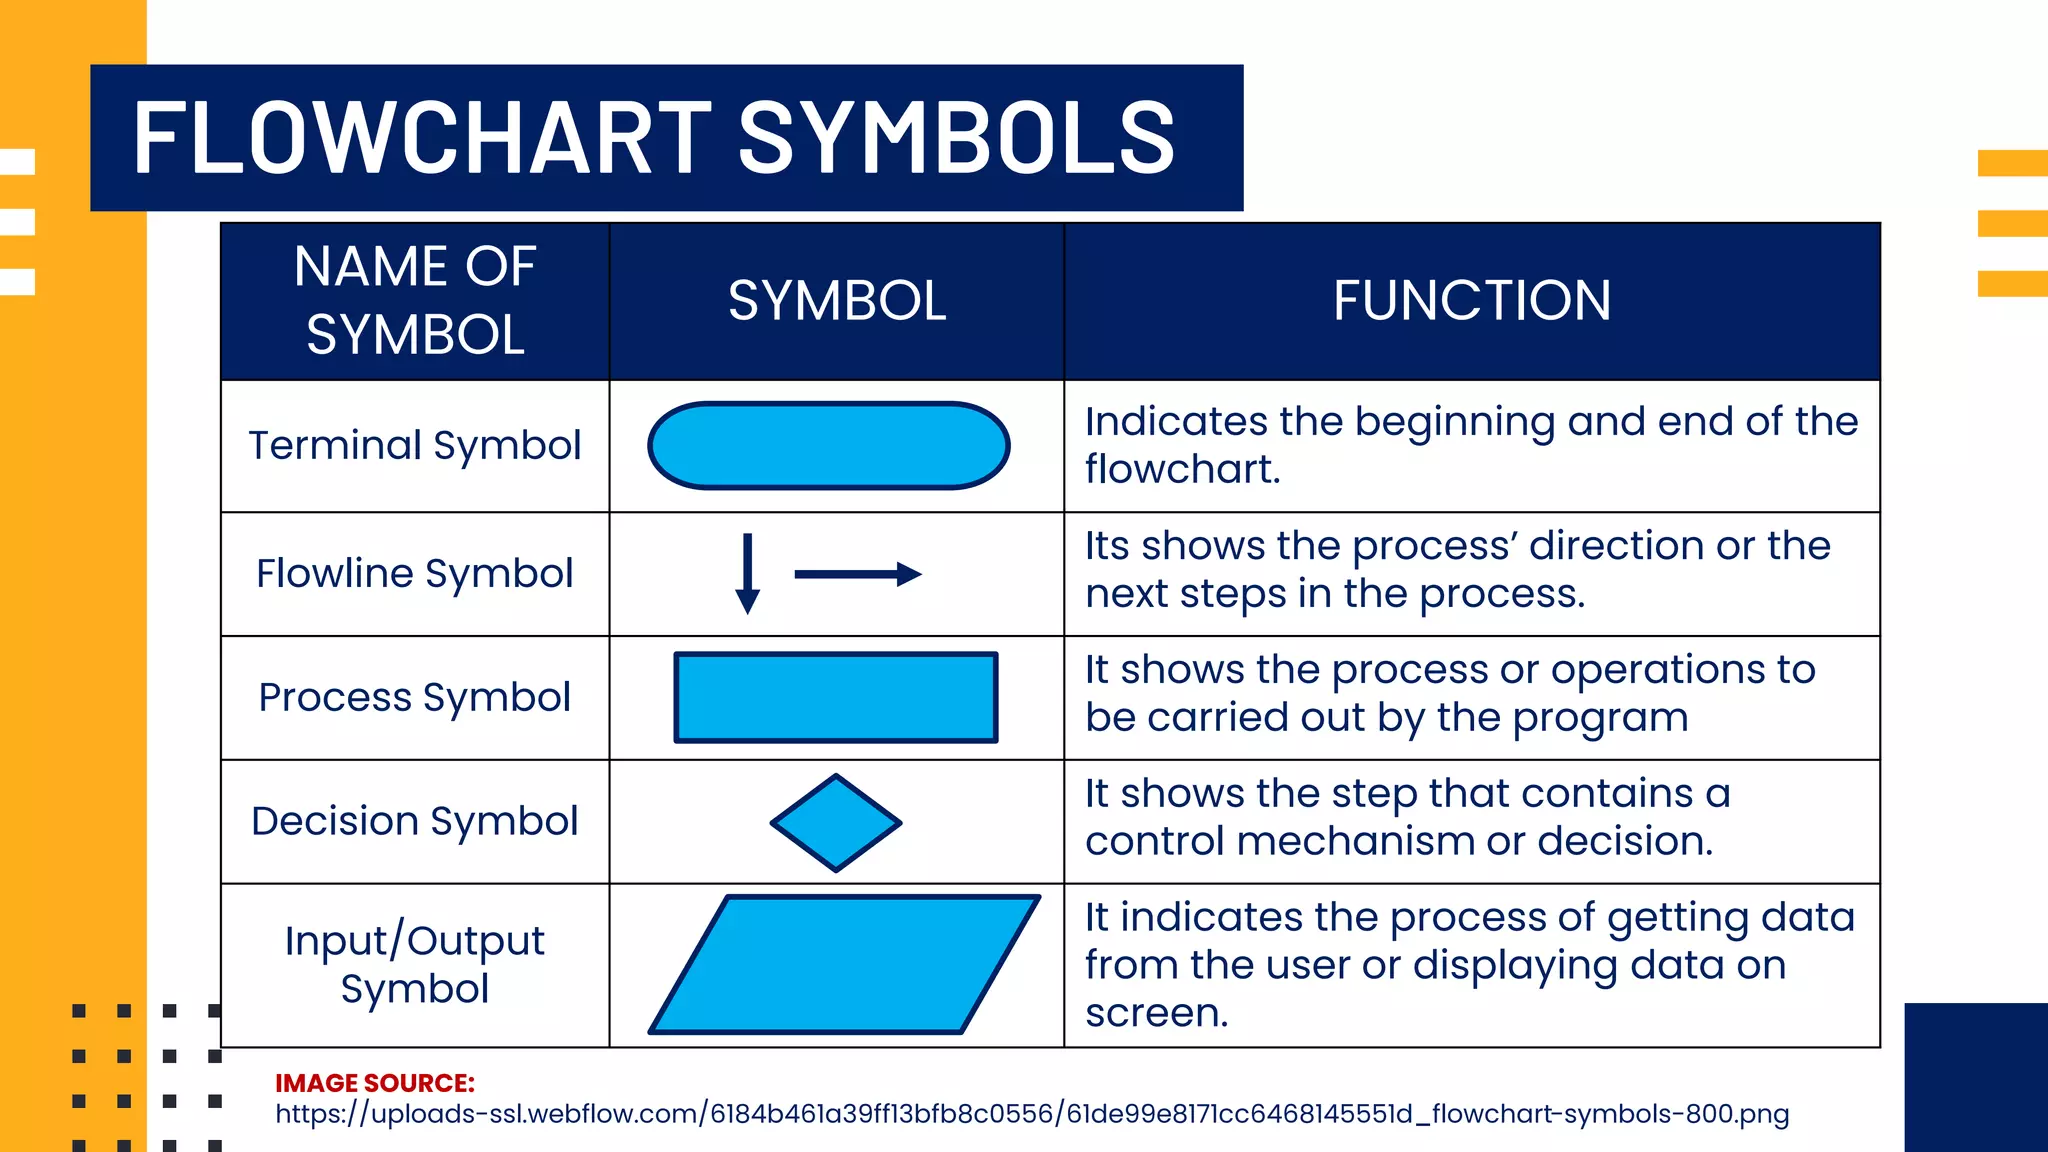
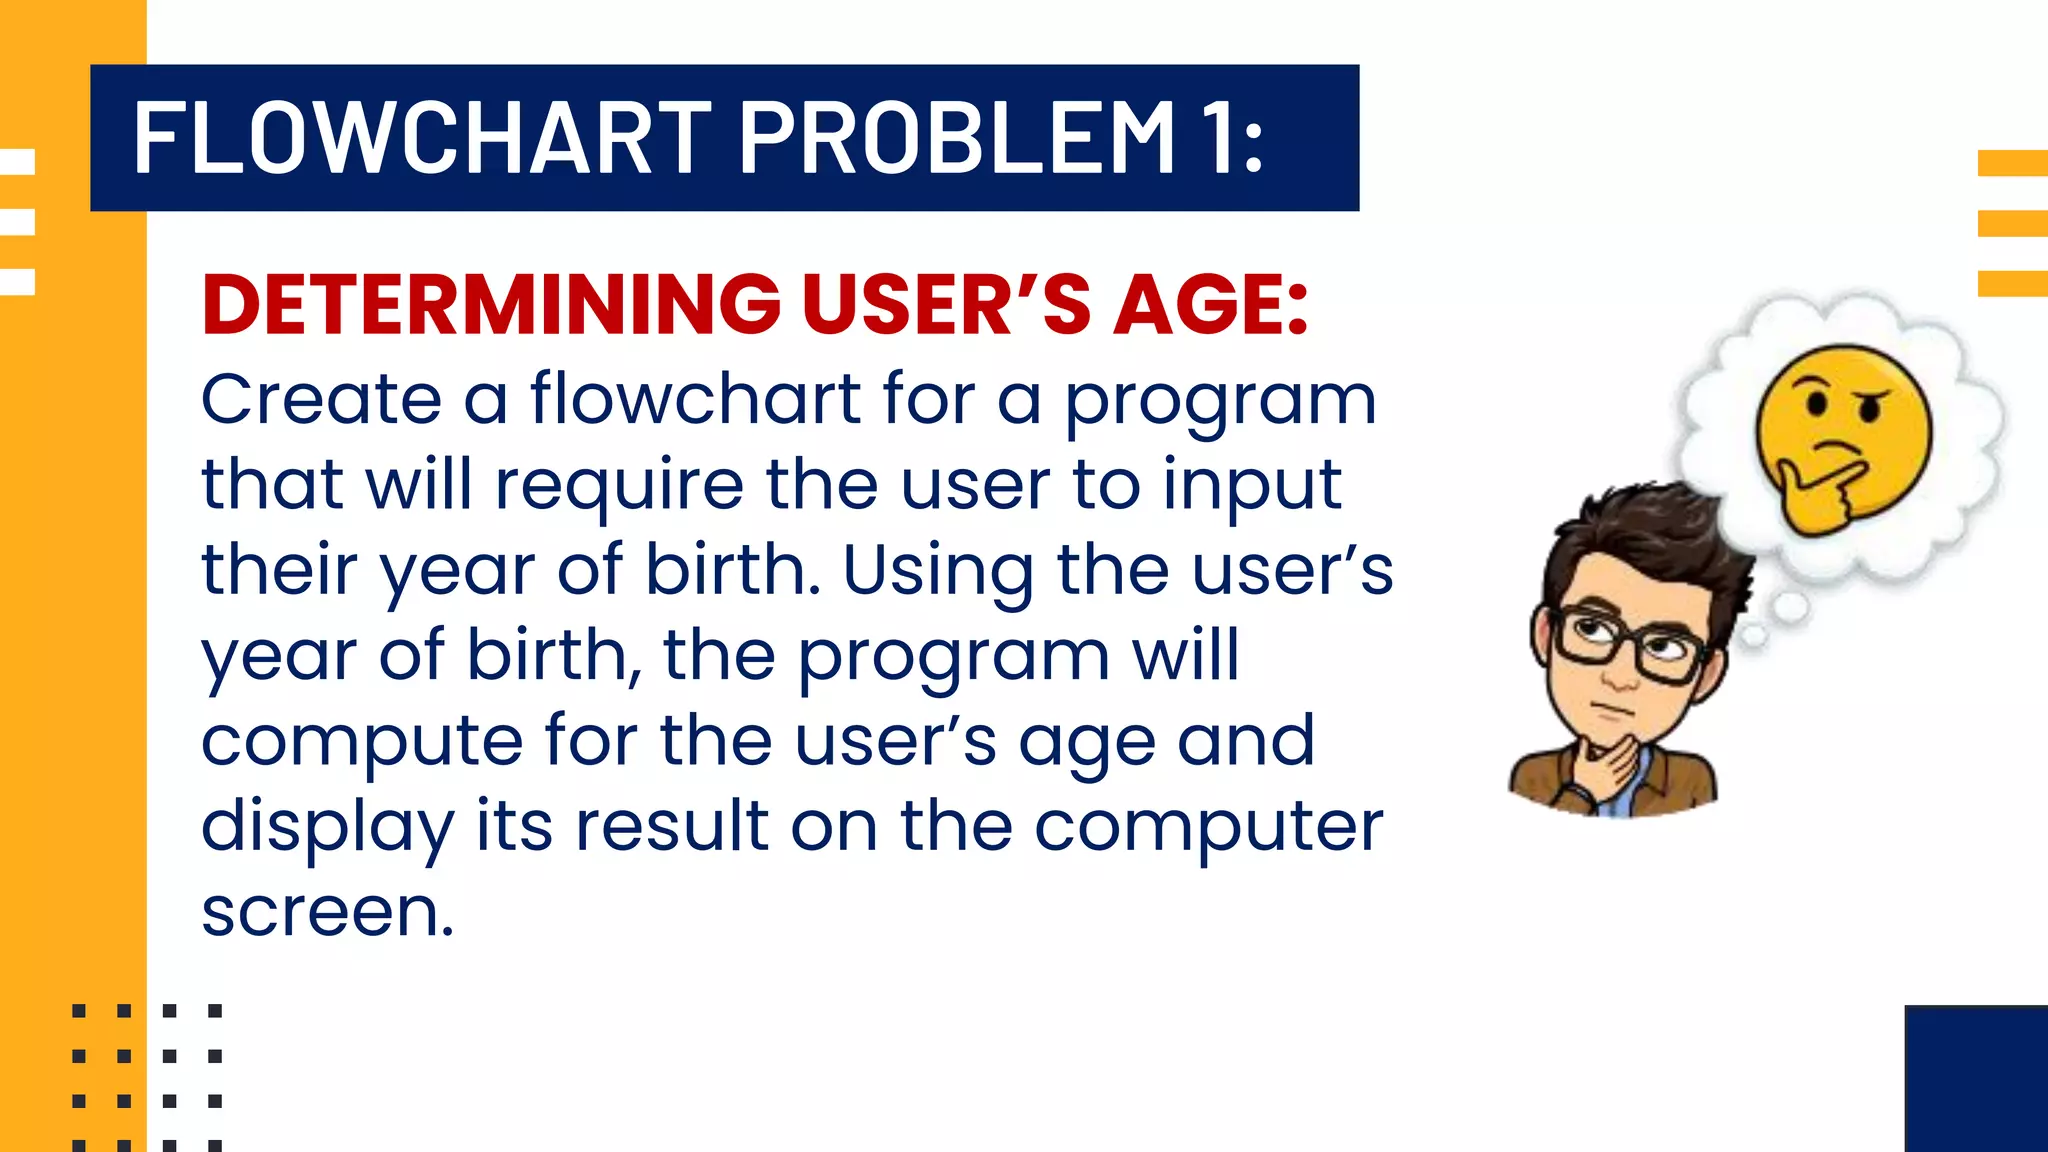
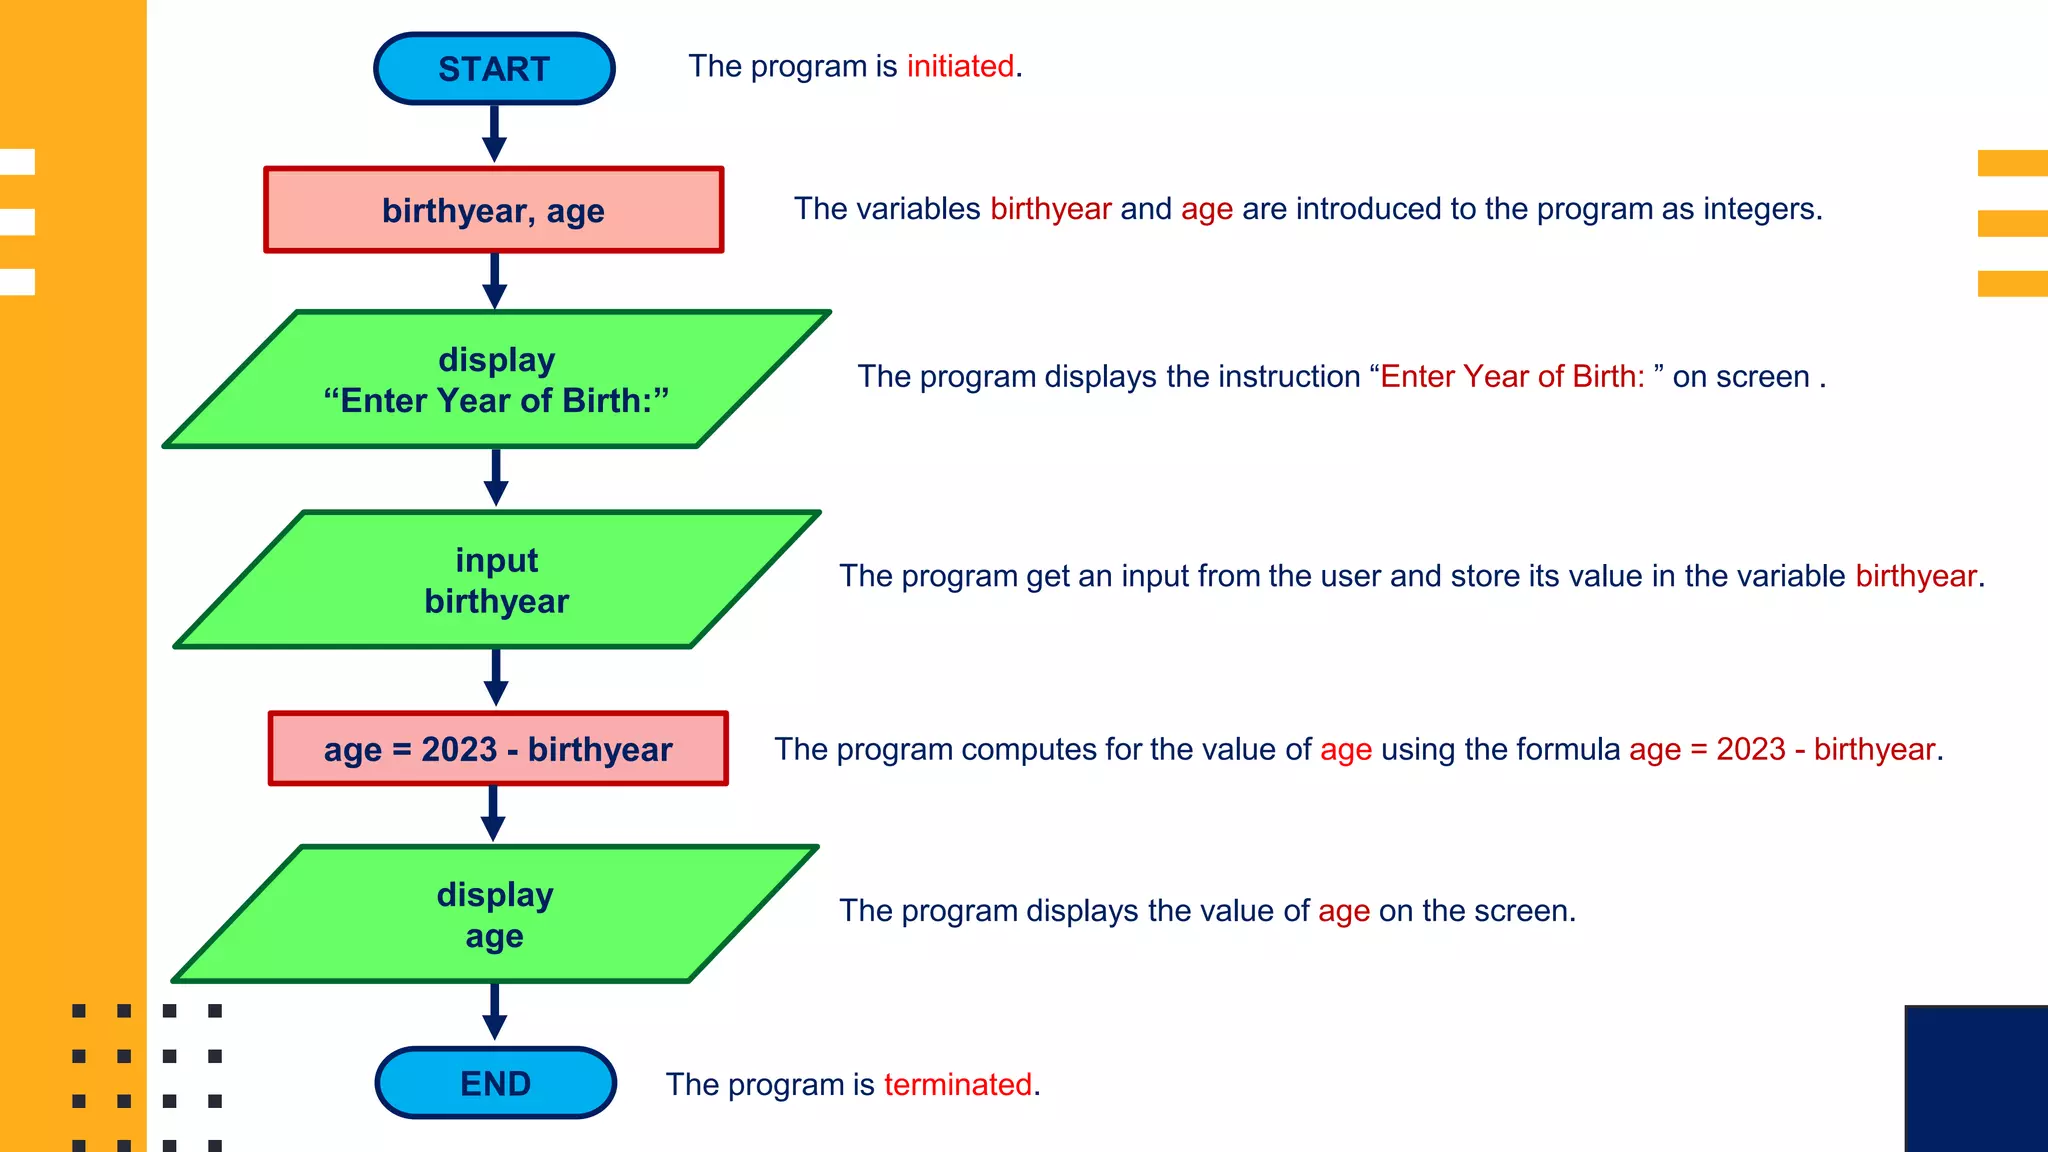
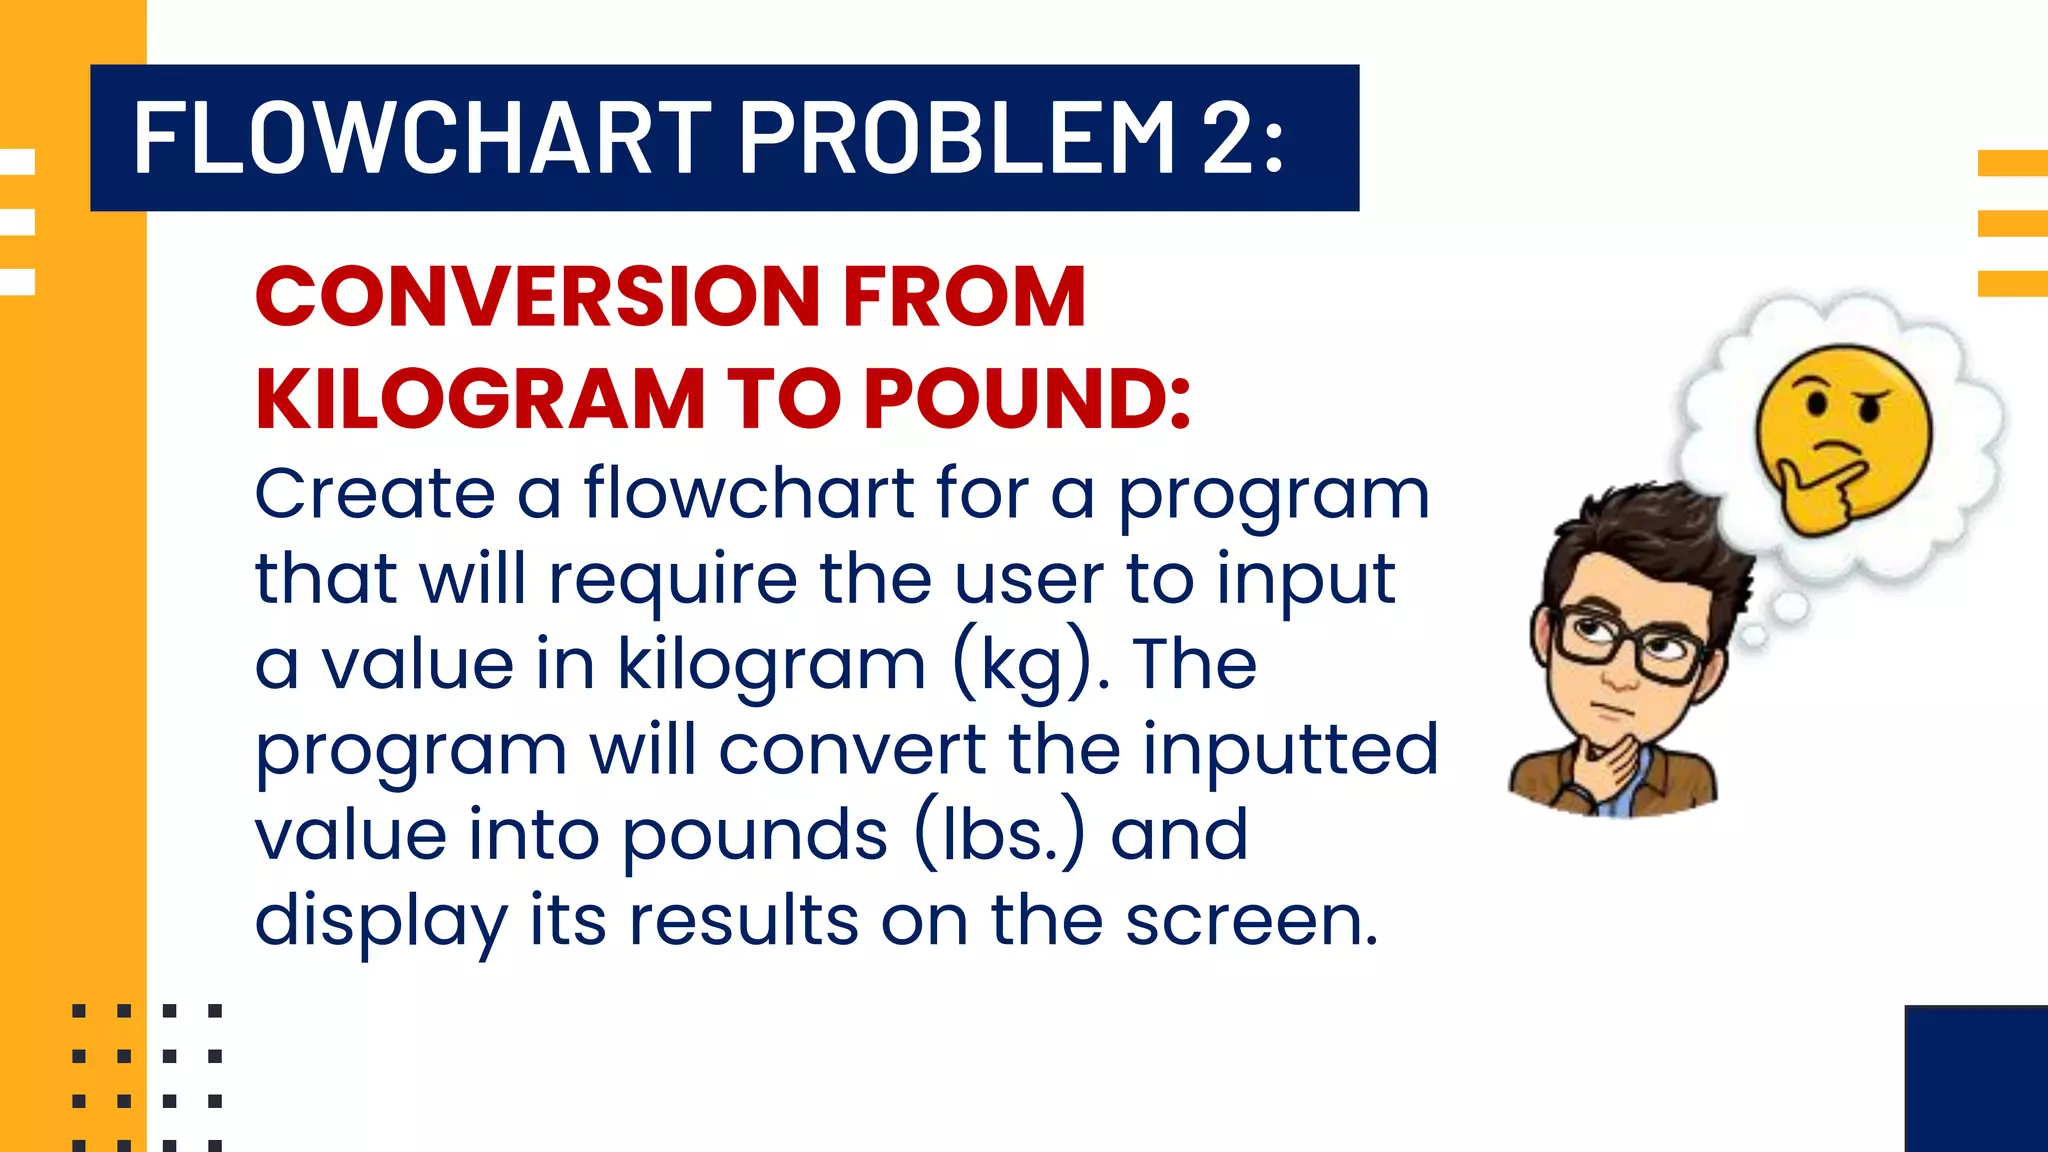

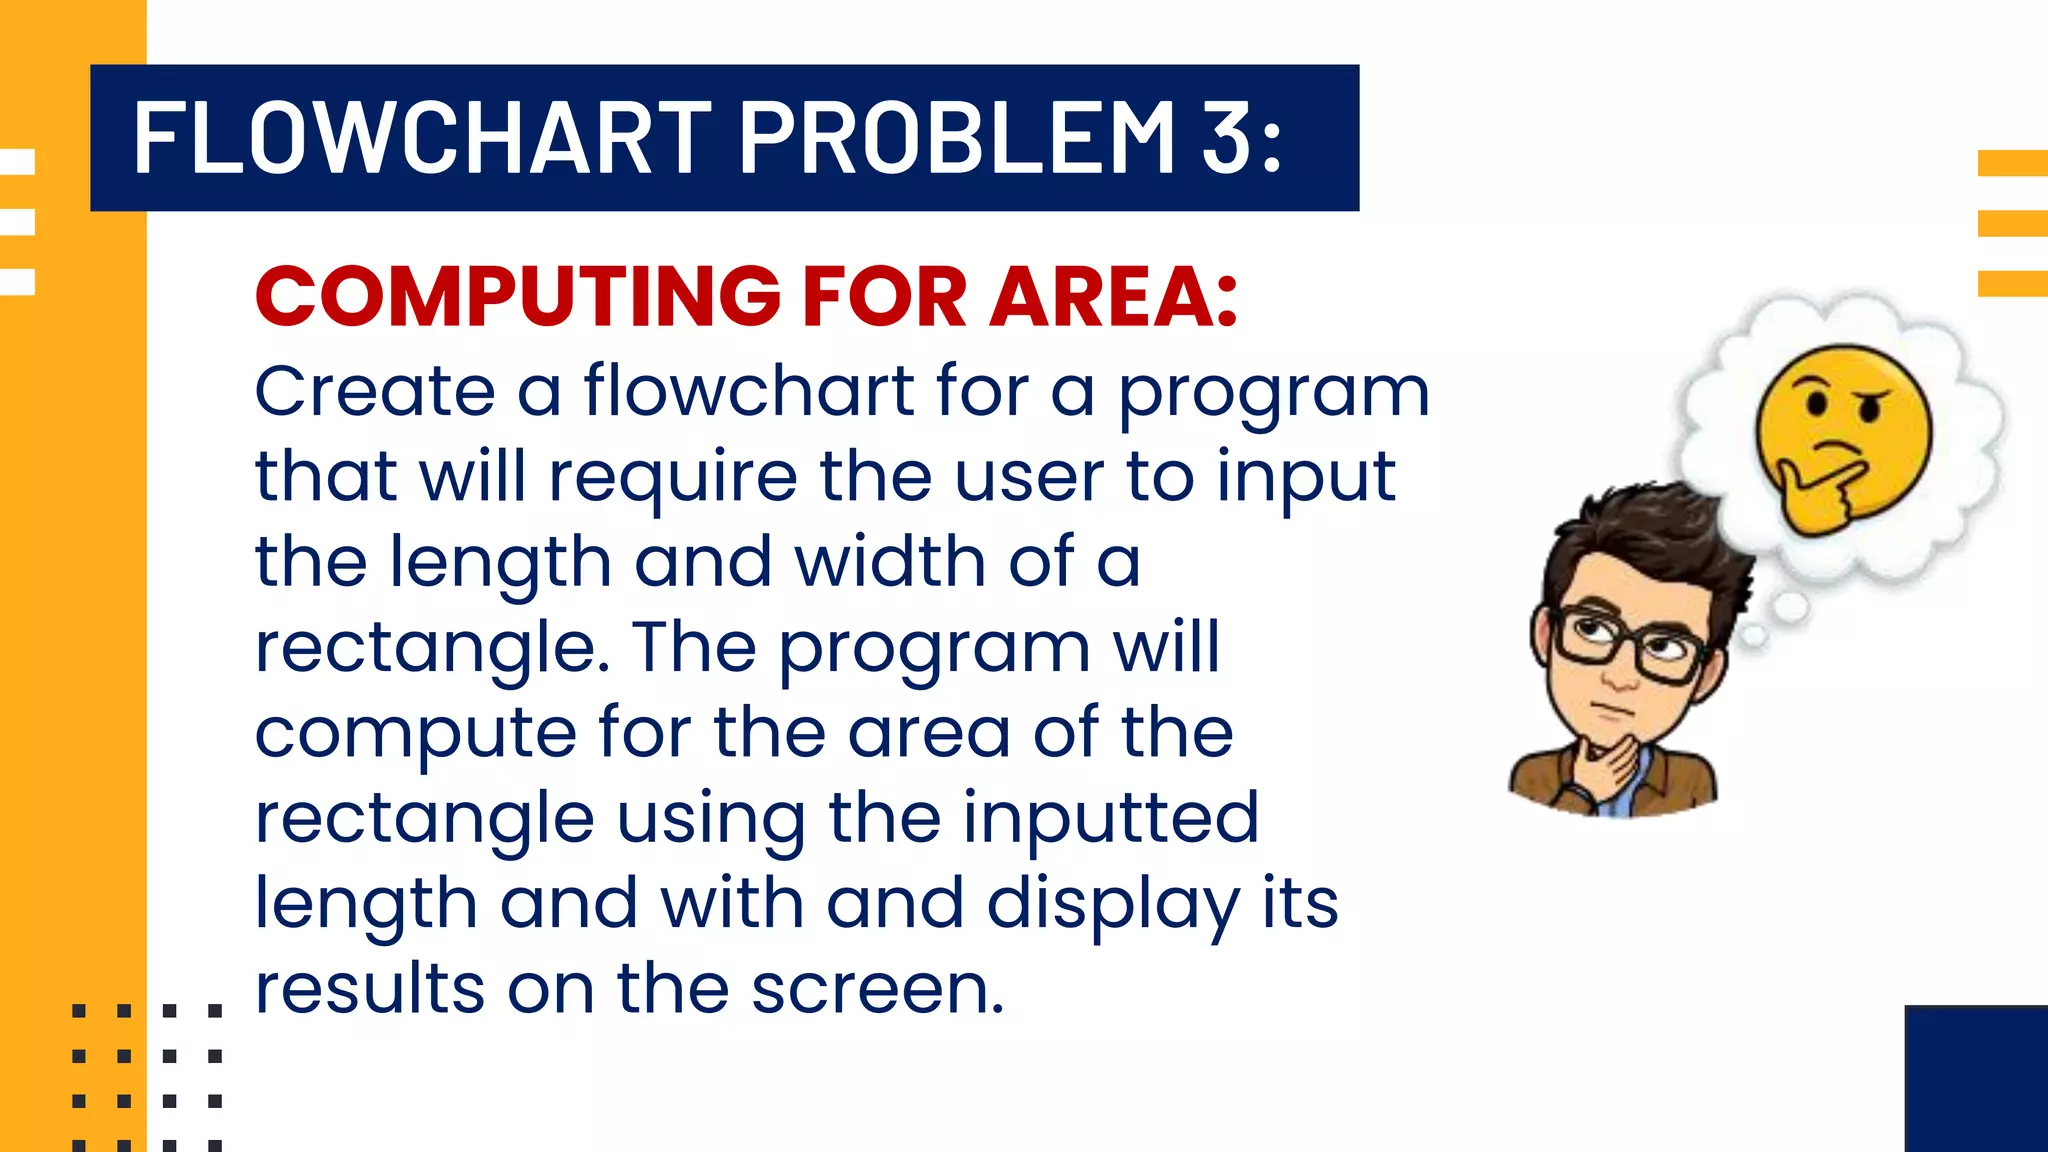
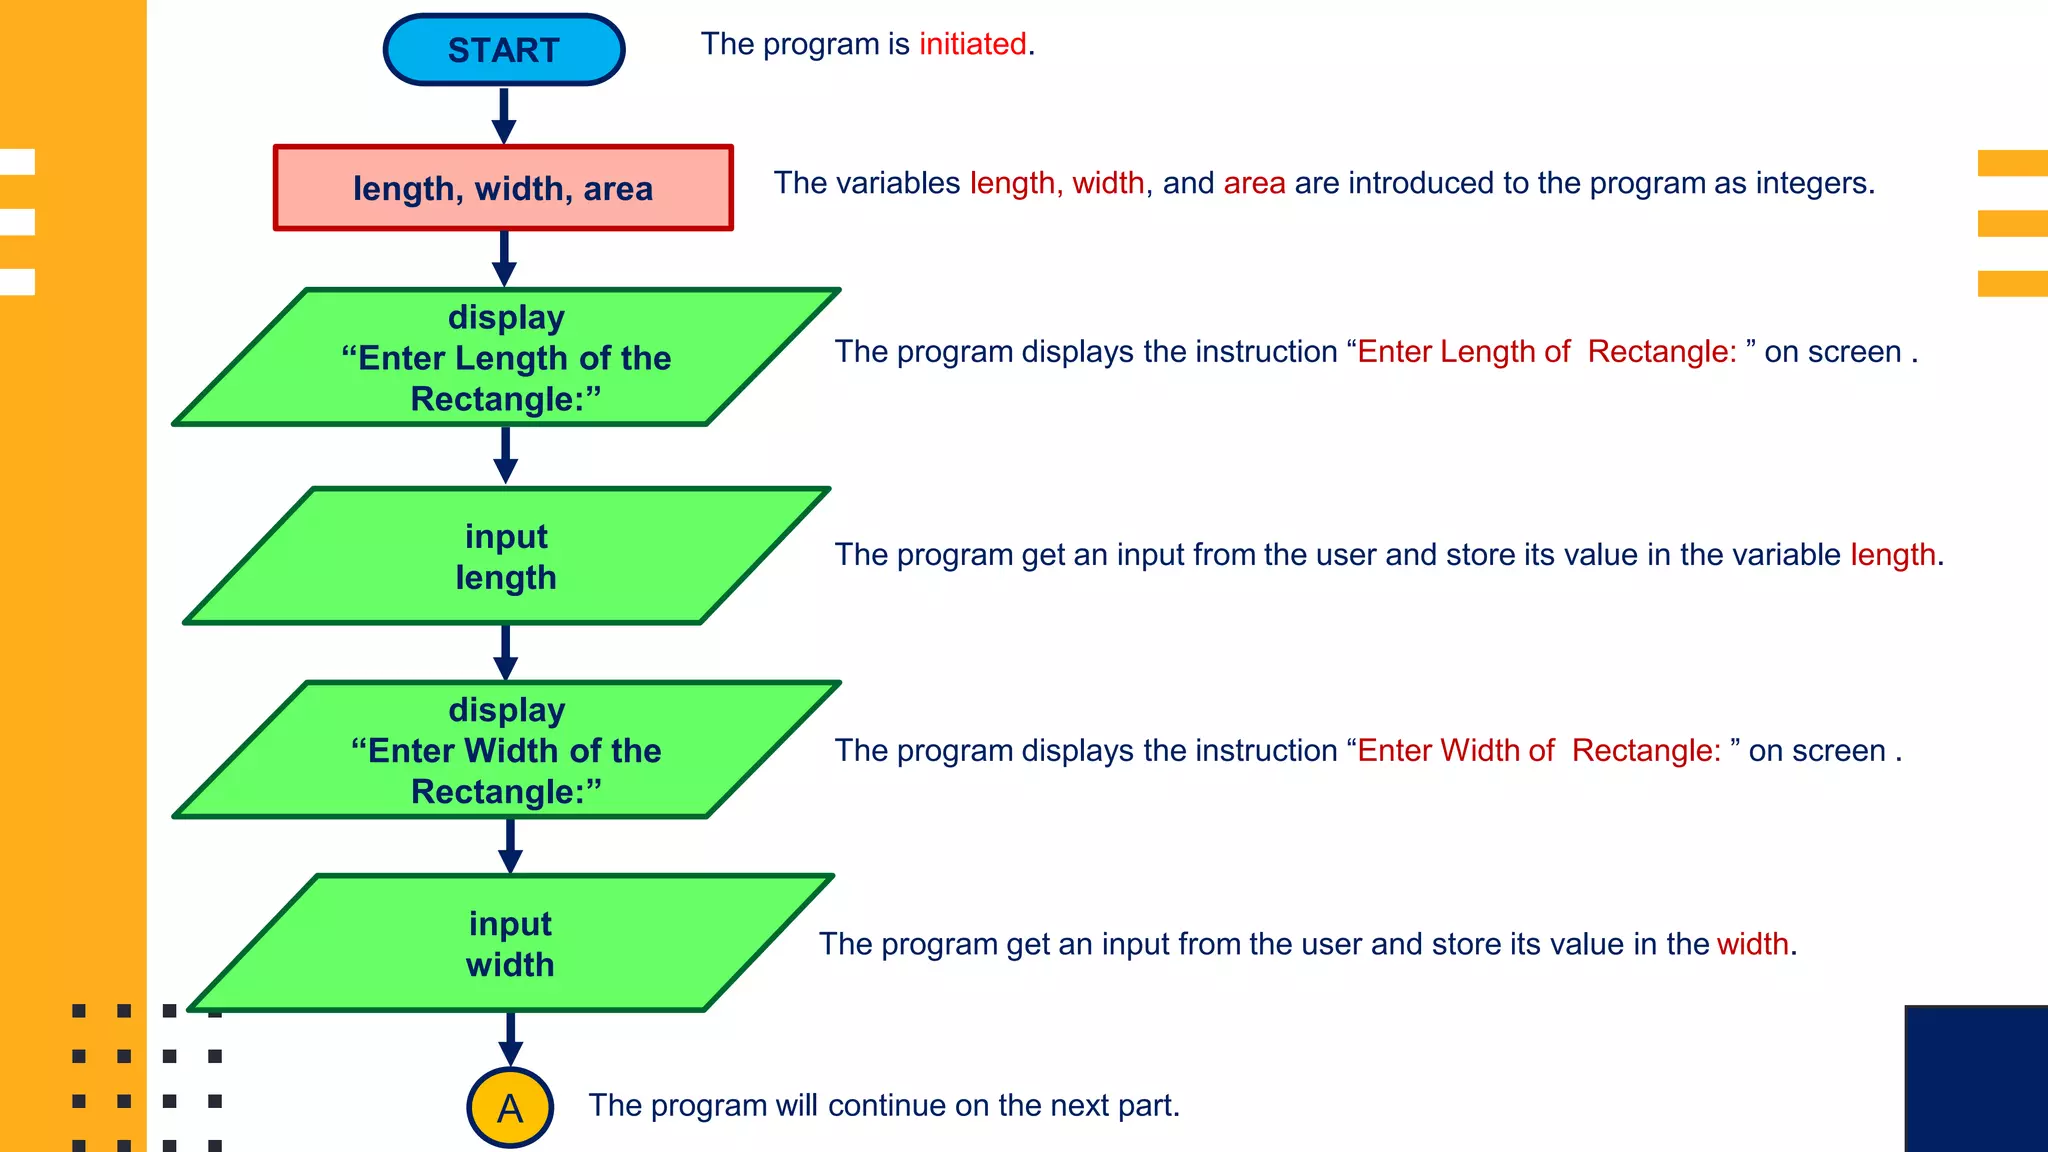
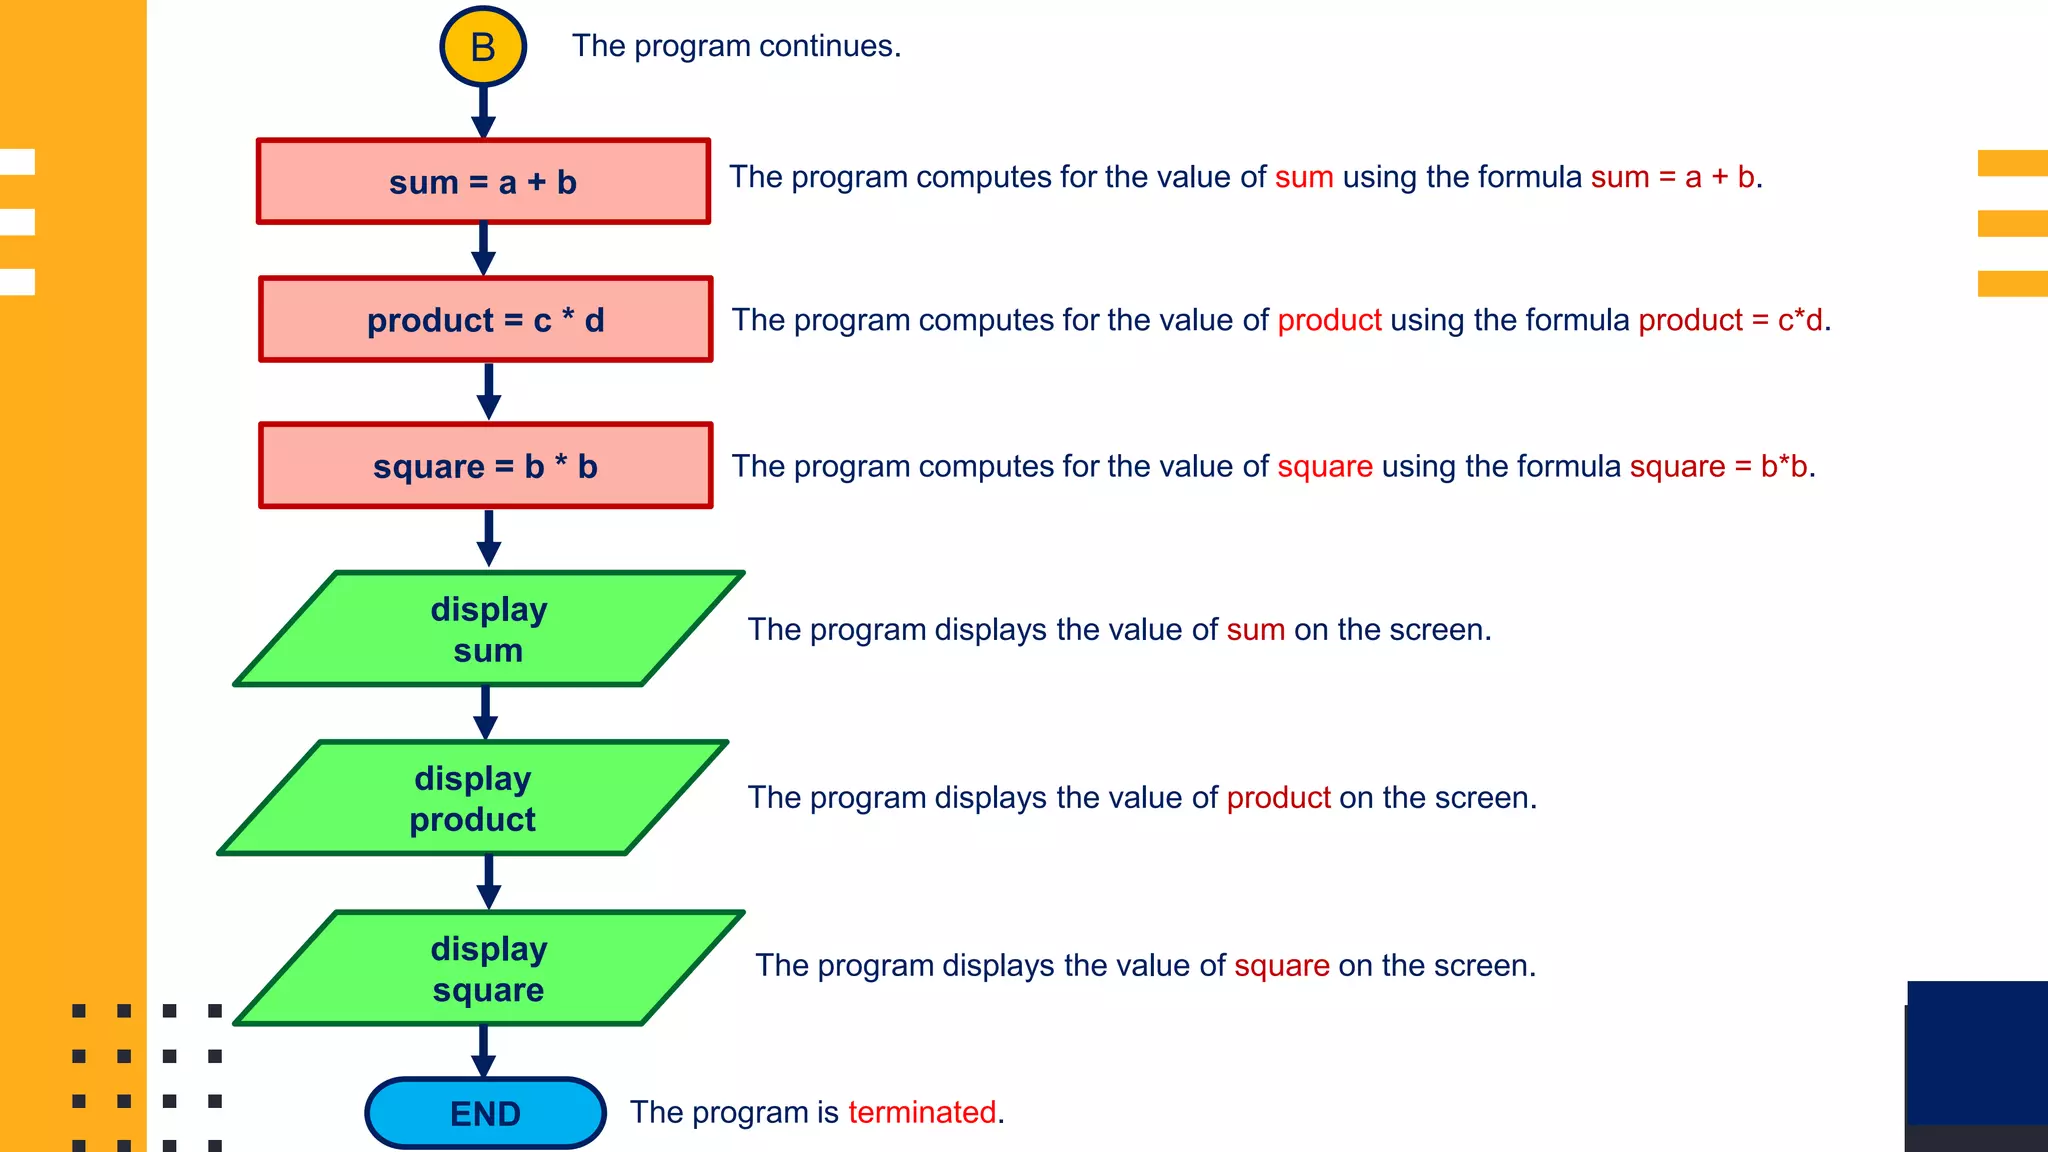
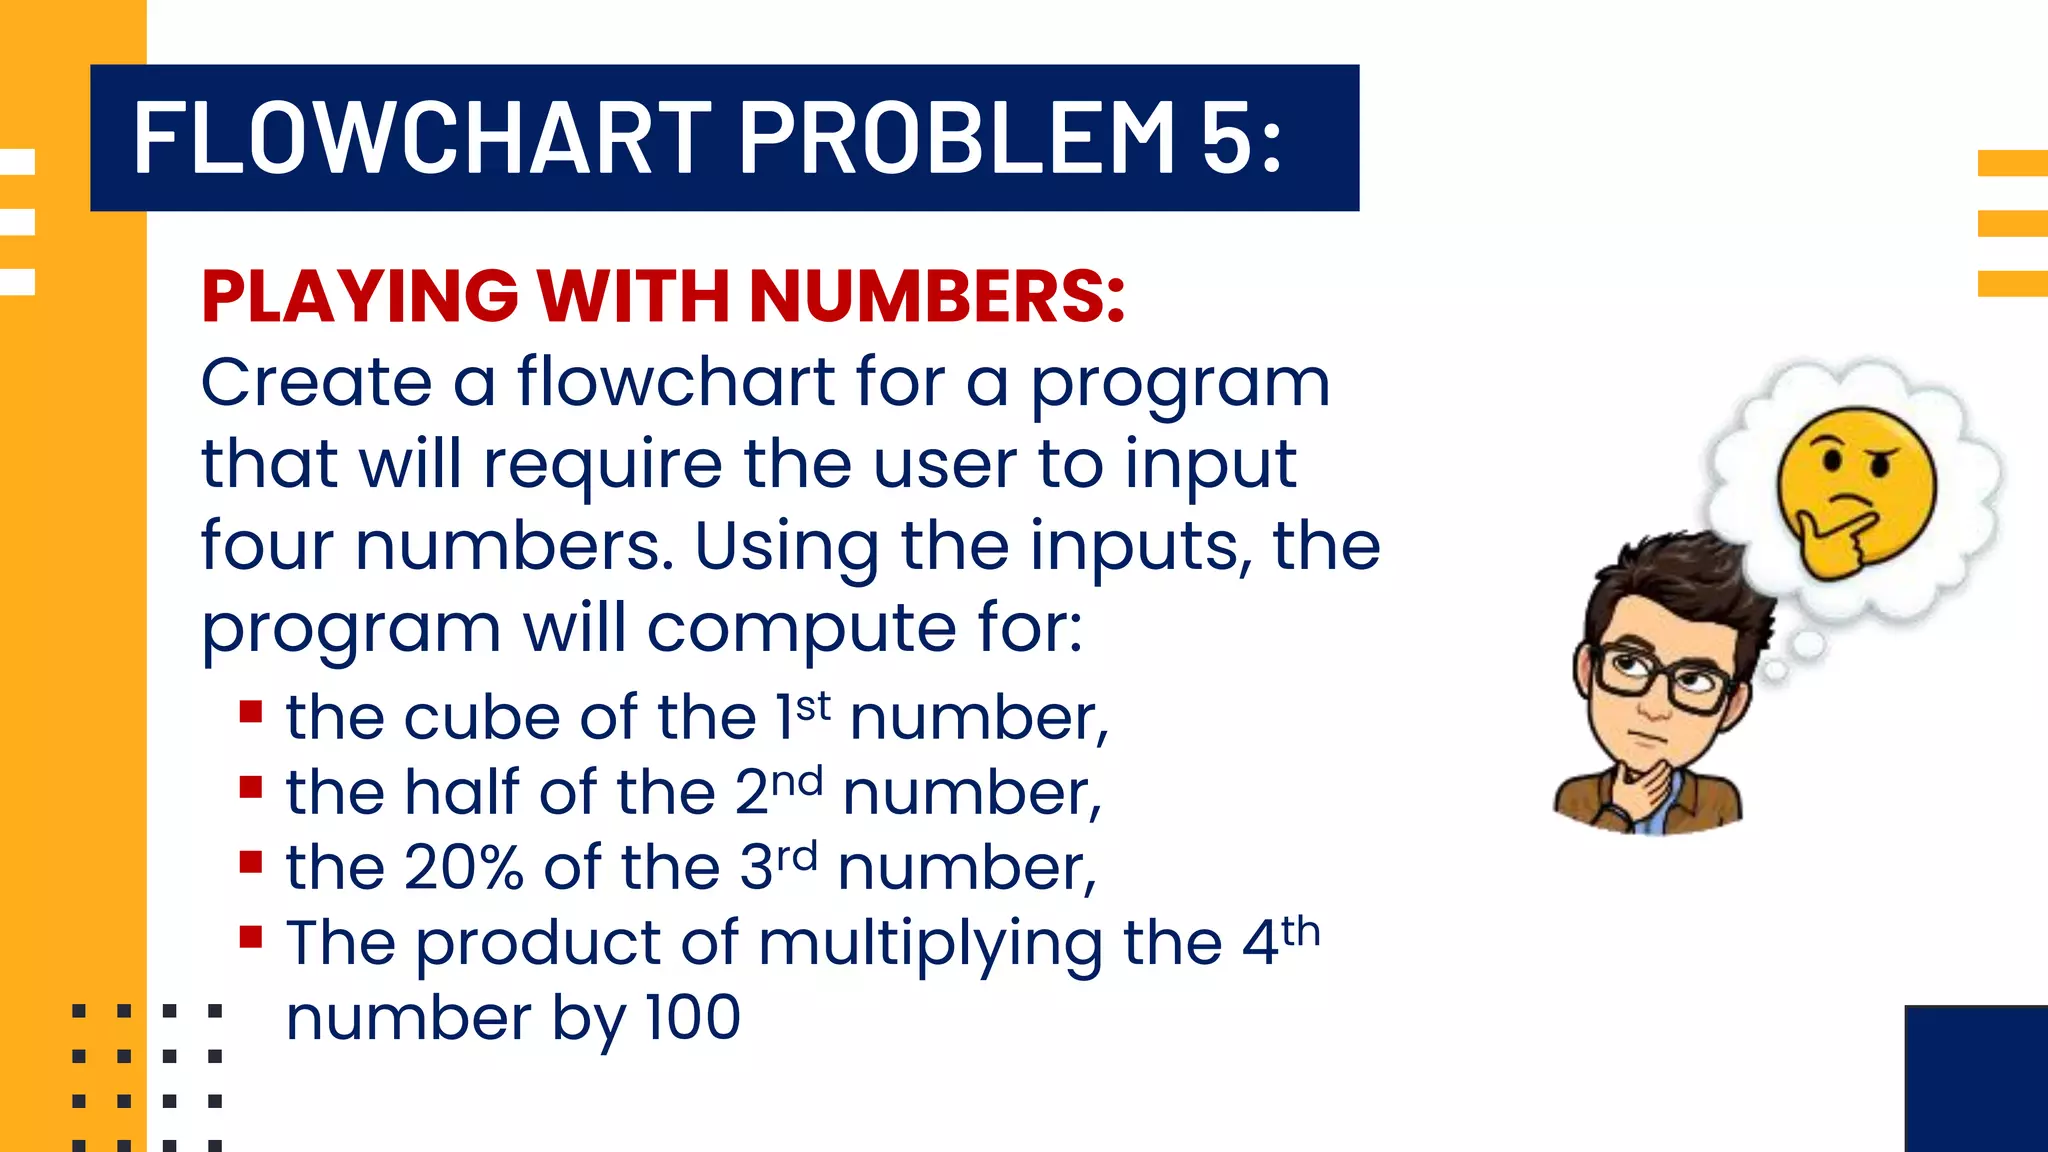
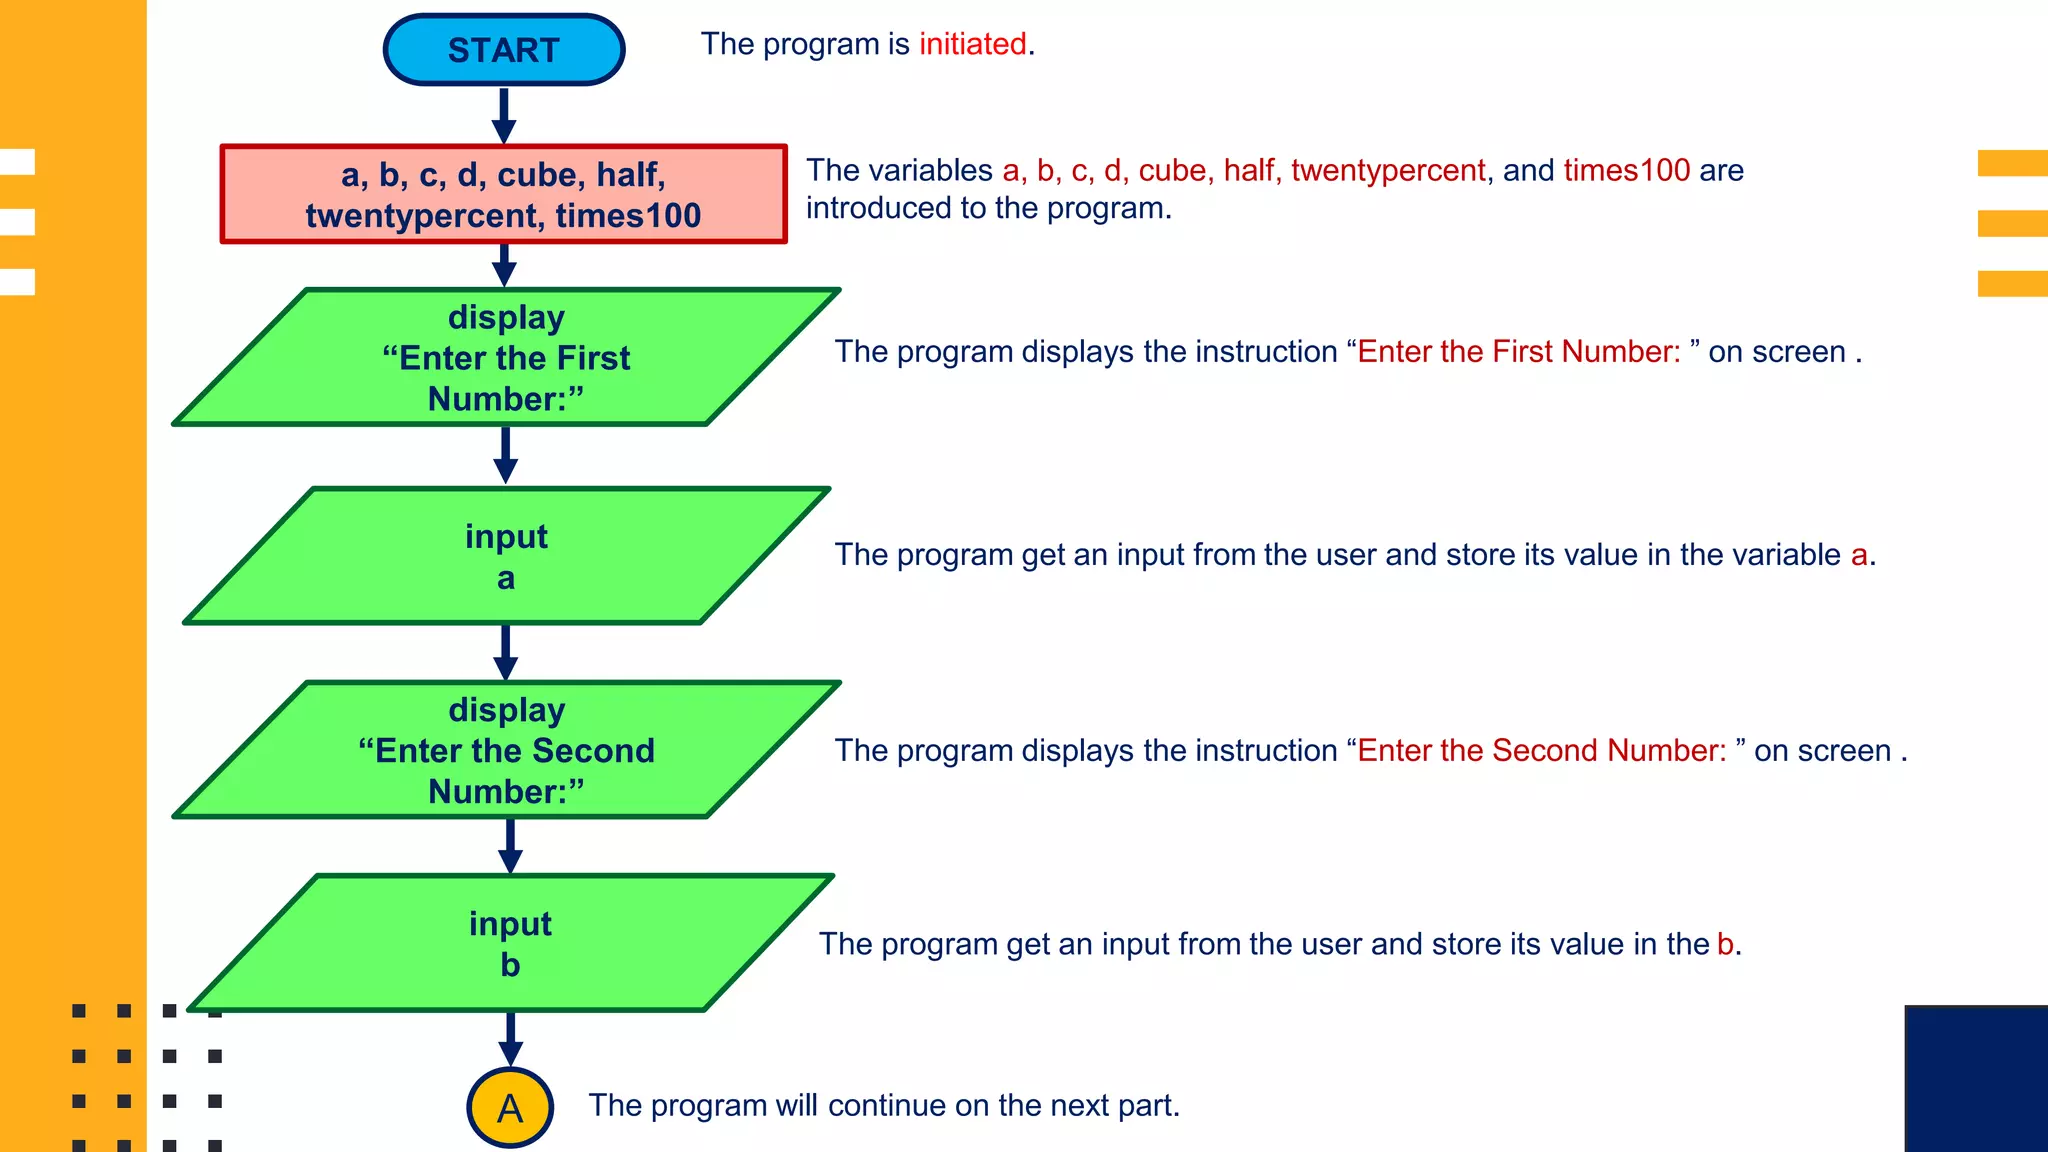

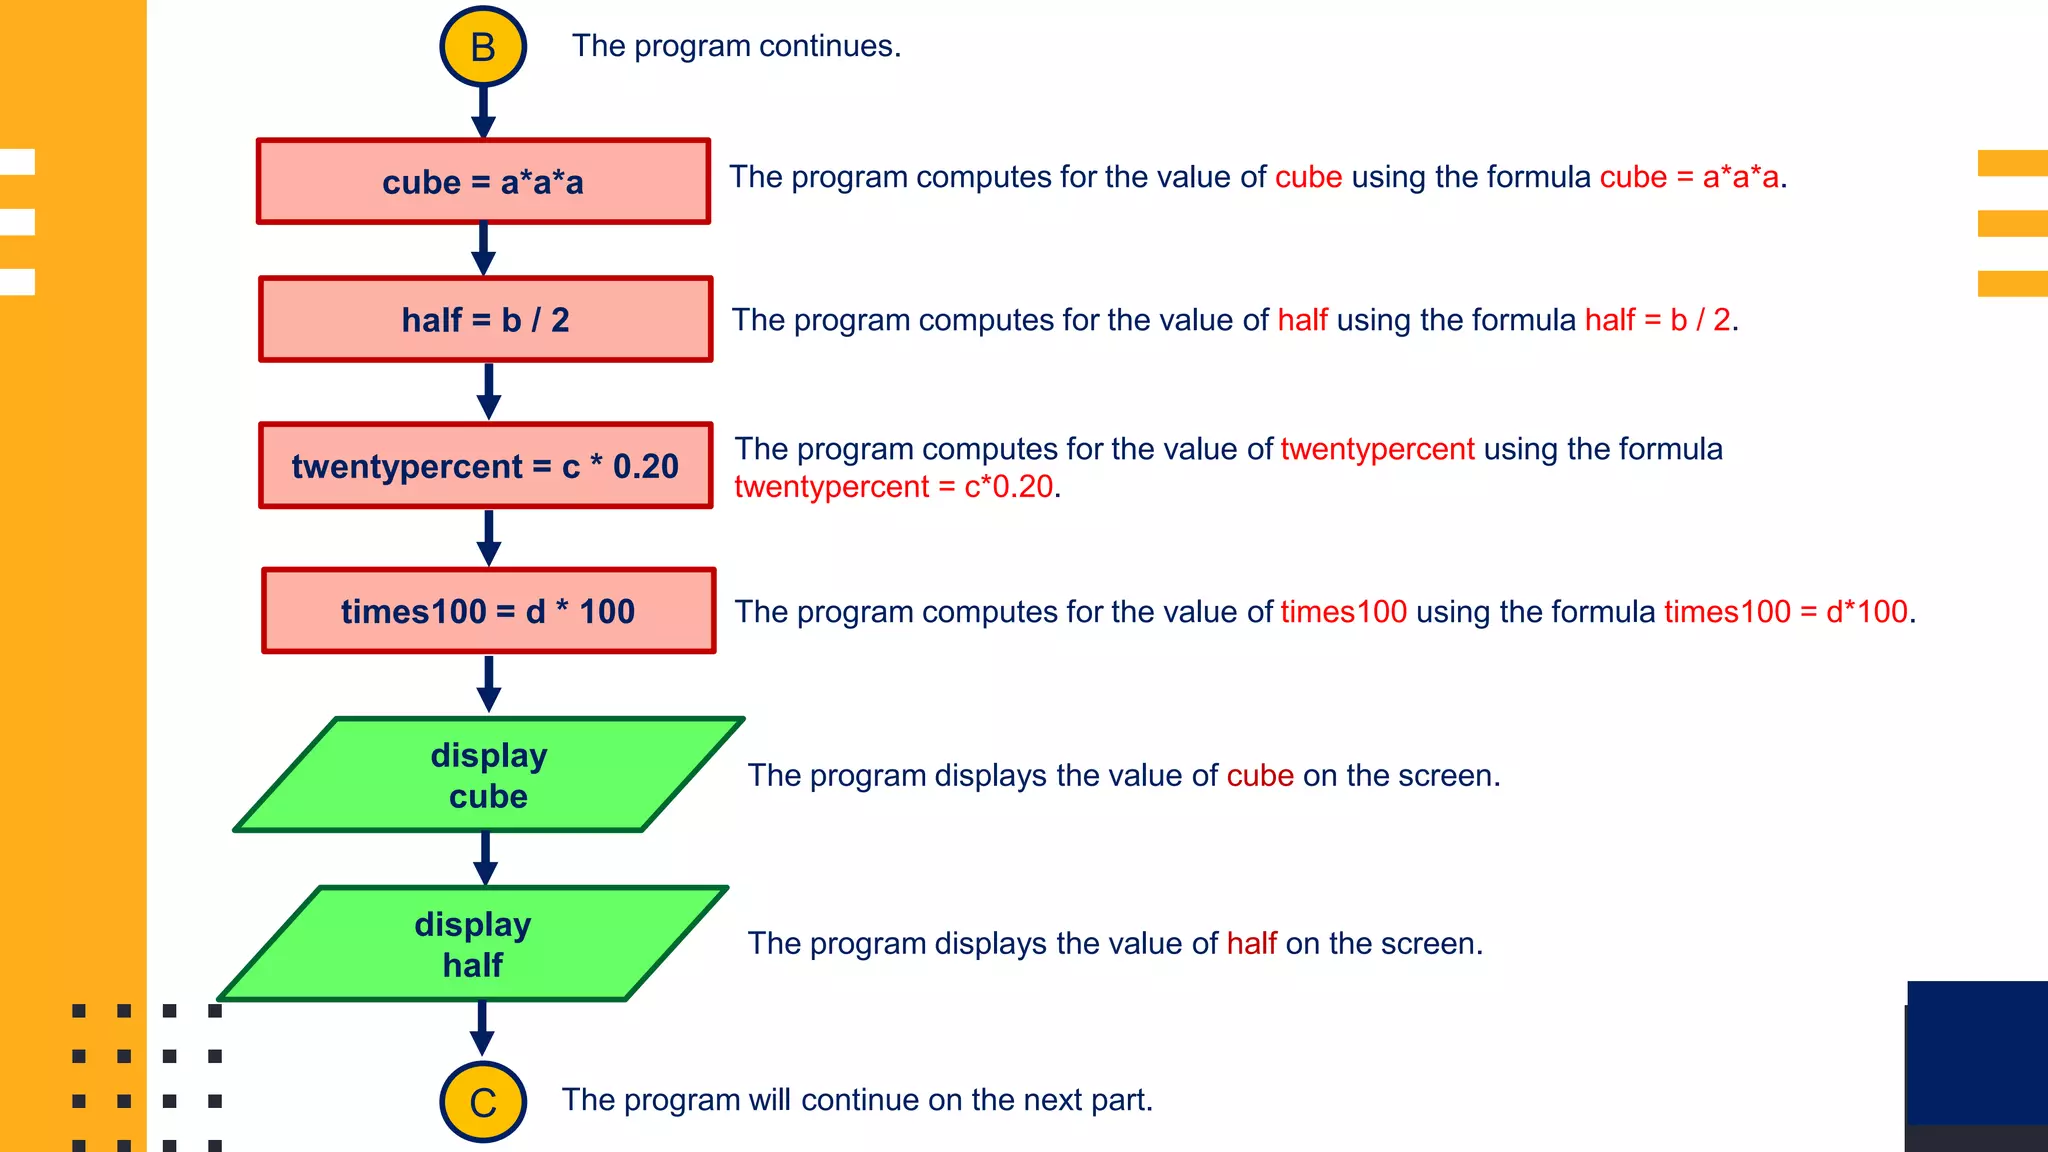
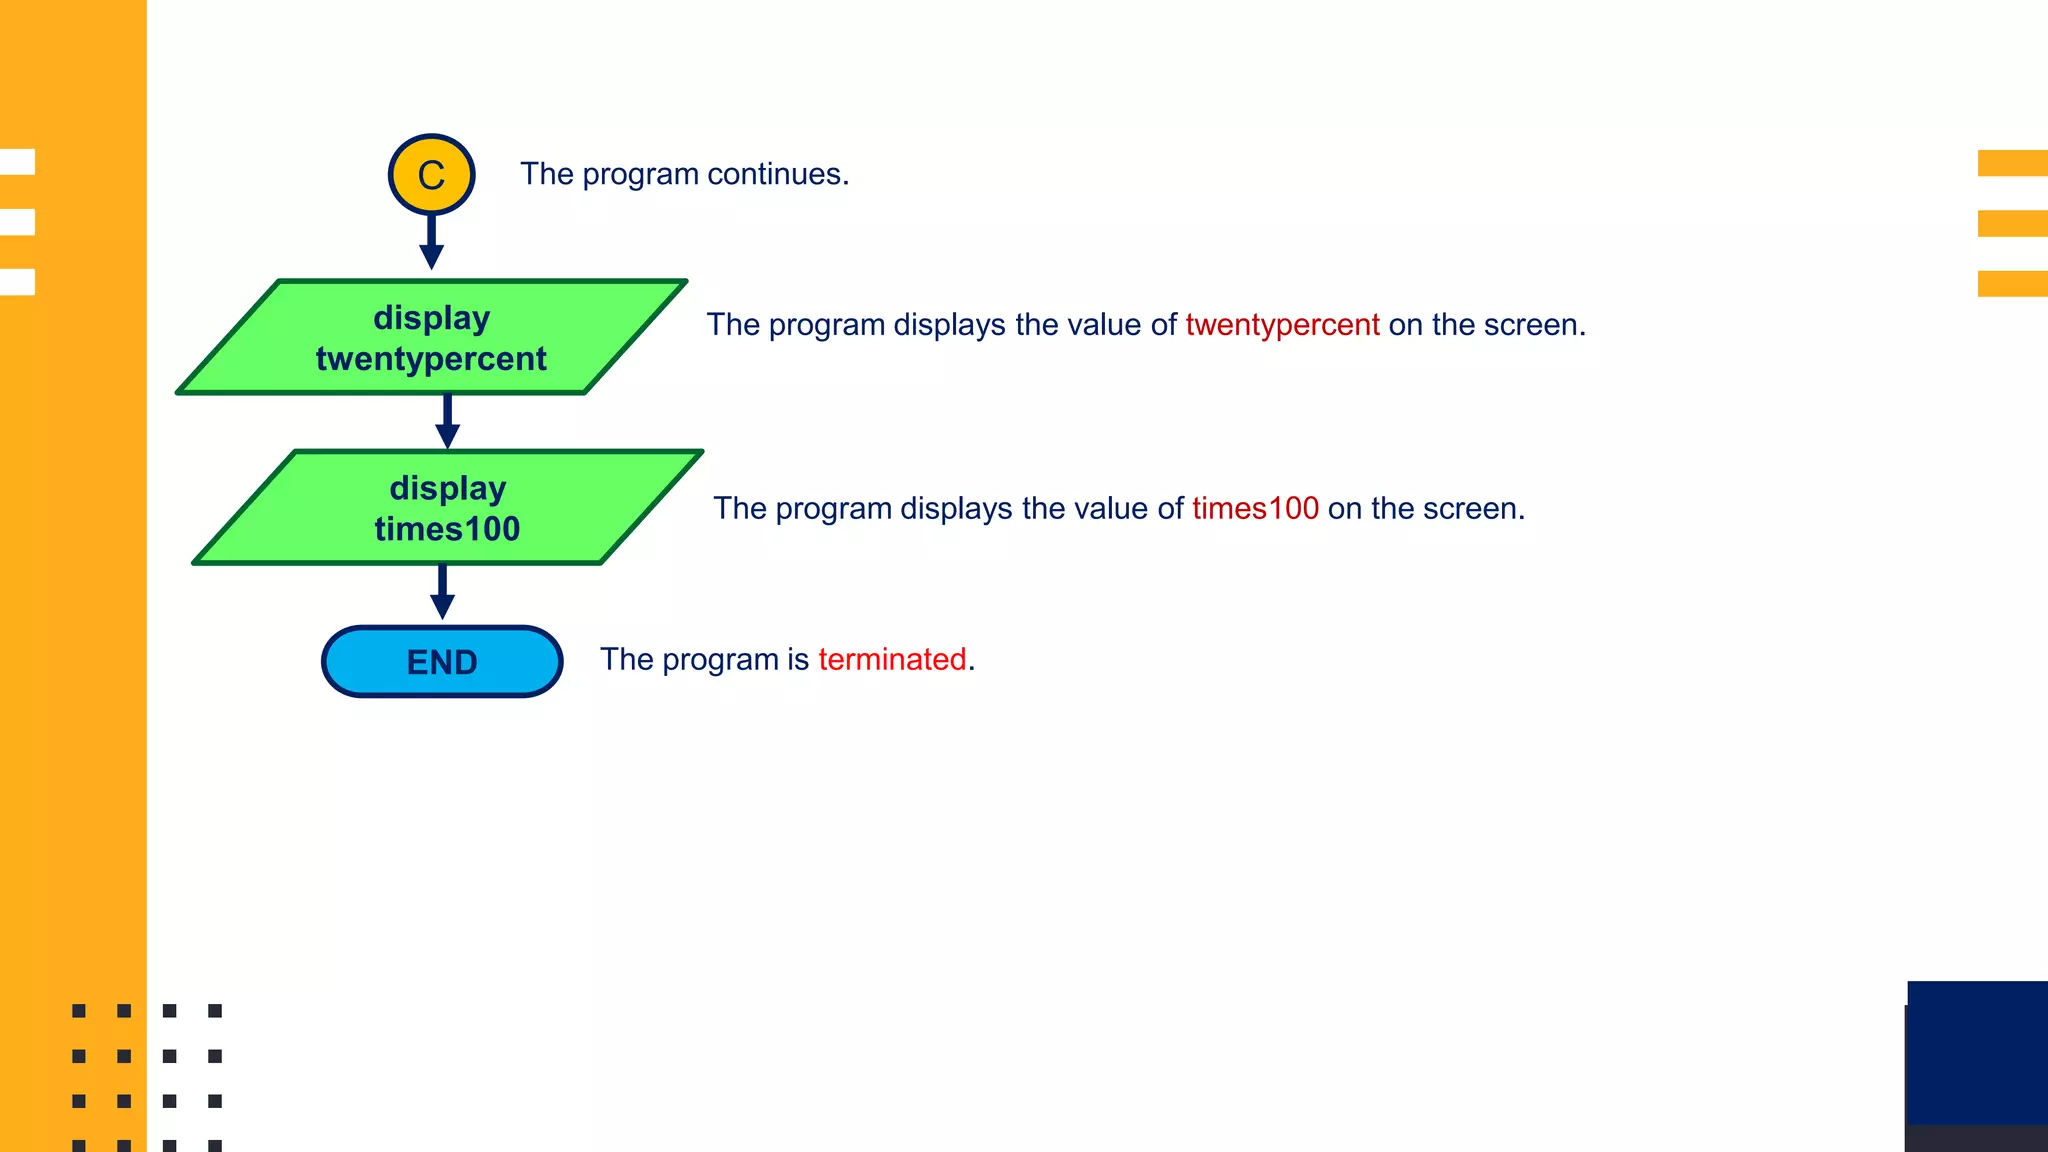


The document provides information about algorithms and flowcharting. It defines an algorithm as a series of well-defined steps to solve a problem and lists the key parts of an algorithm as the input, output, and process. It also defines a flowchart as a diagram that represents an algorithm or process visually using standard symbols. The document then provides examples of flowcharts for various problems that require inputs, calculations, and output displays. It demonstrates the basic flowchart symbols and layout. Finally, it includes some practice problems for creating flowcharts.