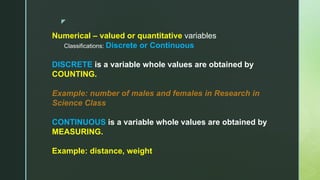
2. z
WE DO STATISTICS IN ALMOST EVERY DAY
OF OUR LIVES.
Examples:
- Clinician records the results of a physical examination of a patient, he
is collecting data to aid the physician in diagnosing the patient’s
illness and to determine the appropriate medical treatment to be
prescribed to the patient.
- When a teacher records the examination scores of the students in a
particular subject, he is recording data which he can use later on to
determine in his method of teaching has been effective or to know how
well the students performed in the test or to know the degree of ease or
difficulty of the test.
3. z
A. STATISTICS
- a branch of applied mathematics which deals
with the collection, organization, presentation,
analysis and interpretation of data.
- DESCRIPTIVE STATISTICS
- INFERENTIAL STATISTICS
4. z
B. DESCRIPTIVE STATISTICS
- deals with the collection and presentation of
data and collection of summarizing values to
describe its group characteristics.
The most common summarizing values are
the MEASURES OF CENTRAL TENDENCY
(mean, median, mode) and variation.
5. z
For instance, one can describe a class of 40
students by the mean score in a given
examination in College Algebra.
Suppose the mean score is 56 (meaning the
average score) and the passing score is 45, then
one can see that the general majority of the
students passed the test.
If only 12 out of 60 students obtained scores
above 45, then it means that the exam is too
difficult or the teaching is not effective.
6. z
C. INFERENTIAL STATISTICS
- deals with predictions and inferences based
on the analysis and interpretation of the results
of the information gathered by the statistician.
Examples of statistical treatments:
t-test, z-test, analysis of variance, chi-square
and Pearson r.
7. z
D. VARIABLE
- is a numerical characteristics or attribute
associated with the population being studied.
Types of Variables
- Categorical or qualitative variables
- Numerical – valued or quantitative variables
Classifications: Discrete or Continuous
8. z
Categorical or qualitative variables
- are classified according to some attributes or
categories.
Examples:
Gender, eye color, religion, blood type, civil status.
Categories may be ordered, which may or may not be
assigned specific numerical values such as:
Performance Rating – Poor, Fair, Good, Very Good, Excellent
9. z
Numerical-valued or quantitative variables
- are variables that are classified according to
numerical characteristics such as height, age, pulse
rate, number of children.
Kung sa binisaya pa ^_^ ang Categorical, ug imong I break down iyang characteristics, example
sa Gender, you will get descriptions like MALE or FEMALE. If civil status, SINGLE or
MARRIED.
Unlike the Numerical na pag moingon ka height, number jud imong ihatag, like 5’2”, 6’9”. Ug
moingon ka ug tall or short, mahimo na siyang categorical kay naghatag naman ka ug
descriptions. Kung sa age, moingon kay ug 5, 7, 23, 34 (number in years) pero mahimong
siyang categorical kung moingon ka ug old, young, elderly, toddler.
10. z
Numerical – valued or quantitative variables
Classifications: Discrete or Continuous
DISCRETE is a variable whole values are obtained by
COUNTING.
Example: number of males and females in Research in
Science Class
CONTINUOUS is a variable whole values are obtained by
MEASURING.
Example: distance, weight
11. Let’s test if you have understood the concepts introduced.
CLICK THE LINK:
https://forms.gle/V4VgF3Ub4u8LoBw4A