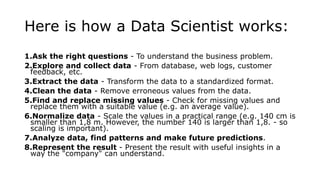
Data science uses statistics, machine learning, and data analysis to extract knowledge and insights from data. It allows companies to make better decisions, predictive analysis, and discover patterns. Data science is used across many industries and can be applied anywhere data is available, such as consumer goods, stock markets, logistics, and e-commerce. A data scientist requires expertise in machine learning, statistics, programming, mathematics, and databases to explore and analyze data, find patterns, and make predictions to help businesses.

![How to Structure Data?
• We can use an array or a database table to structure or
present data.
• Example of an array:
• [80, 85, 90, 95, 100, 105, 110, 115, 120, 125]](https://image.slidesharecdn.com/lecture3-231127120337-70318468/85/Lecture3-pptx-11-320.jpg)
![Try this:
Array=[80, 85, 90, 95, 100, 105, 110, 115, 120, 125]
print(Array)](https://image.slidesharecdn.com/lecture3-231127120337-70318468/85/Lecture3-pptx-12-320.jpg)

![Data Science - Python DataFrame
• Create a DataFrame with Pandas
• A data frame is a structured representation of data.
import pandas as pd
d = {'col1': [1, 2, 3, 4, 7], 'col2': [4, 5, 6, 9, 5], 'col3':
[7, 8, 12, 1, 11]}
df = pd.DataFrame(data=d)
print(df)
We write pd. in front of DataFrame() to let Python know that we want to activate the
DataFrame() function from the Pandas library.
Be aware of the capital D and F in DataFrame!](https://image.slidesharecdn.com/lecture3-231127120337-70318468/85/Lecture3-pptx-19-320.jpg)
![Example 1
Count the number of columns:
• count_column = df.shape[1]
print(count_column)
Example 2
Count the number of rows:
count_row = df.shape[0]
print(count_row)](https://image.slidesharecdn.com/lecture3-231127120337-70318468/85/Lecture3-pptx-20-320.jpg)
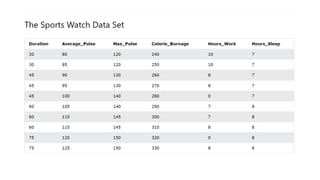
![The mean() function
The NumPy mean() function is used to find the average value of an
array.
Example:
import numpy as np
Calorie_burnage = [240, 250, 260, 270, 280, 290, 300, 310, 320, 330]
Average_calorie_burnage = np.mean(Calorie_burnage)
print(Average_calorie_burnage)](https://image.slidesharecdn.com/lecture3-231127120337-70318468/85/Lecture3-pptx-24-320.jpg)

![Data Cleaning
• import pandas as pd
• sample_data = pd.read_csv("music.csv")
• X= sample_data.drop(columns=['genre'])
• print(X)](https://image.slidesharecdn.com/lecture3-231127120337-70318468/85/Lecture3-pptx-26-320.jpg)