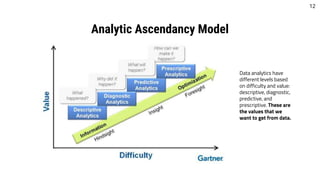
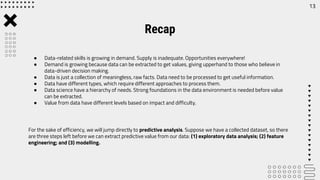
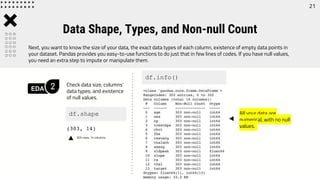
The document outlines career opportunities in data-related fields, emphasizing the high demand for data science skills across various industries due to the growing importance of data-driven decision-making. It elaborates on the data science hierarchy of needs, detailing processes like exploratory data analysis and feature engineering necessary for extracting valuable information from raw data. The presentation further discusses predictive analysis and machine learning approaches, using a heart disease dataset as an example to illustrate the techniques involved.


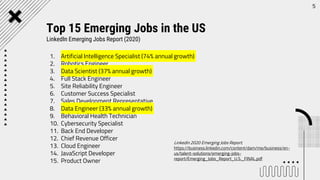


![Data Visualization
EDA 4
Freely explore the data. Use data visualization to help make
your exploration more intuitive.
import matplotlib.pyplot as plt
fig, ax = plt.subplots(figsize=(6, 6))
colors = {1:'red', 0:'blue'}
grouped = df.groupby('target')
for key, group in grouped:
group.plot(ax=ax, kind='scatter', x='age',
y='thalach', label=key, color=colors[key])
plt.show()
23](https://image.slidesharecdn.com/machinelearning101-210724051457/85/Machine-learning-101-23-320.jpg)

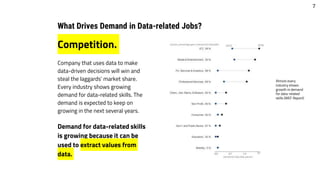
![Check outliers. Outliers may cause biased models.
Outlier Checking
EDA 6
fig, ax = plt.subplots(nrows=1, ncols=len(df.columns), figsize =
(20,5))
for i,c in enumerate(df.columns):
sns.boxplot(data=df, y=c, ax = ax[i])
fig.tight_layout()
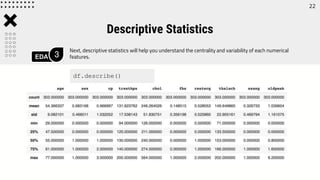
Box and whisker plot
25](https://image.slidesharecdn.com/machinelearning101-210724051457/85/Machine-learning-101-25-320.jpg)
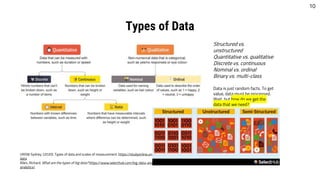
![Linearity check give us better understanding of the distribution of data points in each feature and
the skewness of the features.
Linearity and Distribution Check
EDA 7
fig, ax = plt.subplots(nrows=1, ncols=len(df.columns), figsize =
(20,5))
for i,c in enumerate(df.columns):
sns.histplot(data=df, y=c, ax = ax[i])
fig.tight_layout()
26](https://image.slidesharecdn.com/machinelearning101-210724051457/85/Machine-learning-101-26-320.jpg)


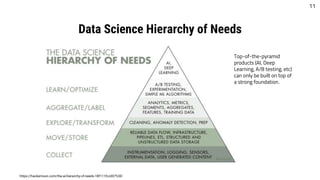
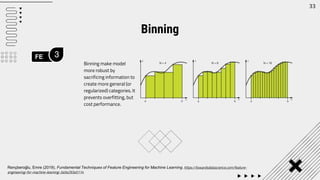
![FE 1
31
Drop
Numerical
Imputation
Categorical
Imputation
Drop rows or columns with
missing values. Easy to do, but
may cause significant data
loss.
Fill with another numerical
value, such as 0 or median
(depends on case)
Fill with another categorical
value, such as most frequent
value or new category (e.g.
’Others’)
Handling Missing Values
# Drop missing rows
df = df[df.isnull() == False]
# Drop missing columns
df = df[df.columns[df.isnull().mean() == 0]]
# Impute with 0
df = df.fillna(0)
# Impute with median
df = df.fillna(df.median())
# Impute with new categorical
df = df.fillna('Others')
# Impute with most frequent
df['column_name'].fillna(df['column_name'].value_counts().id
xmax(), inplace=True)](https://image.slidesharecdn.com/machinelearning101-210724051457/85/Machine-learning-101-31-320.jpg)
![FE 2
32
Outlier
Detection
Standard deviation vs
percentile
Outliers can be handled by:
- Drop outliers
- Cap outliers
Handling Outliers
#Dropping the outlier rows with standard deviation
factor = 3
upper_lim = df['column'].mean () + df['column'].std () * factor
lower_lim = df['column'].mean () - df['column'].std () * factor
df = df[(df['column'] < upper_lim) & (df['column'] > lower_lim)]
#Dropping the outlier rows with Percentiles
upper_lim = df['column'].quantile(.95)
lower_lim = df['column'].quantile(.05)
df = df[(df['column'] < upper_lim) & (df['column'] > lower_lim)]
#Capping the outlier rows with Percentiles
upper_lim = df['column'].quantile(.95)
lower_lim = df['column'].quantile(.05)
df.loc[(df[column] > upper_lim),column] = upper_lim
df.loc[(df[column] < lower_lim),column] = lower_lim](https://image.slidesharecdn.com/machinelearning101-210724051457/85/Machine-learning-101-32-320.jpg)

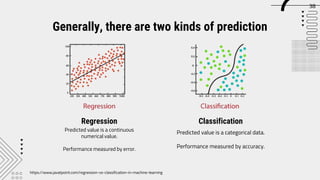
![FE 5
35
Rescales numerical data. Two most popular scaling methods are
min-max normalization and standardization. Min-max
normalization scales all values to a range between 0 and 1.
Standardization scales all values to a new distribution with 0
mean and 1 standard deviation.
Scaling
# Min-max normalization
df['normalized'] = (df['value'] -
df['value'].min()) / (df['value'].max() -
df['value'].min())
Min-max normalization
# Standardization
df['standardized'] = (df['value'] -
df['value'].mean()) / df['value'].std()
Standardization](https://image.slidesharecdn.com/machinelearning101-210724051457/85/Machine-learning-101-35-320.jpg)


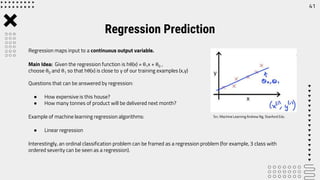
![43
from sklearn.linear_model import LogisticRegression
from sklearn.metrics import accuracy_score
logit = LogisticRegression(random_state = 17)
logit.fit(X_train, y_train)
print(accuracy_score(logit.predict(X_test), y_test))
importance = logit.coef_
# summarize feature importance
for x,v in zip(X_train.columns, importance[0]):
print('Feature: {}, Score: {:.5f}'.format(x,v))
# plot feature importance
plt.bar([x for x in range(len(importance[0]))],
importance[0])
plt.show()
Accuracy
Feature importance](https://image.slidesharecdn.com/machinelearning101-210724051457/85/Machine-learning-101-43-320.jpg)


![[1] Patil, Prasad (2018). What is Exploratory Data Analysis? https://towardsdatascience.com/exploratory-data-
analysis-8fc1cb20fd15
[2] Rençberoğlu, Emre (2019). Fundamental Techniques of Feature Engineering for Machine Learning.
https://towardsdatascience.com/feature-engineering-for-machine-learning-3a5e293a5114
References
46](https://image.slidesharecdn.com/machinelearning101-210724051457/85/Machine-learning-101-46-320.jpg)


![7.__Developing_a_Research_Proposal[1].pptx](https://cdn.slidesharecdn.com/ss_thumbnails/7-260131073037-df92dd7d-thumbnail.jpg?width=640&height=640&fit=bounds)