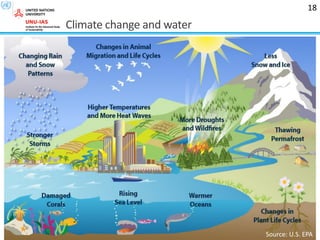
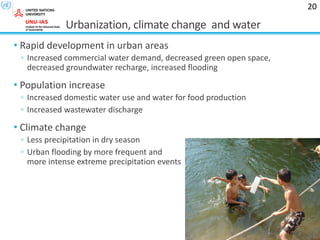
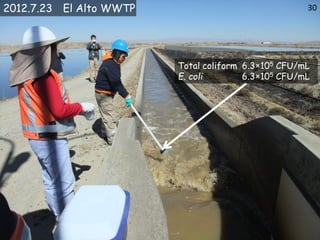
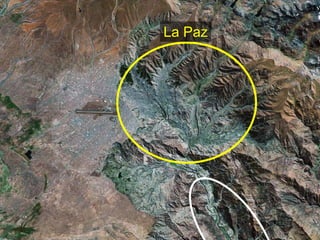
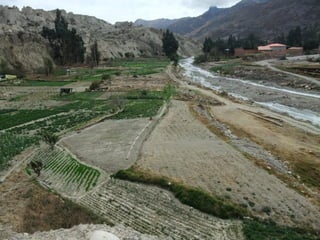
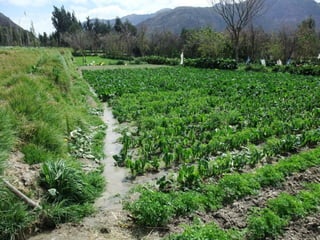
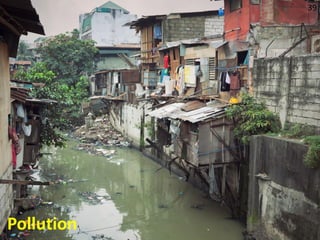
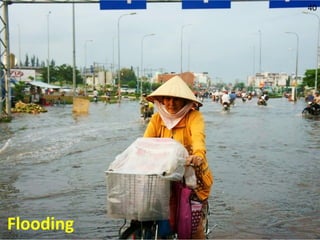
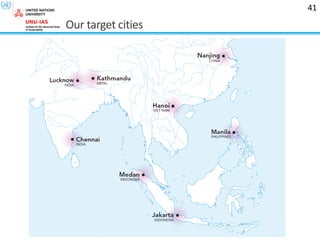
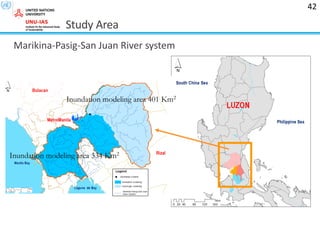
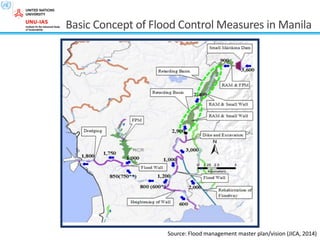
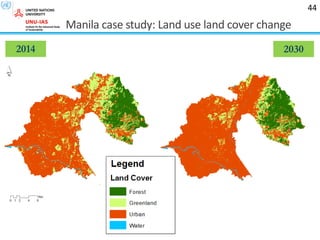
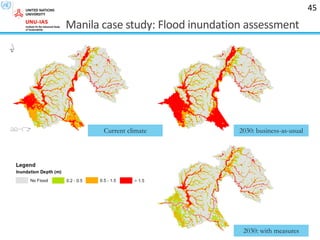
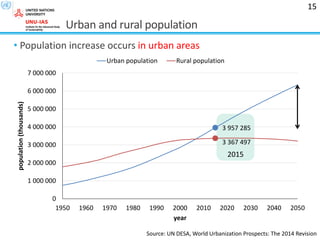
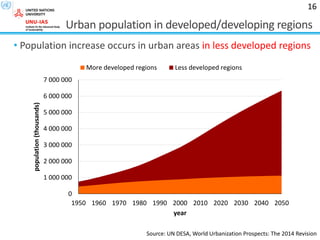
The document discusses urban water security, focusing on sustainable development goals (SDGs) and the impact of urbanization and climate change on water resources, particularly in regions like La Paz and Manila. It highlights challenges such as water scarcity, inadequate sanitation, and the impact of pollution and flooding on health and infrastructure. The presentation emphasizes the need for integrated water resource management and improved policies to address these pressing issues.

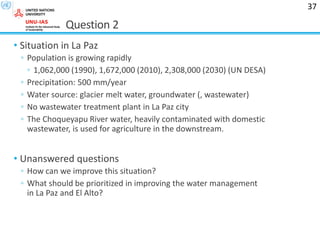
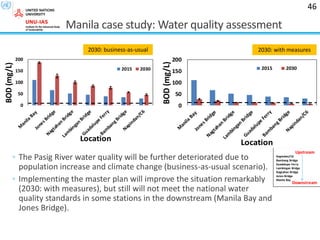
![Top 10 urban agglomerations in Asia (2010)
0
5 000
10 000
15 000
20 000
25 000
30 000
35 000
40 000
1950 1960 1970 1980 1990 2000 2010 2020 2030
Population[thousand]
Year
Dhaka Beijing
Shanghai Delhi
Kolkata (Calcutta) Mumbai (Bombay)
Kinki M.M.A. (Osaka) Tokyo
Karachi Istanbul
Source: UN DESA
17](https://image.slidesharecdn.com/lecture6urbanwatersecurityy-180323012221/85/Lecture-6-Urban-Water-Security-17-320.jpg)