Downloaded 101 times


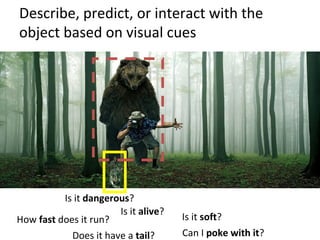
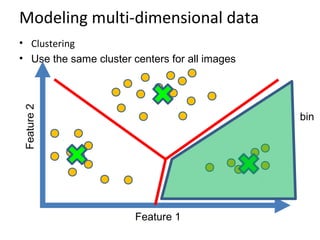
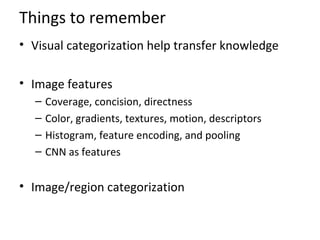
![Levels of categorization [Rosch 70s]
Definition of Basic Level:
• Similar shape: Basic level categories are the highest-level
category for which their members have similar shapes.
• Similar motor interactions: … for which people interact with its
members using similar motor sequences.
• Common attributes: … there are a significant number
of attributes in common between pairs of members.
Sub Basic Superordinate
similarity
Basic level
Subordinate
level
Superordinate
levels
“Fido”
dog
animal
quadruped
German
shepherd
Doberman
cat cow
…
…
……
… …
Rosch et a. Principle of categorization, 1978](https://image.slidesharecdn.com/98f7f5b1-28c5-4385-a77b-368f27f95cd8-150419012246-conversion-gate01/85/Lecture-21-Image-Categorization-Computer-Vision-Spring2015-10-320.jpg)
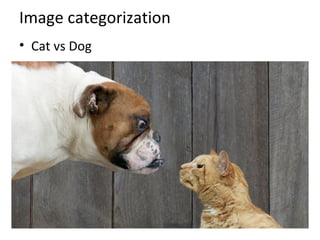
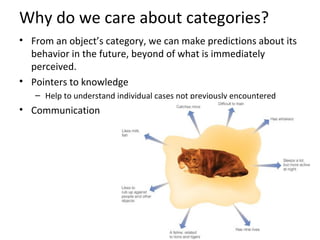
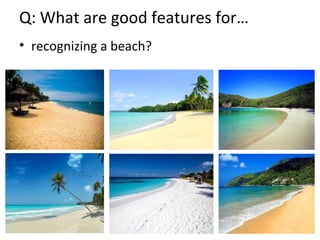
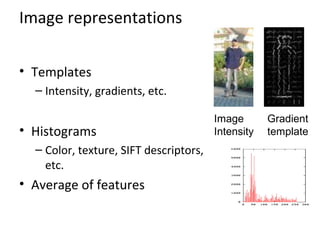
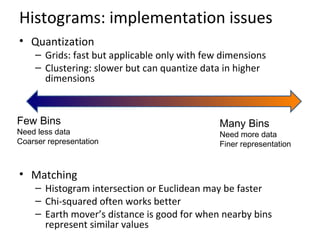
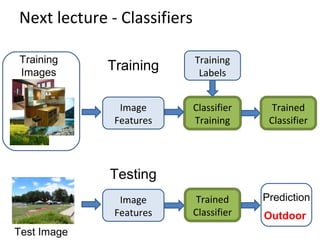
![Image categorization
• Place recognition
Places Database [Zhou et al. NIPS 2014]](https://image.slidesharecdn.com/98f7f5b1-28c5-4385-a77b-368f27f95cd8-150419012246-conversion-gate01/85/Lecture-21-Image-Categorization-Computer-Vision-Spring2015-14-320.jpg)
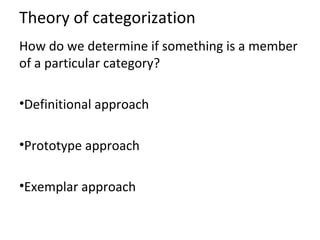
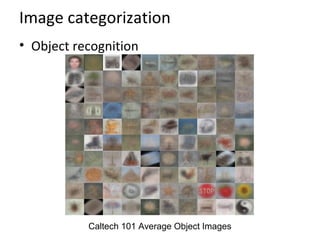
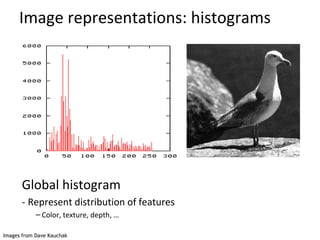
![Image categorization
• Visual font recognition
[Chen et al. CVPR 2014]](https://image.slidesharecdn.com/98f7f5b1-28c5-4385-a77b-368f27f95cd8-150419012246-conversion-gate01/85/Lecture-21-Image-Categorization-Computer-Vision-Spring2015-15-320.jpg)
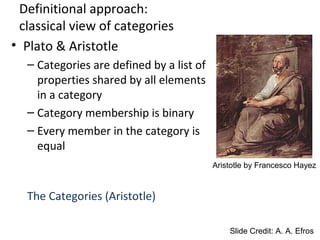
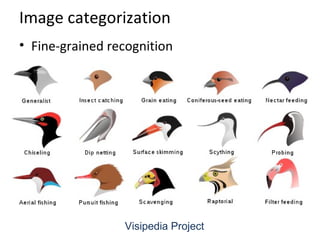
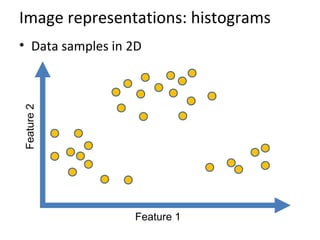
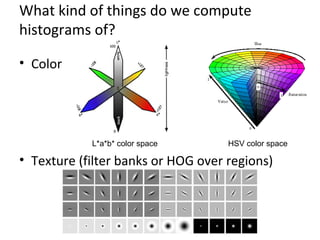
![Image categorization
• Dating historical photos
[Palermo et al. ECCV 2012]
1940 1953 1966 1977](https://image.slidesharecdn.com/98f7f5b1-28c5-4385-a77b-368f27f95cd8-150419012246-conversion-gate01/85/Lecture-21-Image-Categorization-Computer-Vision-Spring2015-16-320.jpg)
![Image categorization
• Image style recognition
[Karayev et al. BMVC 2014]](https://image.slidesharecdn.com/98f7f5b1-28c5-4385-a77b-368f27f95cd8-150419012246-conversion-gate01/85/Lecture-21-Image-Categorization-Computer-Vision-Spring2015-17-320.jpg)
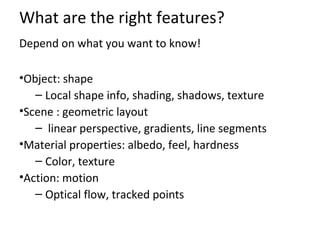
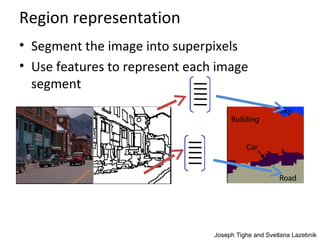
![Region categorization
• Layout prediction
Assign regions to orientation
Geometric context [Hoiem et al. IJCV 2007]
Assign regions to depth
Make3D [Saxena et al. PAMI 2008]](https://image.slidesharecdn.com/98f7f5b1-28c5-4385-a77b-368f27f95cd8-150419012246-conversion-gate01/85/Lecture-21-Image-Categorization-Computer-Vision-Spring2015-18-320.jpg)
![Region categorization
• Semantic segmentation from RGBD images
[Silberman et al. ECCV 2012]](https://image.slidesharecdn.com/98f7f5b1-28c5-4385-a77b-368f27f95cd8-150419012246-conversion-gate01/85/Lecture-21-Image-Categorization-Computer-Vision-Spring2015-19-320.jpg)
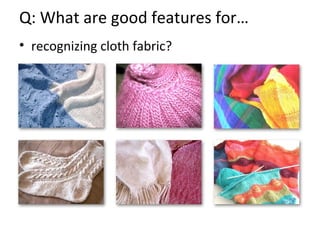
![Region categorization
• Material recognition
[Bell et al. CVPR 2015]](https://image.slidesharecdn.com/98f7f5b1-28c5-4385-a77b-368f27f95cd8-150419012246-conversion-gate01/85/Lecture-21-Image-Categorization-Computer-Vision-Spring2015-20-320.jpg)
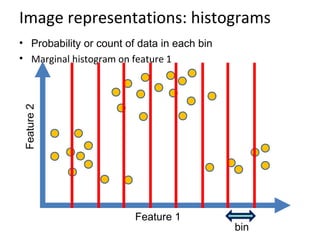
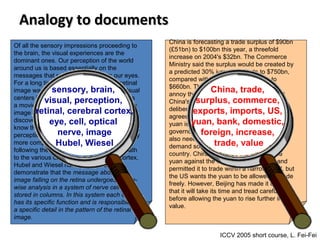
![Computing histogram distance
• Histogram intersection
• Chi-squared Histogram matching distance
• Earth mover’s distance
(Cross-bin similarity measure)
– minimal cost paid to transform one distribution into the
other
( )∑=
−=
K
m
jiji mhmhhh
1
)(),(min1),histint(
∑= +
−
=
K
m ji
ji
ji
mhmh
mhmh
hh
1
2
2
)()(
)]()([
2
1
),(χ
[Rubner et al. The Earth Mover's Distance as a Metric for Image Retrieval, IJCV 2000]](https://image.slidesharecdn.com/98f7f5b1-28c5-4385-a77b-368f27f95cd8-150419012246-conversion-gate01/85/Lecture-21-Image-Categorization-Computer-Vision-Spring2015-38-320.jpg)
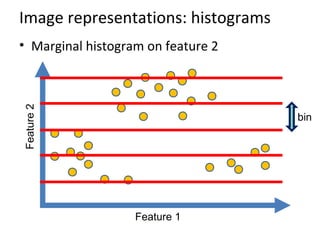
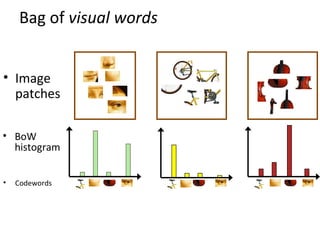
![What kind of things do we compute
histograms of?
• Histograms of descriptors
• “Bag of visual words”
SIFT – [Lowe IJCV 2004]](https://image.slidesharecdn.com/98f7f5b1-28c5-4385-a77b-368f27f95cd8-150419012246-conversion-gate01/85/Lecture-21-Image-Categorization-Computer-Vision-Spring2015-41-320.jpg)
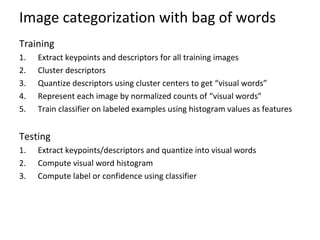

![Bag of visual words image classification
[Chatfieldet al. BMVC 2011]](https://image.slidesharecdn.com/98f7f5b1-28c5-4385-a77b-368f27f95cd8-150419012246-conversion-gate01/85/Lecture-21-Image-Categorization-Computer-Vision-Spring2015-47-320.jpg)
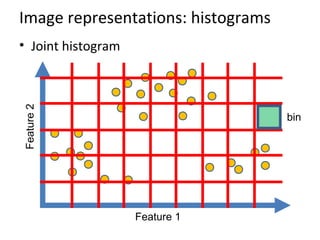
![Feature encoding
• Hard/soft assignment to clusters
Fisher encoding
Kernel codebook encoding
Locality constrained encoding
[Chatfieldet al. BMVC 2011]
Histogram encoding](https://image.slidesharecdn.com/98f7f5b1-28c5-4385-a77b-368f27f95cd8-150419012246-conversion-gate01/85/Lecture-21-Image-Categorization-Computer-Vision-Spring2015-48-320.jpg)
![Fisher vector encoding
• Fit Gaussian Mixture Models
• Posterior probability
• First and second order differences to cluster k
[Perronnin et al. ECCV 2010]](https://image.slidesharecdn.com/98f7f5b1-28c5-4385-a77b-368f27f95cd8-150419012246-conversion-gate01/85/Lecture-21-Image-Categorization-Computer-Vision-Spring2015-49-320.jpg)
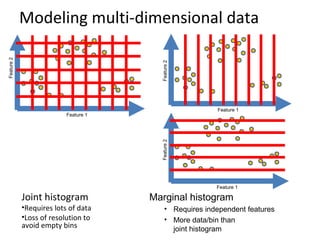
![Performance comparisons
• Fisher vector encoding outperforms others
• Higher-order statistics helps
[Chatfieldet al. BMVC 2011]](https://image.slidesharecdn.com/98f7f5b1-28c5-4385-a77b-368f27f95cd8-150419012246-conversion-gate01/85/Lecture-21-Image-Categorization-Computer-Vision-Spring2015-50-320.jpg)
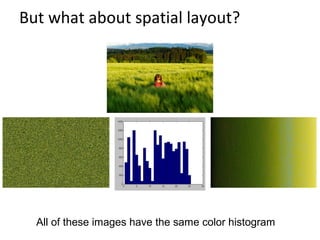
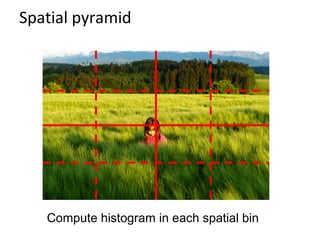
![Spatial pyramid
High number of features – PCA to reduce dimensionality
[Lazebnik et al. CVPR 2006]](https://image.slidesharecdn.com/98f7f5b1-28c5-4385-a77b-368f27f95cd8-150419012246-conversion-gate01/85/Lecture-21-Image-Categorization-Computer-Vision-Spring2015-53-320.jpg)
![Pooling
• Average/max pooling
• Second-order pooling
[Joao et al. PAMI 2014]
Source: Unsupervised Feature
Learning and Deep Learning
=avg/max
=avg/max](https://image.slidesharecdn.com/98f7f5b1-28c5-4385-a77b-368f27f95cd8-150419012246-conversion-gate01/85/Lecture-21-Image-Categorization-Computer-Vision-Spring2015-54-320.jpg)
![Convolutional activation features
[Donahue et al. ICML 2013]
CNN Features off-the-shelf:
an Astounding Baseline for Recognition
[Razavian et al. 2014]](https://image.slidesharecdn.com/98f7f5b1-28c5-4385-a77b-368f27f95cd8-150419012246-conversion-gate01/85/Lecture-21-Image-Categorization-Computer-Vision-Spring2015-60-320.jpg)
![Working with regions
• Spatial support is important –
multiple segmentation
• Spatial consistency – MRF smoothing
Geometric context [Hoiem et al. ICCV 2005]](https://image.slidesharecdn.com/98f7f5b1-28c5-4385-a77b-368f27f95cd8-150419012246-conversion-gate01/85/Lecture-21-Image-Categorization-Computer-Vision-Spring2015-63-320.jpg)
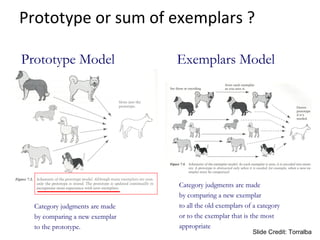
![Beyond categorization
• Exemplar models [Malisiewicz and Efros NIPS09, ICCV11]
– Ask not “what is this?”, ask “what is this like” –
Moshe Bar
• A train?](https://image.slidesharecdn.com/98f7f5b1-28c5-4385-a77b-368f27f95cd8-150419012246-conversion-gate01/85/Lecture-21-Image-Categorization-Computer-Vision-Spring2015-64-320.jpg)

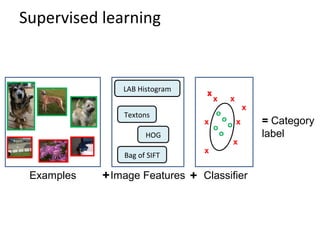
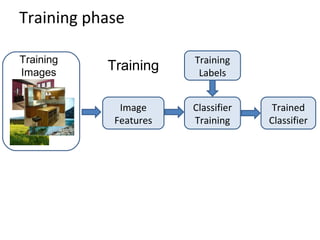
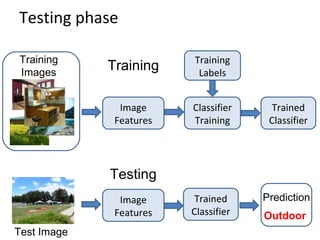
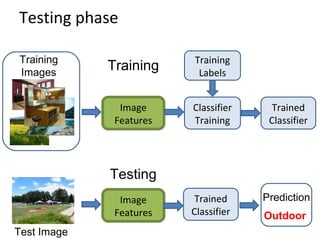
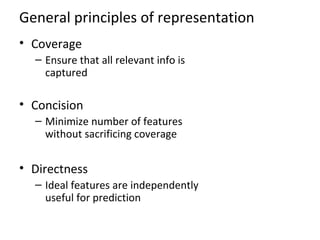
This document provides an overview of image features and categorization in computer vision. It discusses why categorization is important for making predictions about objects and communicating categories. It describes approaches to categorization like definitional, prototype, and exemplar models. Common image features for categorization like color, texture, gradients, and interest points are presented. Methods for representing images as histograms of these features and encoding local descriptors as "bags of visual words" are covered. Deep convolutional neural networks and region-based representations are also summarized. The document aims to explain current techniques for image and region categorization using supervised learning of classifiers on labeled examples and extracted image features.