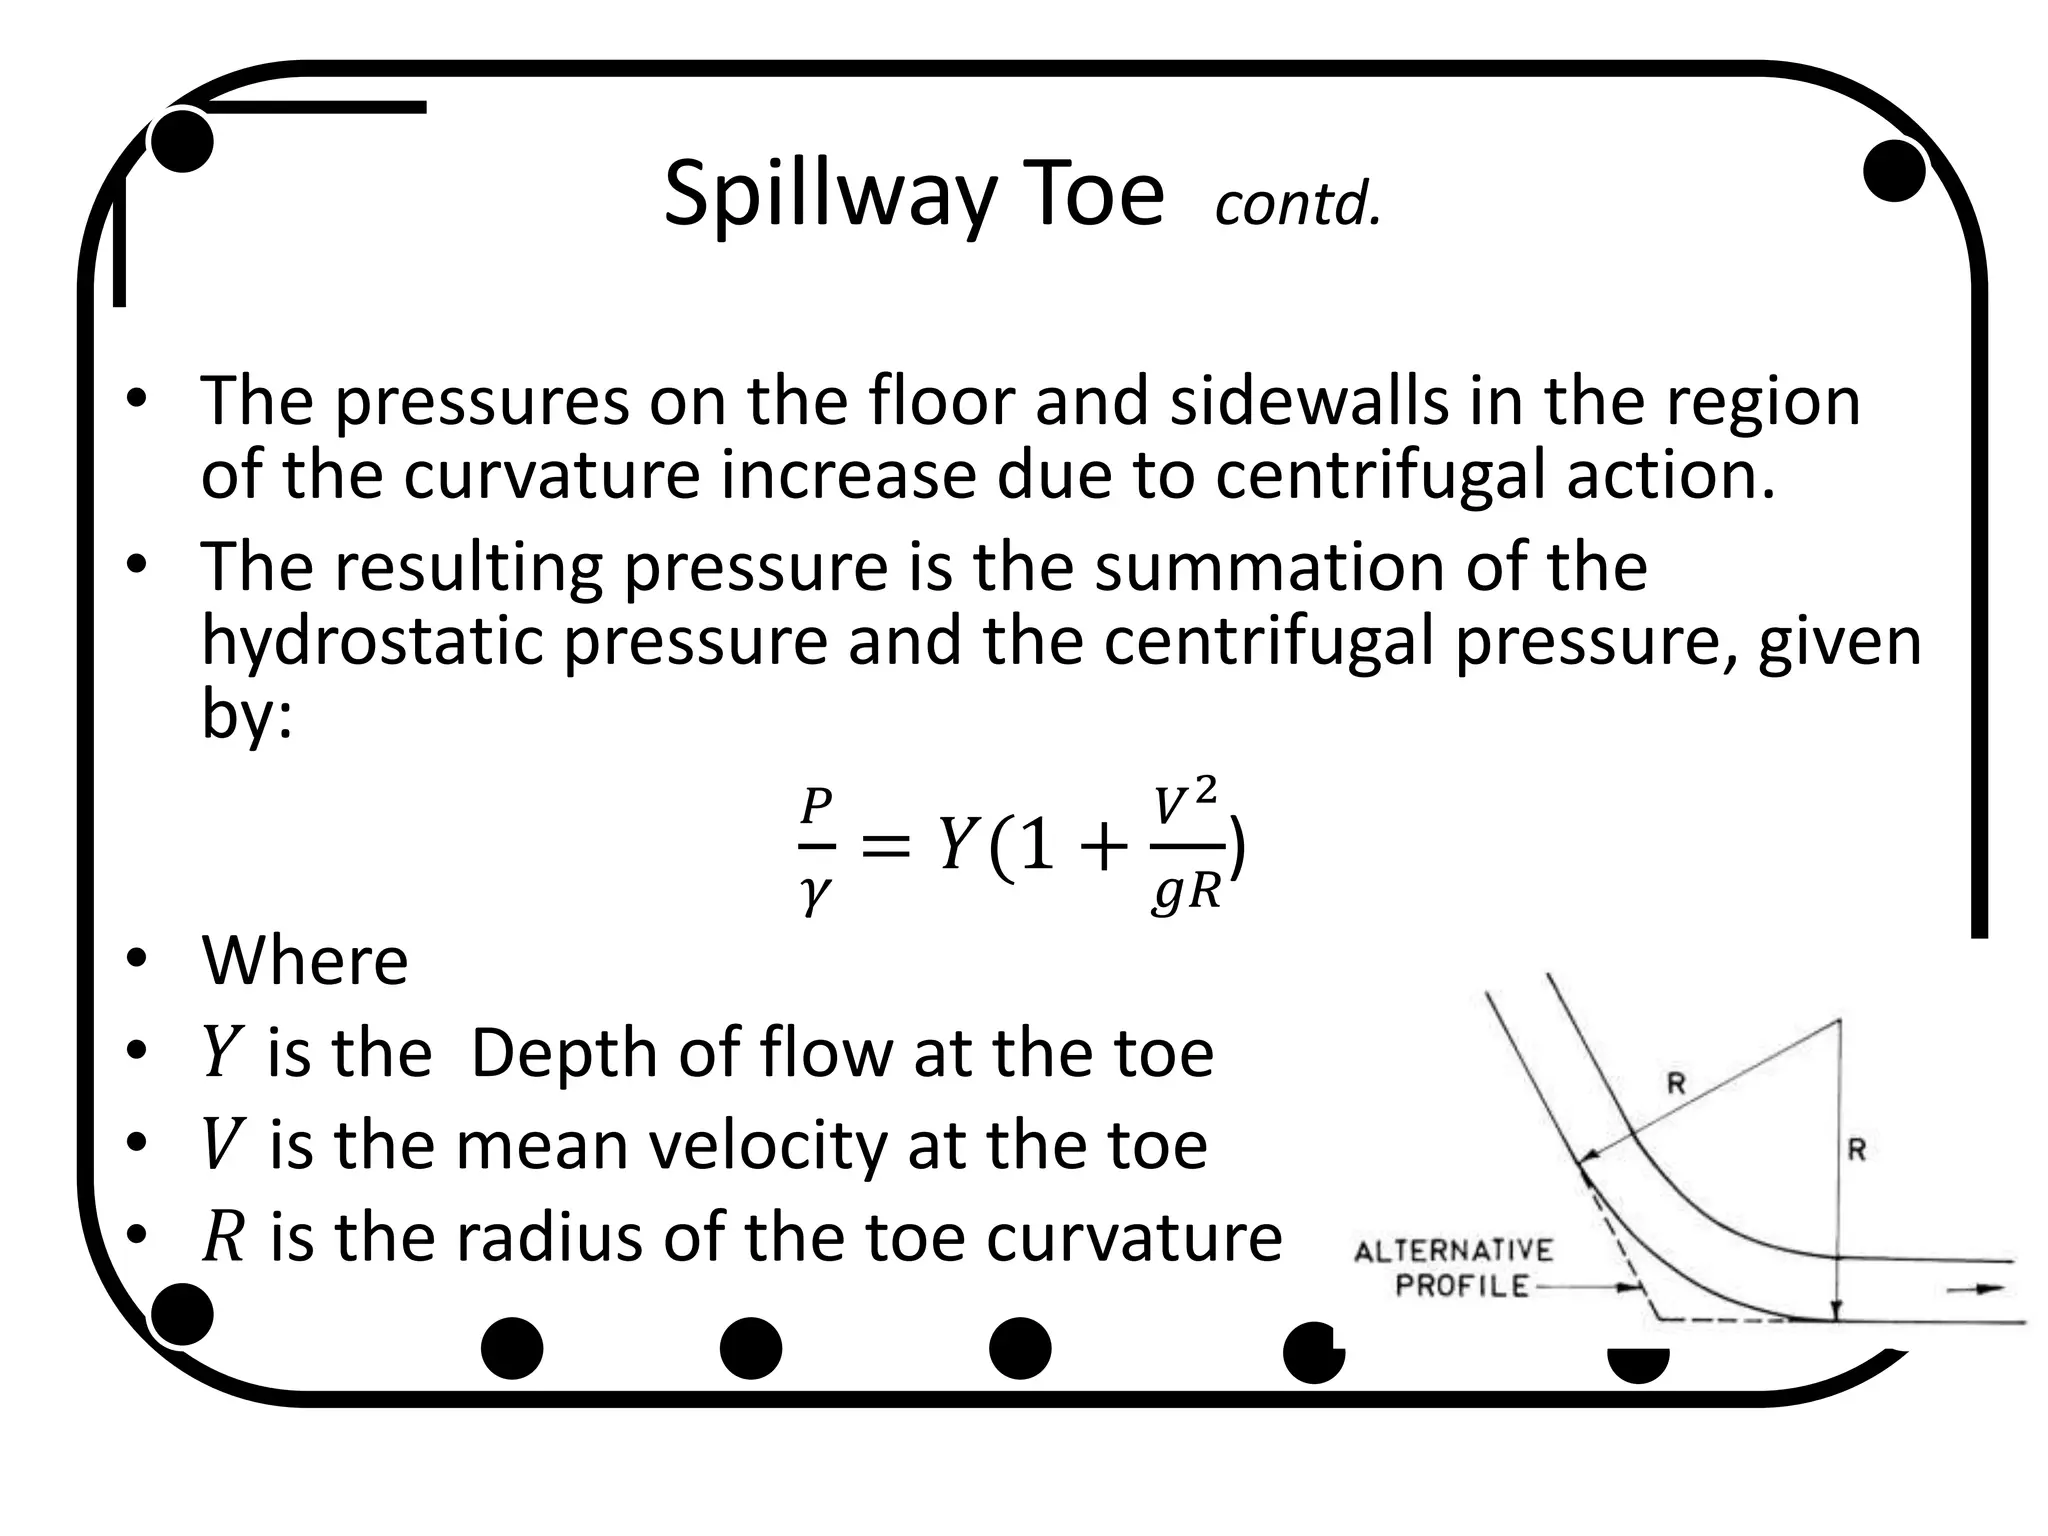
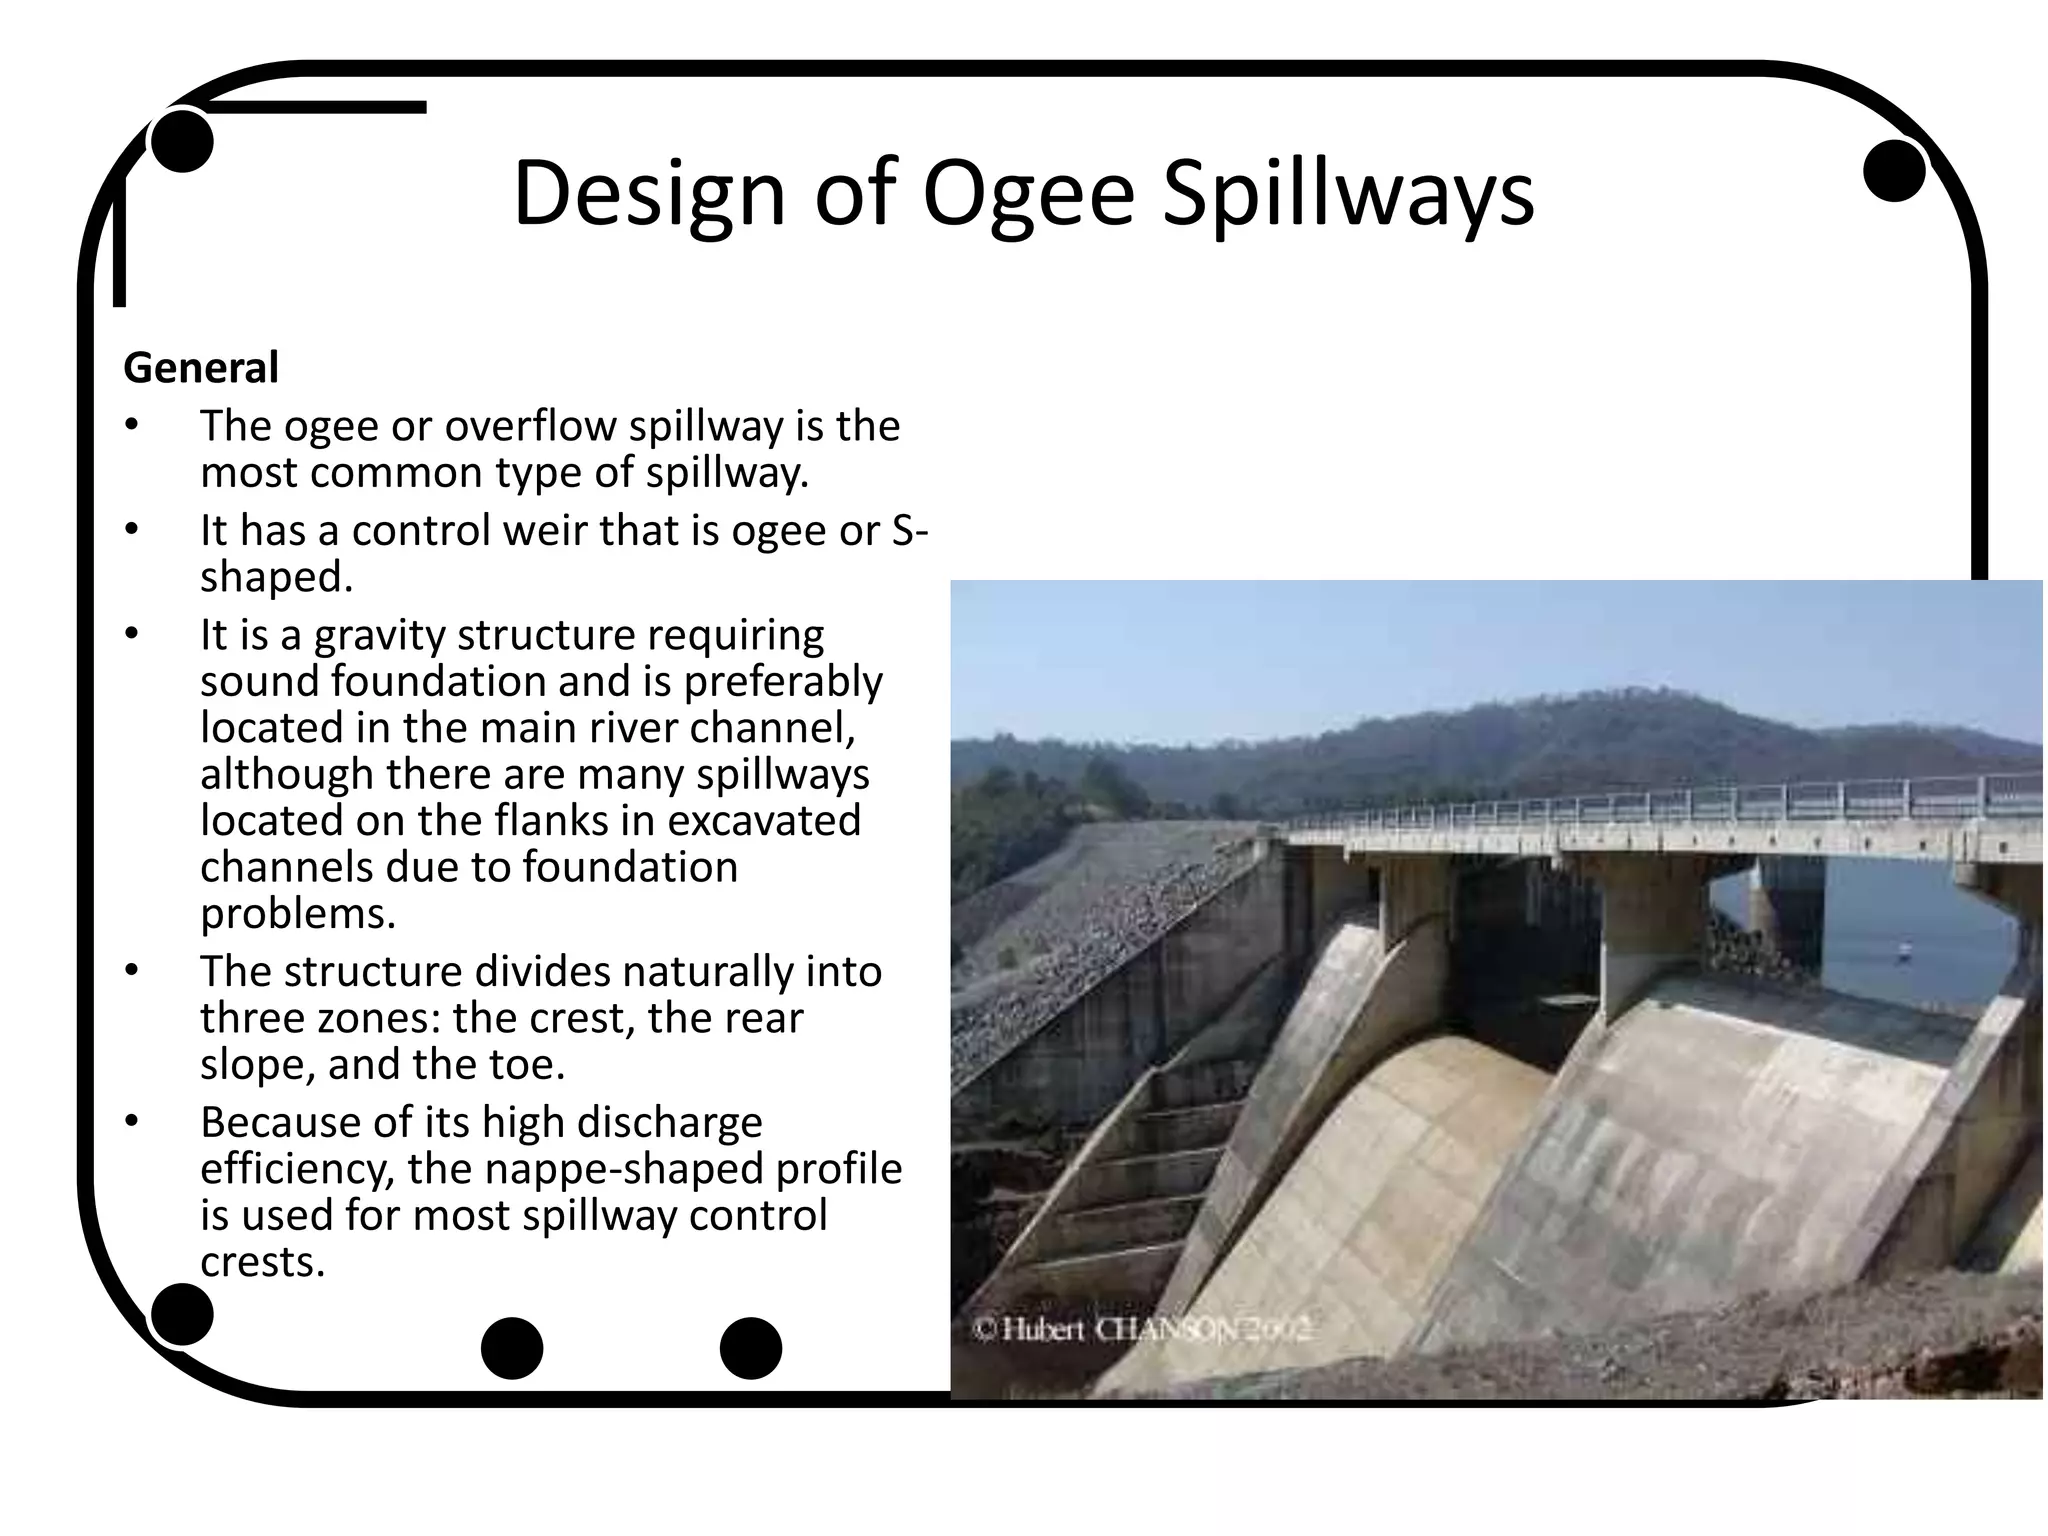
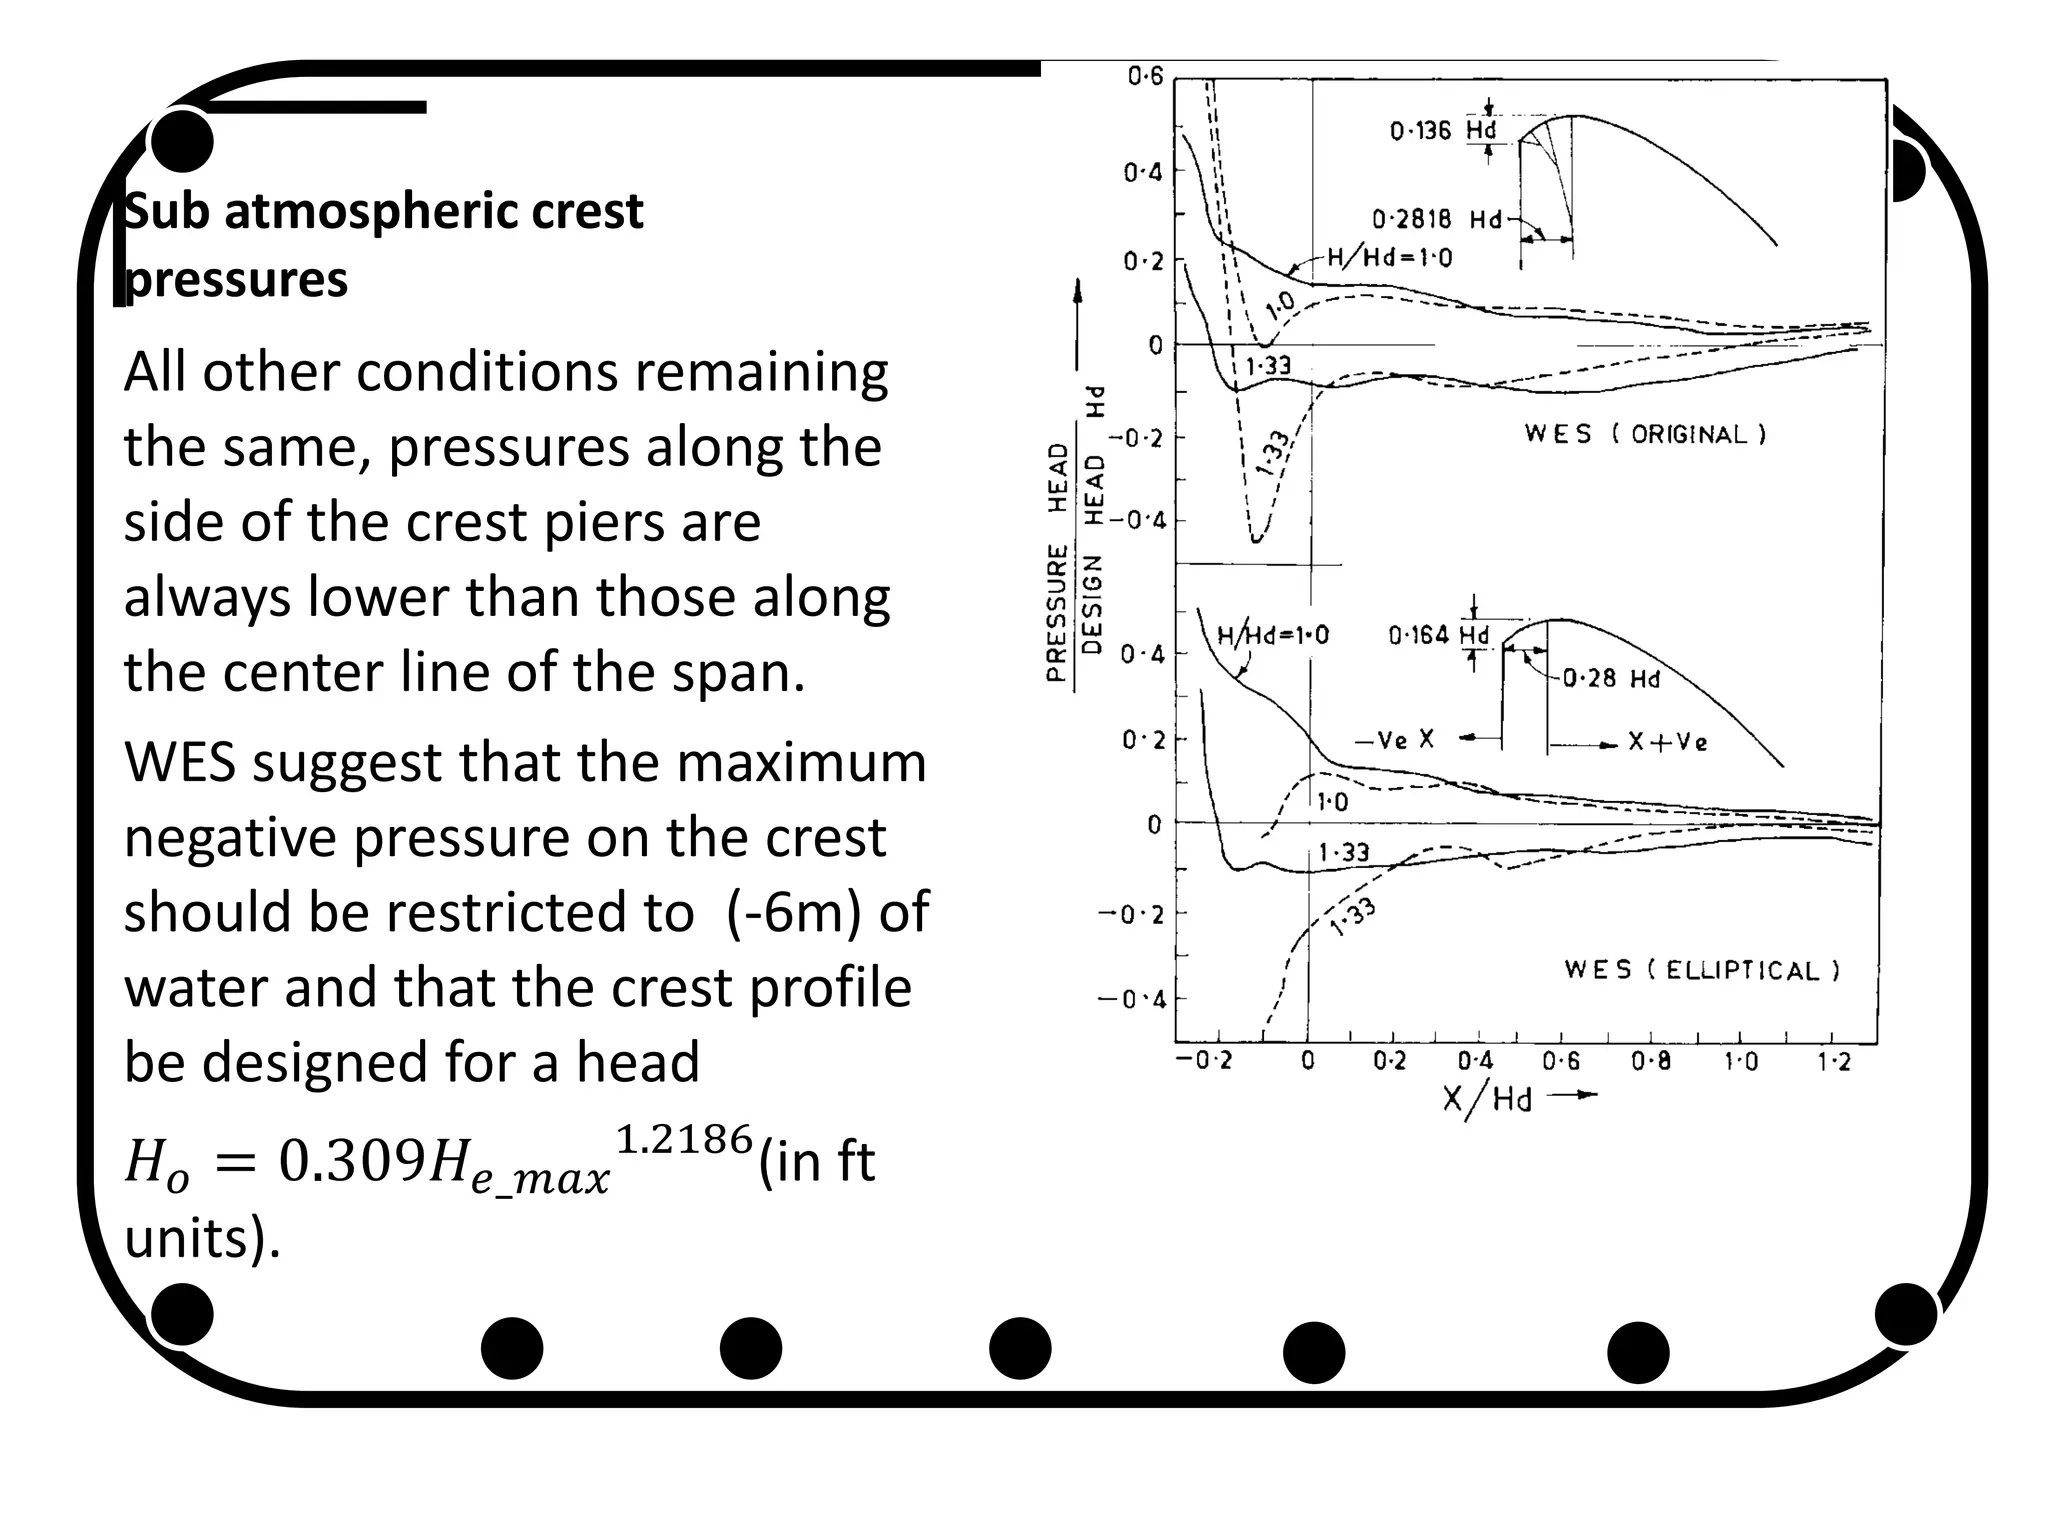
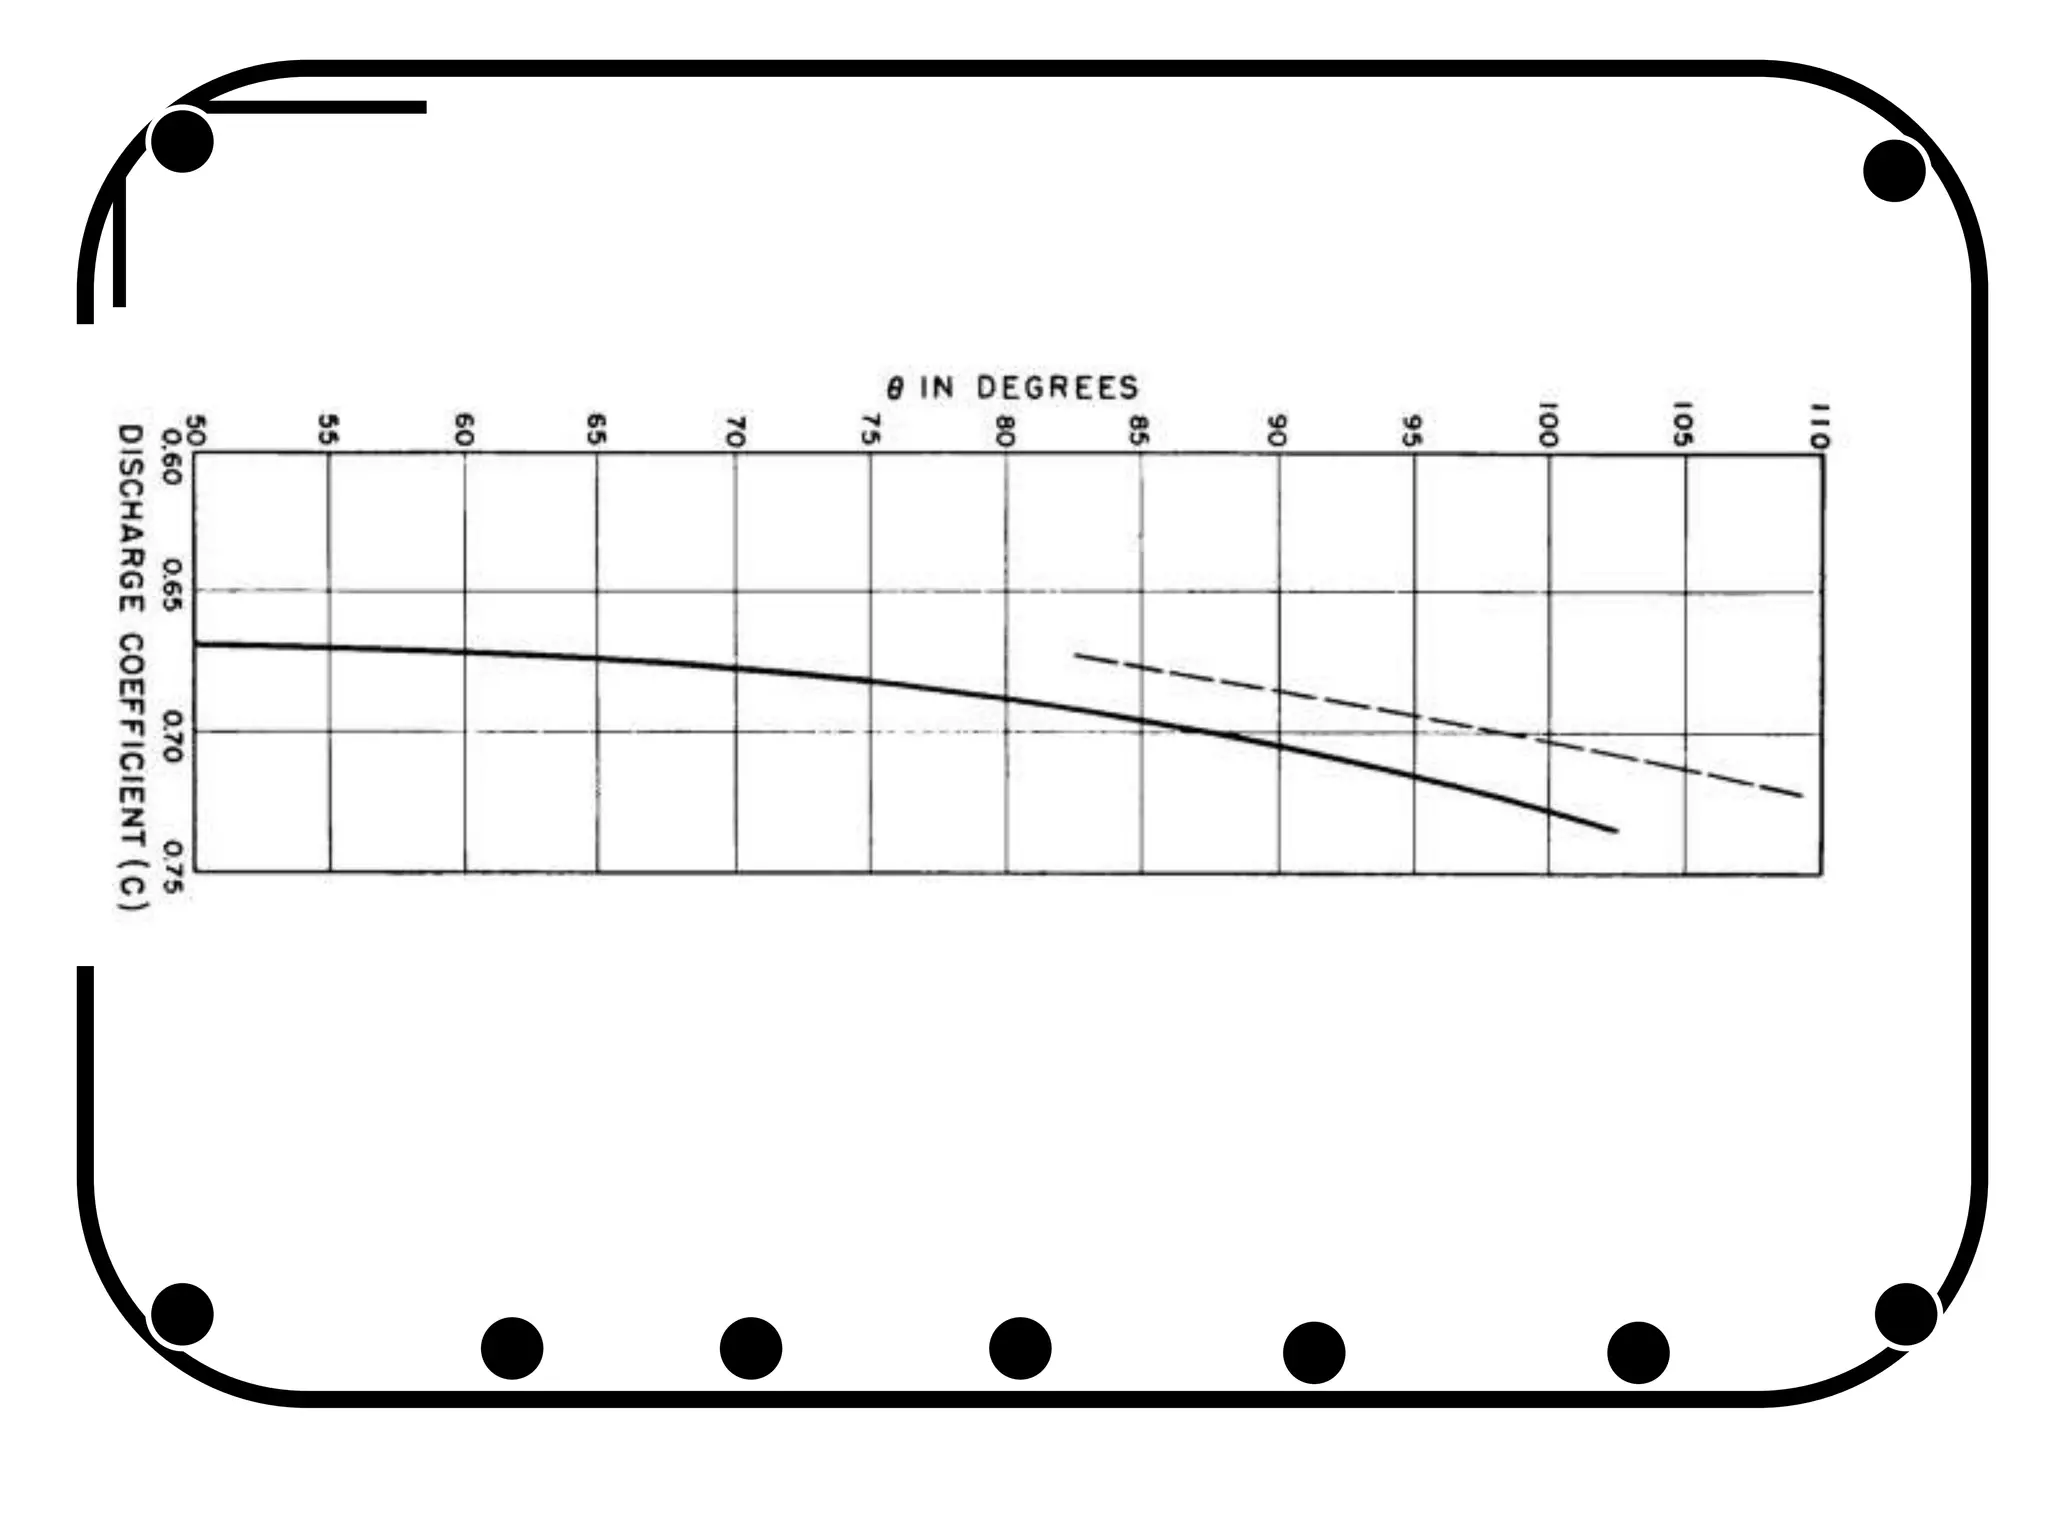
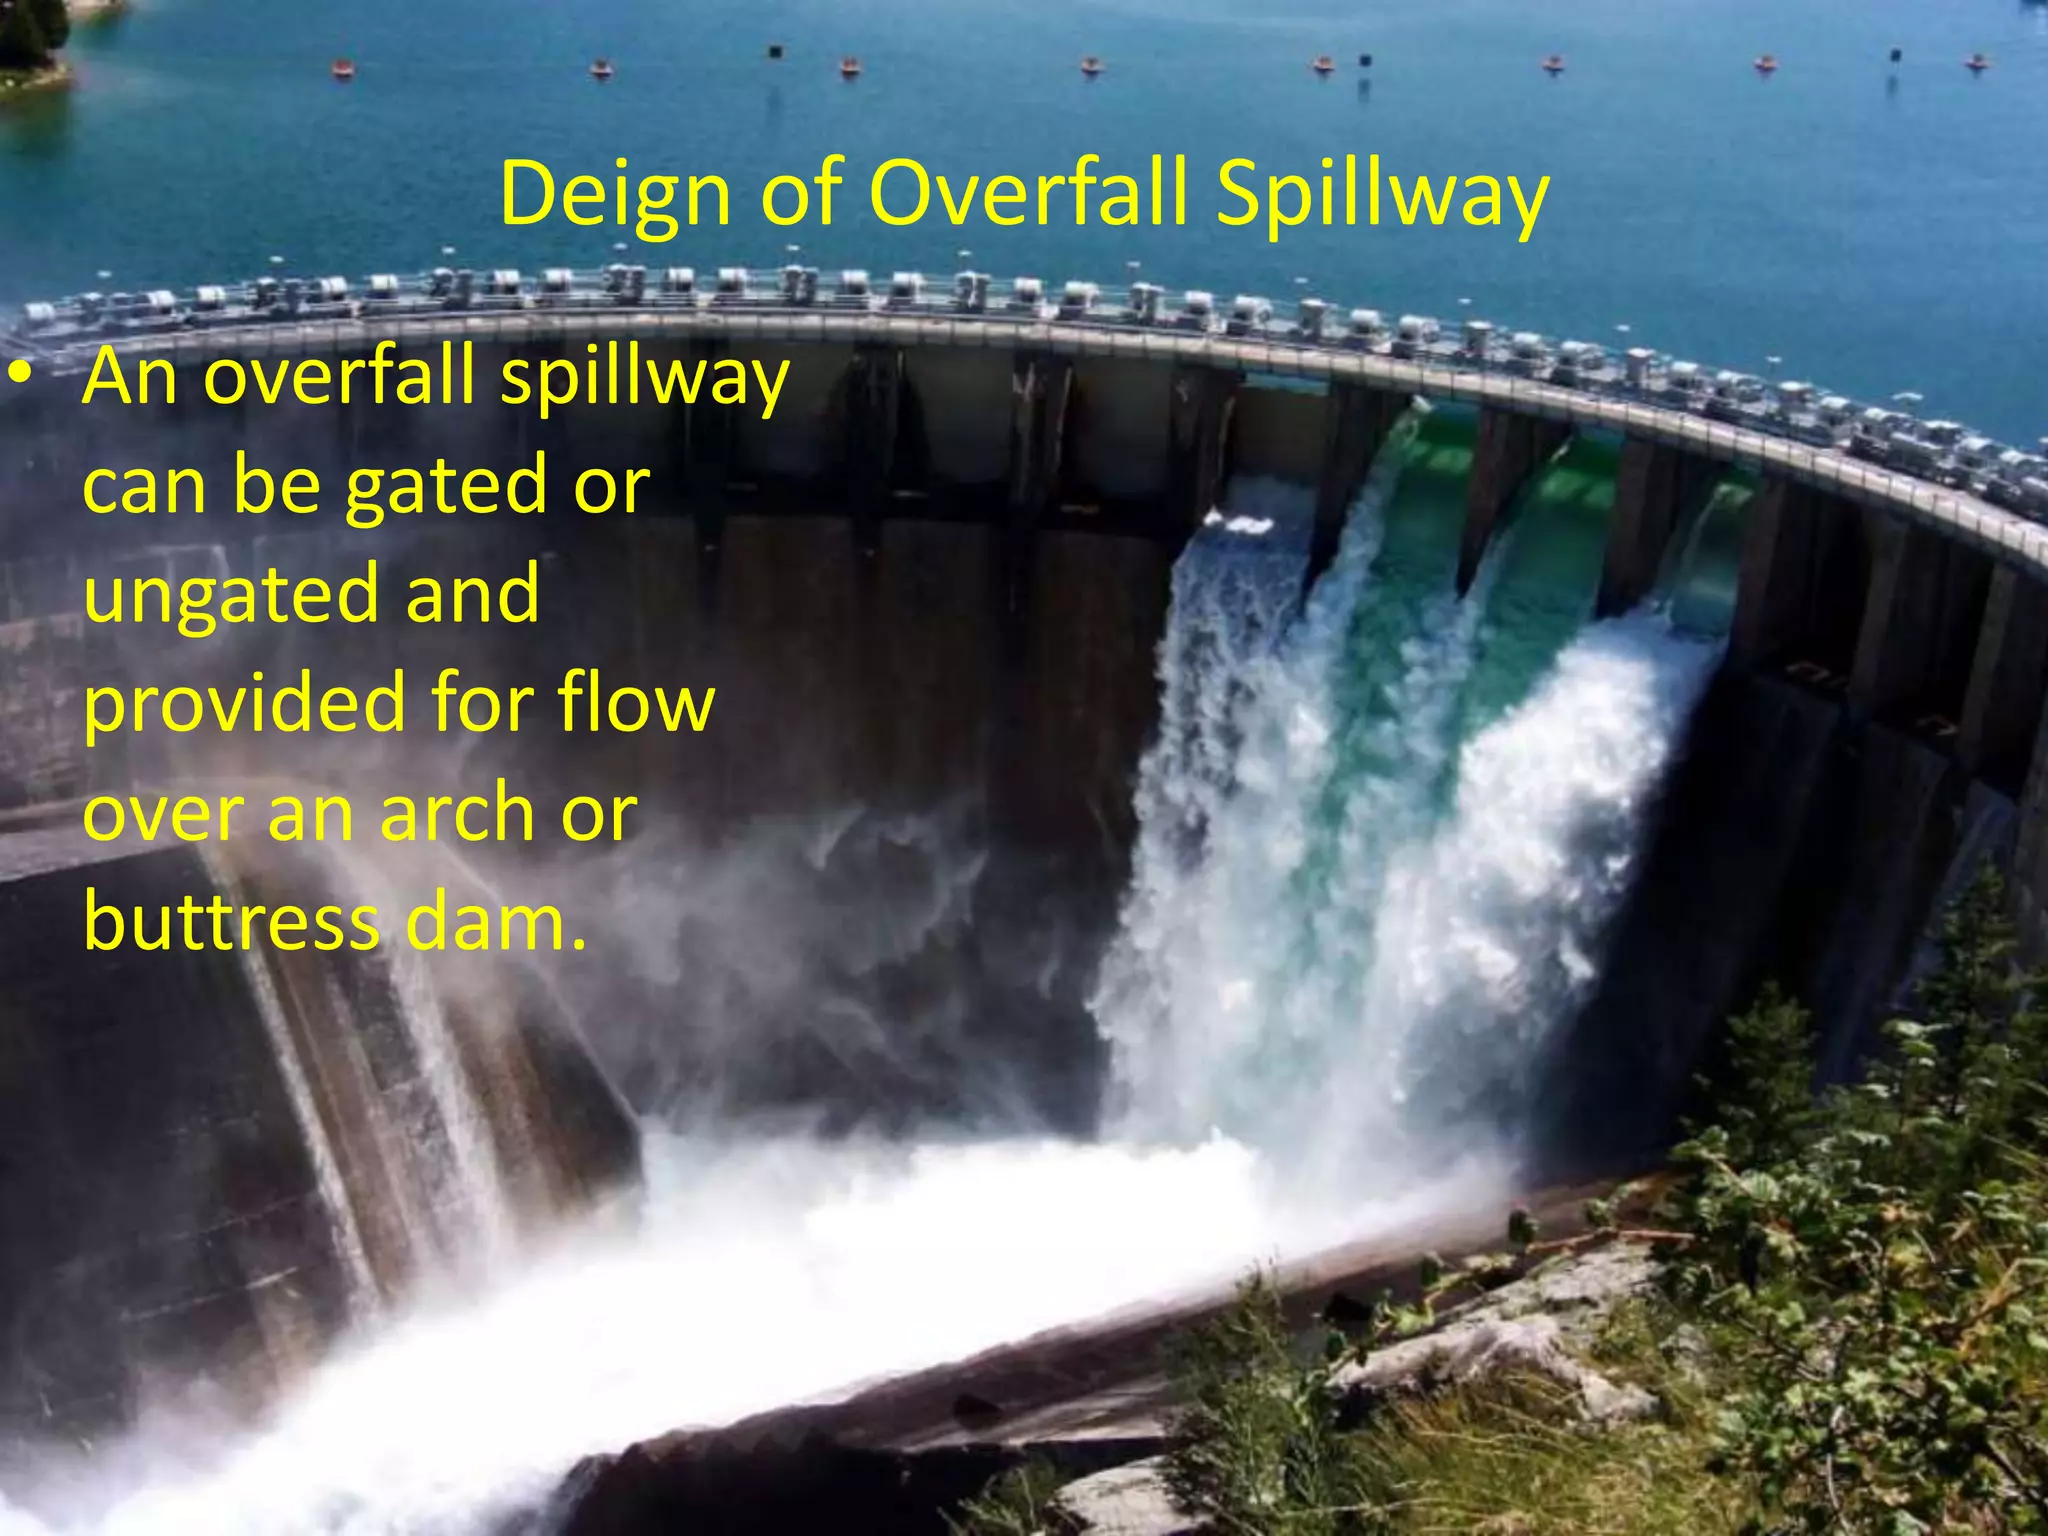
SlideShare a Scribd company logo
Addis Ababa Science and
Technology
College of Architecture and Civil
Engineering
HYDRALUCIS STRUCURES I
CENG 6605
Mesay Daniel (PhD)
Fitsum Tesfaye (PhD)
HYDRALUCIS STRUCURES I
CENG 6605
Chapter 1: Hydraulic design of
overflow structures
Spillway
• The principal function of a spillway is to pass down the
surplus water from the reservoir into the downstream river.
• After a spillway control device and its dimensions have
been selected, the maximum spillway discharge and the
maximum reservoir water level should be determined by
flood routing.
• Cost estimates of the spillway and the dam should be
made.
• Comparisons of various combinations of spillway capacity
and dam height for an assumed spillway type, and of
alternative types of spillways allow selection of an
economical spillway type.
Comparative costs of spillway-dam
combinations
Selection of Spillway Size and Type
General Considerations
• All pertinent factors of hydrology, hydraulics, design, cost, and
damage should be considered.
• In this connection and when applicable, consideration should be
given to such factors as:
– the characteristics of the flood hydrograph
– the damages that would result if such a flood occurred without the
dam
– the damages that would result if such a flood occurred with the dam
in place
– the damages that would occur if the dam or spillway were breached,
– the effects of various dam and spillway combinations on the probable
damages upstream and downstream of the dam
– the relative costs of increasing the capacity of spillway
– the use of combined outlet facilities to serve more than one function
Spillway capacity-surcharge
relationship.
Design of Ogee Spillways
General
• The ogee or overflow spillway is the
most common type of spillway.
• It has a control weir that is ogee or S-
shaped.
• It is a gravity structure requiring
sound foundation and is preferably
located in the main river channel,
although there are many spillways
located on the flanks in excavated
channels due to foundation
problems.
• The structure divides naturally into
three zones: the crest, the rear
slope, and the toe.
• Because of its high discharge
efficiency, the nappe-shaped profile
is used for most spillway control
crests.
Design of Ogee Spillways contd.
General
• The application of the theory of flow through spillways is
based largely upon empirical coefficients, so the designer
should deal with maximum and minimum values as well as
averages, depending upon the design objective.
• To be conservative, the designer should generally use
maximum loss factors in computing discharge capacity, and
minimum loss factors in computing velocities for the design
of energy dissipators.
• As more model and prototype data become available, the
range between maximum and minimum coefficients used
in design should be narrowed.
Design of Ogee Spillways contd.
Basic Considerations
• A spillway is sized to provide the required
capacity, usually the entire spillway design
flood, at a specific reservoir elevation.
• This elevation is normally at the maximum
operating level or at a surcharge elevation
greater than the maximum operating level.
Design of Ogee Spillways contd.
Hydraulic analysis of a spillway usually involves
four conditions of flow:
1. Subcritical flow in the spillway approach, initially
at a low velocity, accelerating, however, as it
approaches the crest.
2. Critical flow as the water passes over the
spillway crest.
3. Supercritical flow in the chute below the crest.
4. Transitional flow at or near the terminus of the
chute where the flow must transition back to
subcritical.
Design of Ogee Spillways contd.
Basic Considerations contd.
• When a relatively large storage capacity can be obtained above the
normal maximum reservoir elevation by increasing the dam height,
a portion of the flood volume can be stored in this reservoir
surcharge space and the size of the spillway can be reduced.
• The use of a surcharge pool for passing the spillway design flood
involves an economic analysis that considers the added cost of a
dam height compared to the cost of a wider and/or deeper spillway.
• When a gated spillway is considered, the added cost of higher
and/or additional gates and piers must be compared to the cost of
additional dam height.
Shape for Uncontrolled Ogee Crest
• Crest shapes have been studied extensively in
the Bureau of US Reclamation Hydraulics
Laboratories.
• For most conditions the data can be
summarized according to the form shown on
in next slide, where the profile is defined as it
relates to axis at the apex of the crest.
Figure : Elements of nappe-shaped crest profiles
Shape for Uncontrolled Ogee Crest contd.
• That upstream portion from the origin is defined as
either a single curve and a tangent or as a compound
circular curve.
• The downstream portion is defined by the equation:
𝑦
𝐻 𝑜
= −𝐾
𝑥
𝐻 𝑜
𝑛
in which 𝐾 and 𝑛 are constants whose values depend
on the upstream inclination and on the velocity of
approach.
The following figure gives values of these constants for
different conditions.
Shape for Uncontrolled Ogee Crest
contd.
• The approximate profile shape for a crest with a
vertical upstream face and negligible velocity of
approach is shown in the following figure.
• The profile is constructed in the form of a
compound circular curve with radii expressed in
terms of the design head, 𝐻 𝑜.
• This definition avoids the need for solving an
exponential equation; furthermore, it is
represented in a form easily used by a layman for
constructing forms or templates.
Shape for Uncontrolled Ogee Crest
contd.
• For ordinary design conditions for small
spillways where 𝑃 ≥ 0.5𝐻 𝑜, this profile is
sufficiently accurate to avoid seriously
reduced crest pressures and does not
materially alter the hydraulic efficiency of the
crest.
• When the 𝑃 < 0.5𝐻 𝑜 on the crest, the profile
should be determined from the given
exponential formula.
Shape for Uncontrolled Ogee Crest
contd
• US Army Corps of Engineers, WES (1952) has
developed several standard shapes, designated as WES
standard spillway shapes, represented on the
downstream of the crest axis by the equation:
𝑋 𝑛
= 𝐾𝐻 𝑜
𝑛−1
𝑌
Where
𝑋 and 𝑌 are coordinates of crest profile with origin at the
highest point of the crest.
𝐻 𝑜is the design head including velocity head of the approach
flow.
𝐾 and 𝑛 are parameters depending on the slope of the
upstream face.
TypicalWESstandardshapes
Shape for Uncontrolled Ogee Crest
contd
• In the revised procedure developed by WES using the data of USBR,
the upstream quadrant was shaped as an ellipse with the equation:
𝑋2
𝐴2
+
𝑌2
𝐵2
= 1
Where
𝐴 = Semi-major axis (functions of the ratio of approach depth to
design head)
𝐵 =Semi-minor axis (-do-)
• And the downstream profile conformed to the equation
𝑋1.85
= 𝐾𝐻 𝑜
0.85
𝑌
where 𝐾 is a parameter depending on the ratio approach depth and
design head.
Shape far Uncontrolled Ogee Crest contd
• The design curves suggested by WES are
reproduced as shown the following slide.
• For 𝑃 𝐻 𝑜 = 2, 𝐴 and 𝐵 become constant with
values of 0.28𝐻 𝑜 and 0.164 0.16𝐻 𝑜
respectively.
Spillway Discharge
• The ogee crest spillway is basically a sharp-crested weir with the
space below the lower nappe filled with concrete.
• The shape of such a profile depends upon the head, the inclination
of the upstream face of the overflow section, and the height of the
overflow section above the floor of the entrance channel (which
influences the velocity of approach to the crest).
• The discharge over a spill-way crest is limited by the same
parameters as the weir, and determined by the following:
𝑄 = 𝐶𝐿 𝑒 𝐻𝑒
3/2
𝑄= discharge
C= Coefficient of discharge
𝐿 𝑒=effective length
𝐻𝑒=Specific energy above the crest center
Spillway Discharge contd.
• The discharge coefficient is influenced by a
number of factors:
o Height of spillway above stream bed or depth of
approach,
o relation of the actual crest shape to the ideal nappe
shape,
o upstream face slope,
o downstream apron interference,
o down stream submergence, and
o Ratio of actual total head to the design head,
Spillway Discharge contd.
• The height of spillway, 𝑃 above stream bed or
approach channel affects the velocity of approach
which in turn affects the coefficient of discharge,
𝐶.
• With increase in 𝑃 the velocity of approach
decreases and the 𝐶 increases.
• Model tests indicate that the 𝐶 becomes fairly
constant when P > 3.0𝐻 𝑜, where 𝐻 𝑜 is the
design head including the head due to velocity of
approach.
Pier and Abutment Effects
• Where crest piers and abutments are shaped to cause
side contractions of the overflow, the effective length,
𝐿 𝑒, is less than the net length of the crest, 𝐿.
• The effect of the end contraction may be taken into
account by reducing the net crest length as follows:
𝐿 𝑒 = 𝐿 − 2(𝑁𝐾𝑝 + 𝐾𝑎)𝐻𝑒
Where: 𝑁 is number of pier
𝐾𝑝is pier contraction coefficient
𝐾𝑎is abutment contraction coefficient
𝐻𝑒 is actual head on the crust
Pier and Abutment Effects contd.
• 𝐾 𝑝 is affected by:
o the shape and location of the pier nose,
o the thickness of the pier,
o the design head, and
o the approach velocity.
• For conditions of design head, 𝐻 𝑜 ,
o For square-nosed piers with corners rounded on a
radius equal to about 0.1 of the pier thickness, 𝐾𝑝 =
0.02
o For round-nosed piers, 𝐾𝑝 = 0.01
o For pointed-nose piers,𝐾 𝑝 = 0.00
Pier and Abutment Effects contd.
• 𝐾𝑎 is affected by:
o the shape of the abutment,
o the angle between the upstream approach wall and the axis of the
flow,
o the head in relation to the design head, and
o the approach velocity.
• For conditions of design head, 𝐻 𝑜 ,
o For square abutments with headwall at 90o to direction of flow: , 𝐾 𝑎 =
0.2
o For rounded abutments with headwall at 90oto direction of flow, when
0.15𝐻 𝑜 ≤ 𝑟 ≤ 0.5𝐻 𝑜, 𝐾a = 0.1
o 𝐾 𝑝 = 0.00
o For rounded abutments with radius larger than 0.5𝐻 𝑜and head wall is
placed not more than 45o to direction of flow, 𝐾 𝑎 = 0.00
Effect of Approach Velocity
• Another factor influencing the discharge
coefficient of a spillway crest is the depth in the
approach channel relative to the design head
defined as the ratio 𝑃 𝐻 𝑜,
• As 𝑃 decreases relative to the design head, the
effect of approach velocity becomes more
significant.
• These coefficients are valid only when the ogee
is formed to the ideal nappe shape; that is, when
𝐻𝑒 𝐻 𝑜 = 1
Effect of Heads Different from Design
Head
• A wider ogee shape will result in positive
pressures along the crest contact surface,
thereby reducing the discharge.
• With a narrower crest shape, negative
pressures along the contact surface will occur,
resulting in an increased discharge.
Effect of Upstream Face Slope
Increase in slope
increases coefficient Increase in slope
variable change in
coefficient
Effect of D/S Apron Interference and
D/S Submergence
• When the water level below an overflow weir
is high enough to affect the discharge, the
weir is said to be submerged.
• The vertical distance from the crest of the
overflow to the downstream apron and the
depth of flow in the downstream channel, as
it relates to the head pool level, are factors
that alter the discharge coefficient.
Effect of D/S Apron Interference and
D/S Submergence contd.
• Five distinct characteristic flows can occur below an overflow crest,
depending on the relative positions of the apron and the
downstream water surface:
1. flow can continue at supercritical stage;
2. a partial or incomplete hydraulic jump can occur immediately
downstream from the crest;
3. a true hydraulic jump can occur;
4. a drowned jump can occur in which the high-velocity jet will follow
the face of the overflow and then continue in an erratic and
fluctuating path for a considerable distance under and through the
slower water; and
5. no jump may occur-the jet will break away from the face of the
overflow and ride along the surface for a short distance and then
erratically intermingle with the slow moving water underneath.
Ratio of discharge coefficients
resulting from apron effects
Ratio of discharge coefficients caused
by tailwater effects
Uncontrolled Ogee Crests Designed for
less than Maximum Head
• Use of a smaller design head results in increased discharges for the
full range of heads.
• The increase in capacity makes it possible to achieve economy by
reducing either the crest length or the maximum surcharge head.
• The subatmospheric pressures on a nappe-shaped crest do not
exceed about one-half the design head when the design head is not
less than about 75 percent of the maximum head.
• For most conditions in the design of spillways, these negative
pressures will be small, and they can be tolerated because they will
not approach absolute pressures that can induce cavitation.
• Care must be taken, however, in forming the surface of the crest
where these negative pressures will occur.
• The negative pressure on the crest may be resolved into a system of
forces acting both upward and downstream. These forces should be
considered in analyzing the structural stability of the crest structure.
Sub atmospheric crest pressures for
𝐻 𝑜
𝐻 𝑒
= 0.75
Sub atmospheric crest
pressures
All other conditions remaining
the same, pressures along the
side of the crest piers are
always lower than those along
the center line of the span.
WES suggest that the maximum
negative pressure on the crest
should be restricted to (-6m) of
water and that the crest profile
be designed for a head
𝐻 𝑜 = 0.309𝐻𝑒_𝑚𝑎𝑥
1.2186
(in ft
units).
Determination of Design Head
• Hager (1991) has generalized the results of studies of various
research workers as follows:
• The absolute minimum of crest pressure, 𝑃 𝑚𝑖𝑛
𝑃 𝑚𝑖𝑛
𝐻𝑒
= 𝛾(1 − 𝜒)
Where
𝜒 =
𝐻𝑒
𝐻 𝑜
𝐻𝑒 = Operating head
𝐻0 = Design head, and
𝛾 = Coefficient of proportionality
= 1 for WES profile with 45 downstream slope
= 0.9 for WES profile with 30 downstream slope
Determination of Design Head contd.
• The location of zero bottom pressure, 𝑋0 from crest axis
𝑋 𝑜
𝐻 𝑜
= 0.9𝑡𝑎𝑛𝛼(
𝐻𝑒
𝐻 𝑜
− 1)0.43
Where 𝛼 is the downstream slope.
The coefficient of discharge
𝐶 𝑑 =
2
3 3
1 +
4𝜒
9 + 5𝜒
In the equation 𝑄 = 𝐶 𝑑 ∗ 𝑏(2𝑔𝐻3
)0.5
Or
𝐶 𝑑 =
1
3
1 +
4𝜒
9+5𝜒
in the equation 𝑄 = 2/3𝐶 𝑑 ∗ 𝑏(2𝑔𝐻3
)0.5
Determination of Design Head contd.
• The limiting operating head, 𝐻𝐿for a given crest
profile is governed by the magnitude of the
minimum pressure on the crest which could
induce cavitation.
• Theoretically, this pressure is the vapour
pressure, 𝑃𝑣 , Inserting 𝑃𝑣 in place of 𝑃 𝑚𝑖𝑛and
𝐻𝐿in place of 𝐻𝑒in equation slide 52 yields:
𝐻𝐿 =
𝑃𝑣
𝛾(1 − 𝜒)
Determination of Design Head contd.
• Cavitation is also dependent on the air
content and particularly on the local
turbulence level and smoothness of the flow
surfaces.
• Considering the uncertainties of these factors,
Abecasis (1970) assumed a minimum pressure
of -7.6 m for incipient cavitation.
Downstream Slope or Rear Slope
• The downstream slope is made tangential to the crest profile with
the angle of the slope generally determined by requirement of
structural stability.
• Slopes are usually in the range of 0.6H:1V to 1.1H:1V.
• The rear slope together with sidewalls constitutes the discharge
channel leading the flow from the crest to the energy dissipator.
• Because of the acceleration of the flow and the gradual increase in
the velocity, extreme care is required to ensure that the profile of
the discharge channel, both in elevation and plan, strictly conforms
to the design profile.
• Also, the specified tolerances of surface finish is to be adhered to,
as otherwise cavitation damage can be inflicted if flow velocity
exceeds 25 m/s.
Water Surface Profile
• Water surface profiles in the crest region of standard
spillway profiles, including the effects of piers and
abutments, have been given in WES
• The generalized relationship for a freely overflowing
spillway without piers, etc. is:
𝑆 = 0.75 𝜒1.1
−
1
6
𝑋
Where S =
𝑠
𝐻 𝑜
𝑠 =Vertically measured flow depth
X =
𝑥
𝐻 𝑜
𝑥 =Longitudinal coordinate and −2 < 𝑋 < 2
Spillway Toe
• The spillway toe is the junction between the
discharge channel and can be design as the
energy dissipator component.
• Its function is to guide the flow passing down the
spillway and smoothly in the energy.
• A toe curve is made up of a circular arc,
tangential to both the rear slope and the apron.
• A minimum radius of 3 times the depth of flow
entering the toe is recommended.
Spillway Toe contd.
• The pressures on the floor and sidewalls in the region
of the curvature increase due to centrifugal action.
• The resulting pressure is the summation of the
hydrostatic pressure and the centrifugal pressure, given
by:
𝑃
𝛾
= 𝑌(1 +
𝑉2
𝑔𝑅
)
• Where
• 𝑌 is the Depth of flow at the toe
• 𝑉 is the mean velocity at the toe
• 𝑅 is the radius of the toe curvature
Gate-Controlled Ogee Crests
• Releases for partial gate openings for gated
crests occur as orifice flow.
• With full head on a gate that is opened a small
amount, a free discharging trajectory will
follow the path of a jet issuing from an orifice.
Gate-Controlled Ogee Crests contd.
• Releases for partial gate openings for gated crests
occur as orifice flow.
• With full head on a gate that is opened a small
amount, a free discharging trajectory will follow
the path of a jet issuing from an orifice.
• For a vertical orifice the path of the jet can be
expressed by the parabolic equation:
−𝑦 = 𝑥𝑡𝑎𝑛𝜃 +
𝑥2
4𝐻𝑐𝑜𝑠2 𝜃
where 𝐻 is the head on the center of the opening.
Gate-Controlled Ogee Crests contd.
• If subatmospheric pressures are to be avoided along the
crest contact, the shape of the ogee downstream from the
gate sill must conform to the trajectory profile.
• Gates operated with small openings under high heads
produce negative pressures along the crest in the region
immediately below the gate if the ogee profile drops below
the trajectory profile.
• Tests showed the subatmospheric pressures would be equal
to about one-tenth of the design head when the gate is
operated at small openings and the ogee is shaped to the
ideal nappe profile for maximum head 𝐻𝑜.
Gate-Controlled Ogee Crests contd.
• The trajectory profile (rather than the nappe) may
be adopted to avoid subatmospheric pressure
zones along the crest.
• Where the ogee is shaped to the ideal nappe
profile for maximum head, the subatmospheric
pressure area can be minimized by placing the
gate sill downstream from the crest of the ogee.
Discharge Over Gate-Controlled Ogee
Crests
• The discharge for a gated ogee crest at partial
gate openings will be similar to flow through an
orifice and may be computed by the equation:
𝑄 = 𝐶𝐷𝐿 2𝑔𝐻
where:
𝐻 = head to the center of the gate opening
(including the velocity head of approach),
𝐷 = shortest distance from the gate lip to the crest
curve, and
𝐿 = crest width.
Reading Assignment
• Design of small dams (USBR), page 365-376
Deign of Overfall Spillway
• An overfall spillway
can be gated or
ungated and
provided for flow
over an arch or
buttress dam.
Deign of Overfall Spillway contd.
• The main concern in the design of free jet
spillways is either the deep scour just
downstream of the dam (as in the case of a
deflected jet) or impact forces on the stilling
basin floor at the foot of the dam (with a free
falling jet).
• The free jet falls from straight drop spillway
also known as the box inlet drop spillway
which is simply a rectangular box.
Deign of Overfall Spillway contd.
Design Considerations
• The choice of the type of discharge structure—
whether to have a free over-fall over a crest or a
deep-seated bottom outlet—depends largely on
the volume of flood to be disposed, width of the
gorge, and the characteristics of the rock forming
the gorge and riverbed.
• With free over-fall over the top, the jet would fall
very near the base of the dam where a concrete-
lined stilling basin would be necessary to prevent
undermining.
Deign of Overfall Spillway contd.
• The hydraulic characteristics are
defined as follows:
o The crest structure and discharge
rating are similar to those for the
overflow spillway.
o The flow normally leaves this
structure shortly below the crest.
o The exit structure is normally some
variation of a flip-bucket.
o The flip-bucket radius, 𝑅 for an
overfall spillway is at least 5𝑑, where
𝑑 is the flow depth at the bottom of
the bucket.
Deign of Overfall Spillway contd.
Overflow Crest
• Overflow crest profiles on the top of arch dams
have to be adjusted with overhangs either on the
upstream, downstream, or on both sides, since
the width available at the top is seldom adequate
to base an overflow profile.
• A standard ogee profile or parabolic profile is
suitable with the required overhang.
• Generally, three types of profiles are used:
Profiles terminating such that the overflow jet is directed to fall on
the concrete apron for the entire range of discharges.
Overflow profile ( Beznar dam, Granada)
Overflow profile with nappe splitters (Palawan dam, Rhodesia).
Profiles with nappe splitters to effect aeration of the jet and
spreading over larger area.
Profiles with ski jump buckets to deflect the jet far away.
Deign of Overfall Spillway contd.
• The radius is usually undersized to minimize the size of the
overhang, which can destabilize the top of a thin-arch dam.
• However, the radius should be sufficient to fully—deflect a
significant flood.
• The bucket exit angle is selected to throw the jet to a suitable
location in the tailrace.
• The trajectory can be estimated by:
𝑦 = 𝑥𝑡𝑎𝑛𝜃 −
𝑥2
3.6𝐻𝑐𝑜𝑠2 𝜃
where:
𝑦 = 𝑣𝑒𝑟𝑡𝑖𝑐𝑎𝑙 𝑑𝑖𝑠𝑡𝑎𝑛𝑐𝑒 𝑓𝑟𝑜𝑚 𝑡ℎ𝑒 𝑏𝑢𝑐𝑘𝑒𝑡 𝑙𝑖𝑝
𝑥 = ℎ𝑜𝑟𝑖𝑧𝑜𝑛𝑡𝑎𝑙 𝑑𝑖𝑠𝑡𝑎𝑛𝑐𝑒 𝑓𝑟𝑜𝑚 𝑡ℎ𝑒 𝑏𝑢𝑐𝑘𝑒𝑡 𝑙𝑖𝑝
𝜃 = 𝑏𝑢𝑐𝑘𝑒𝑡 𝑒𝑥𝑖𝑡 𝑎𝑛𝑔𝑙𝑒, and 𝐻 = 𝑑𝑒𝑝𝑡ℎ +
𝑣𝑒𝑙𝑜𝑐𝑖𝑡𝑦 ℎ𝑒𝑎𝑑 𝑎𝑡 𝑡ℎ𝑒 𝑏𝑢𝑐𝑘𝑒𝑡 𝑙𝑖p.
Kariba dam spillway, Zimbabwe (after
ICOLD, 1987)
Deign of Overfall Spillway contd.
• The energy from an overfall spillway is normally
dissipated by a plunge pool, which can be lined or
unlined.
• If unlined, the scour and the scour rate will be based
on both flow and geology.
• The scour hole development is usually
indeterminate.
• However, the terminal scour depth for a uniformly
erodible material can be estimated from the
following empirical formula (Coleman, 1982; USBR,
1987)
Deign of Overfall Spillway contd

More Related Content

What's hot

Reservoir capacity
Reservoir capacityReservoir capacity
Reservoir capacity
onyx3
 
Dams and spillways
Dams and spillwaysDams and spillways
Dam design
Dam designDam design
Dam design
Mohammed Maina
 
Canal Regulation Work
Canal Regulation WorkCanal Regulation Work
Canal Regulation Work
Yash Patel
 
Reservoir Planning
Reservoir PlanningReservoir Planning
Reservoir Planning
Sunny Agarwal
 
Design of stilling basin and roughness devices
Design of stilling basin and roughness devices Design of stilling basin and roughness devices
Design of stilling basin and roughness devices
Bilal Mirani
 
River training works lecture
River training works lectureRiver training works lecture
River training works lecture
sarhad university peshawer
 
Spillways &amp; energy dissipator
Spillways &amp; energy dissipatorSpillways &amp; energy dissipator
Spillways &amp; energy dissipator
SAGAR RAUT
 
CH-2.pptx
CH-2.pptxCH-2.pptx
design of weirs
design of weirsdesign of weirs
design of weirs
SANJEEV Wazir
 
Intake structures
Intake structures Intake structures
Intake structures
Sachin PatiL
 
energy dissipators
energy dissipatorsenergy dissipators
energy dissipators
SANJEEV Wazir
 
Diversion Headworks
Diversion HeadworksDiversion Headworks
Diversion Headworks
Malla Reddy University
 
Storage and distribution reservoirs
Storage and distribution reservoirsStorage and distribution reservoirs
Storage and distribution reservoirs
farooq husain
 
Unit 3 spillway
Unit 3 spillwayUnit 3 spillway
Unit 3 spillway
Mood Naik
 
Arch and Buttress Dams
Arch and Buttress DamsArch and Buttress Dams
Arch and Buttress Dams
GAURAV. H .TANDON
 
Diversion headworks
Diversion headworksDiversion headworks
Diversion headworks
Jimit Shah
 
design of gravity dam
design of gravity damdesign of gravity dam
design of gravity damRisso Johnny
 
Dam outlet works lecture 3
Dam outlet works lecture 3Dam outlet works lecture 3
Dam outlet works lecture 3
Vidhi Khokhani
 
design of aqueduct
design of aqueductdesign of aqueduct
design of aqueductsanthosh2121
 

What's hot (20)

Reservoir capacity
Reservoir capacityReservoir capacity
Reservoir capacity
 
Dams and spillways
Dams and spillwaysDams and spillways
Dams and spillways
 
Dam design
Dam designDam design
Dam design
 
Canal Regulation Work
Canal Regulation WorkCanal Regulation Work
Canal Regulation Work
 
Reservoir Planning
Reservoir PlanningReservoir Planning
Reservoir Planning
 
Design of stilling basin and roughness devices
Design of stilling basin and roughness devices Design of stilling basin and roughness devices
Design of stilling basin and roughness devices
 
River training works lecture
River training works lectureRiver training works lecture
River training works lecture
 
Spillways &amp; energy dissipator
Spillways &amp; energy dissipatorSpillways &amp; energy dissipator
Spillways &amp; energy dissipator
 
CH-2.pptx
CH-2.pptxCH-2.pptx
CH-2.pptx
 
design of weirs
design of weirsdesign of weirs
design of weirs
 
Intake structures
Intake structures Intake structures
Intake structures
 
energy dissipators
energy dissipatorsenergy dissipators
energy dissipators
 
Diversion Headworks
Diversion HeadworksDiversion Headworks
Diversion Headworks
 
Storage and distribution reservoirs
Storage and distribution reservoirsStorage and distribution reservoirs
Storage and distribution reservoirs
 
Unit 3 spillway
Unit 3 spillwayUnit 3 spillway
Unit 3 spillway
 
Arch and Buttress Dams
Arch and Buttress DamsArch and Buttress Dams
Arch and Buttress Dams
 
Diversion headworks
Diversion headworksDiversion headworks
Diversion headworks
 
design of gravity dam
design of gravity damdesign of gravity dam
design of gravity dam
 
Dam outlet works lecture 3
Dam outlet works lecture 3Dam outlet works lecture 3
Dam outlet works lecture 3
 
design of aqueduct
design of aqueductdesign of aqueduct
design of aqueduct
 

Similar to Lecture 1 free overfall and ogee

Cross drainage works irrigation engineering
Cross drainage works irrigation engineeringCross drainage works irrigation engineering
Cross drainage works irrigation engineering
Anuj Kumar
 
Lecture 0 design of spilways an overview
Lecture 0 design of spilways an overviewLecture 0 design of spilways an overview
Lecture 0 design of spilways an overview
Addis Ababa Science and Technology University
 
Cross Drainage Works
Cross Drainage WorksCross Drainage Works
Cross Drainage Works
GAURAV. H .TANDON
 
CROSS DRAINAGE WORKS _ MODULE III.pdf CROSS DRAINAGE WORKS _ MODULE III.pdf
CROSS DRAINAGE WORKS _ MODULE III.pdf CROSS DRAINAGE WORKS _ MODULE III.pdfCROSS DRAINAGE WORKS _ MODULE III.pdf CROSS DRAINAGE WORKS _ MODULE III.pdf
CROSS DRAINAGE WORKS _ MODULE III.pdf CROSS DRAINAGE WORKS _ MODULE III.pdf
GOWTHAM14499
 
about dam of archi that is cost effective
about dam of archi that is cost effectiveabout dam of archi that is cost effective
about dam of archi that is cost effective
FikaduDebiso
 
My Work
My WorkMy Work
Piping Design_Unit 1.pptx
Piping Design_Unit 1.pptxPiping Design_Unit 1.pptx
Piping Design_Unit 1.pptx
Abhay Rajput
 
Ce 3205-lecture-08-spillways
Ce 3205-lecture-08-spillwaysCe 3205-lecture-08-spillways
Ce 3205-lecture-08-spillways
saibabu48
 
unit 4 vsem cross drainage works & srturcture water resource engineering Siph...
unit 4 vsem cross drainage works & srturcture water resource engineering Siph...unit 4 vsem cross drainage works & srturcture water resource engineering Siph...
unit 4 vsem cross drainage works & srturcture water resource engineering Siph...
Denish Jangid
 
050218 chapter 7 spillways and energy dissipators
050218 chapter 7 spillways and energy dissipators050218 chapter 7 spillways and energy dissipators
050218 chapter 7 spillways and energy dissipators
Binu Karki
 
HYDROPOWER - Hydroelectric power generation
HYDROPOWER - Hydroelectric power generationHYDROPOWER - Hydroelectric power generation
HYDROPOWER - Hydroelectric power generation
Robbie Edward Sayers
 
Numerical Simulation and Design Optimization of Intake and Spiral Case for Lo...
Numerical Simulation and Design Optimization of Intake and Spiral Case for Lo...Numerical Simulation and Design Optimization of Intake and Spiral Case for Lo...
Numerical Simulation and Design Optimization of Intake and Spiral Case for Lo...
IOSR Journals
 
F012133539
F012133539F012133539
F012133539
IOSR Journals
 
Numerical Simulation and Design Optimization of Intake and Spiral Case for Lo...
Numerical Simulation and Design Optimization of Intake and Spiral Case for Lo...Numerical Simulation and Design Optimization of Intake and Spiral Case for Lo...
Numerical Simulation and Design Optimization of Intake and Spiral Case for Lo...
IOSR Journals
 
weirs
weirsweirs
weirs
Fahad Tk
 
Ch-3.pptx
Ch-3.pptxCh-3.pptx
MANUFACTURING SCIENCE S5ME -NITC-2016-SUBTOPICS
MANUFACTURING SCIENCE S5ME -NITC-2016-SUBTOPICS MANUFACTURING SCIENCE S5ME -NITC-2016-SUBTOPICS
MANUFACTURING SCIENCE S5ME -NITC-2016-SUBTOPICS
Jagadeesha Thimmaiah
 
Spillways
SpillwaysSpillways
Spillways
Divya Vishnoi
 
Presentation on notches and weirs
Presentation on notches and weirsPresentation on notches and weirs
Presentation on notches and weirs
sush_vyas
 
Diversion Works_Part4_Civil_Engineering.pdf
Diversion Works_Part4_Civil_Engineering.pdfDiversion Works_Part4_Civil_Engineering.pdf
Diversion Works_Part4_Civil_Engineering.pdf
adityajarwal2004
 

Similar to Lecture 1 free overfall and ogee (20)

Cross drainage works irrigation engineering
Cross drainage works irrigation engineeringCross drainage works irrigation engineering
Cross drainage works irrigation engineering
 
Lecture 0 design of spilways an overview
Lecture 0 design of spilways an overviewLecture 0 design of spilways an overview
Lecture 0 design of spilways an overview
 
Cross Drainage Works
Cross Drainage WorksCross Drainage Works
Cross Drainage Works
 
CROSS DRAINAGE WORKS _ MODULE III.pdf CROSS DRAINAGE WORKS _ MODULE III.pdf
CROSS DRAINAGE WORKS _ MODULE III.pdf CROSS DRAINAGE WORKS _ MODULE III.pdfCROSS DRAINAGE WORKS _ MODULE III.pdf CROSS DRAINAGE WORKS _ MODULE III.pdf
CROSS DRAINAGE WORKS _ MODULE III.pdf CROSS DRAINAGE WORKS _ MODULE III.pdf
 
about dam of archi that is cost effective
about dam of archi that is cost effectiveabout dam of archi that is cost effective
about dam of archi that is cost effective
 
My Work
My WorkMy Work
My Work
 
Piping Design_Unit 1.pptx
Piping Design_Unit 1.pptxPiping Design_Unit 1.pptx
Piping Design_Unit 1.pptx
 
Ce 3205-lecture-08-spillways
Ce 3205-lecture-08-spillwaysCe 3205-lecture-08-spillways
Ce 3205-lecture-08-spillways
 
unit 4 vsem cross drainage works & srturcture water resource engineering Siph...
unit 4 vsem cross drainage works & srturcture water resource engineering Siph...unit 4 vsem cross drainage works & srturcture water resource engineering Siph...
unit 4 vsem cross drainage works & srturcture water resource engineering Siph...
 
050218 chapter 7 spillways and energy dissipators
050218 chapter 7 spillways and energy dissipators050218 chapter 7 spillways and energy dissipators
050218 chapter 7 spillways and energy dissipators
 
HYDROPOWER - Hydroelectric power generation
HYDROPOWER - Hydroelectric power generationHYDROPOWER - Hydroelectric power generation
HYDROPOWER - Hydroelectric power generation
 
Numerical Simulation and Design Optimization of Intake and Spiral Case for Lo...
Numerical Simulation and Design Optimization of Intake and Spiral Case for Lo...Numerical Simulation and Design Optimization of Intake and Spiral Case for Lo...
Numerical Simulation and Design Optimization of Intake and Spiral Case for Lo...
 
F012133539
F012133539F012133539
F012133539
 
Numerical Simulation and Design Optimization of Intake and Spiral Case for Lo...
Numerical Simulation and Design Optimization of Intake and Spiral Case for Lo...Numerical Simulation and Design Optimization of Intake and Spiral Case for Lo...
Numerical Simulation and Design Optimization of Intake and Spiral Case for Lo...
 
weirs
weirsweirs
weirs
 
Ch-3.pptx
Ch-3.pptxCh-3.pptx
Ch-3.pptx
 
MANUFACTURING SCIENCE S5ME -NITC-2016-SUBTOPICS
MANUFACTURING SCIENCE S5ME -NITC-2016-SUBTOPICS MANUFACTURING SCIENCE S5ME -NITC-2016-SUBTOPICS
MANUFACTURING SCIENCE S5ME -NITC-2016-SUBTOPICS
 
Spillways
SpillwaysSpillways
Spillways
 
Presentation on notches and weirs
Presentation on notches and weirsPresentation on notches and weirs
Presentation on notches and weirs
 
Diversion Works_Part4_Civil_Engineering.pdf
Diversion Works_Part4_Civil_Engineering.pdfDiversion Works_Part4_Civil_Engineering.pdf
Diversion Works_Part4_Civil_Engineering.pdf
 

Recently uploaded

WATER CRISIS and its solutions-pptx 1234
WATER CRISIS and its solutions-pptx 1234WATER CRISIS and its solutions-pptx 1234
WATER CRISIS and its solutions-pptx 1234
AafreenAbuthahir2
 
Student information management system project report ii.pdf
Student information management system project report ii.pdfStudent information management system project report ii.pdf
Student information management system project report ii.pdf
Kamal Acharya
 
road safety engineering r s e unit 3.pdf
road safety engineering  r s e unit 3.pdfroad safety engineering  r s e unit 3.pdf
road safety engineering r s e unit 3.pdf
VENKATESHvenky89705
 
Planning Of Procurement o different goods and services
Planning Of Procurement o different goods and servicesPlanning Of Procurement o different goods and services
Planning Of Procurement o different goods and services
JoytuBarua2
 
Architectural Portfolio Sean Lockwood
Architectural Portfolio Sean LockwoodArchitectural Portfolio Sean Lockwood
Architectural Portfolio Sean Lockwood
seandesed
 
Design and Analysis of Algorithms-DP,Backtracking,Graphs,B&B
Design and Analysis of Algorithms-DP,Backtracking,Graphs,B&BDesign and Analysis of Algorithms-DP,Backtracking,Graphs,B&B
Design and Analysis of Algorithms-DP,Backtracking,Graphs,B&B
Sreedhar Chowdam
 
power quality voltage fluctuation UNIT - I.pptx
power quality voltage fluctuation UNIT - I.pptxpower quality voltage fluctuation UNIT - I.pptx
power quality voltage fluctuation UNIT - I.pptx
ViniHema
 
Halogenation process of chemical process industries
Halogenation process of chemical process industriesHalogenation process of chemical process industries
Halogenation process of chemical process industries
MuhammadTufail242431
 
The role of big data in decision making.
The role of big data in decision making.The role of big data in decision making.
The role of big data in decision making.
ankuprajapati0525
 
H.Seo, ICLR 2024, MLILAB, KAIST AI.pdf
H.Seo,  ICLR 2024, MLILAB,  KAIST AI.pdfH.Seo,  ICLR 2024, MLILAB,  KAIST AI.pdf
H.Seo, ICLR 2024, MLILAB, KAIST AI.pdf
MLILAB
 
Standard Reomte Control Interface - Neometrix
Standard Reomte Control Interface - NeometrixStandard Reomte Control Interface - Neometrix
Standard Reomte Control Interface - Neometrix
Neometrix_Engineering_Pvt_Ltd
 
Water Industry Process Automation and Control Monthly - May 2024.pdf
Water Industry Process Automation and Control Monthly - May 2024.pdfWater Industry Process Automation and Control Monthly - May 2024.pdf
Water Industry Process Automation and Control Monthly - May 2024.pdf
Water Industry Process Automation & Control
 
Vaccine management system project report documentation..pdf
Vaccine management system project report documentation..pdfVaccine management system project report documentation..pdf
Vaccine management system project report documentation..pdf
Kamal Acharya
 
COLLEGE BUS MANAGEMENT SYSTEM PROJECT REPORT.pdf
COLLEGE BUS MANAGEMENT SYSTEM PROJECT REPORT.pdfCOLLEGE BUS MANAGEMENT SYSTEM PROJECT REPORT.pdf
COLLEGE BUS MANAGEMENT SYSTEM PROJECT REPORT.pdf
Kamal Acharya
 
TECHNICAL TRAINING MANUAL GENERAL FAMILIARIZATION COURSE
TECHNICAL TRAINING MANUAL   GENERAL FAMILIARIZATION COURSETECHNICAL TRAINING MANUAL   GENERAL FAMILIARIZATION COURSE
TECHNICAL TRAINING MANUAL GENERAL FAMILIARIZATION COURSE
DuvanRamosGarzon1
 
Quality defects in TMT Bars, Possible causes and Potential Solutions.
Quality defects in TMT Bars, Possible causes and Potential Solutions.Quality defects in TMT Bars, Possible causes and Potential Solutions.
Quality defects in TMT Bars, Possible causes and Potential Solutions.
PrashantGoswami42
 
Nuclear Power Economics and Structuring 2024
Nuclear Power Economics and Structuring 2024Nuclear Power Economics and Structuring 2024
Nuclear Power Economics and Structuring 2024
Massimo Talia
 
weather web application report.pdf
weather web application report.pdfweather web application report.pdf
weather web application report.pdf
Pratik Pawar
 
Final project report on grocery store management system..pdf
Final project report on grocery store management system..pdfFinal project report on grocery store management system..pdf
Final project report on grocery store management system..pdf
Kamal Acharya
 
Cosmetic shop management system project report.pdf
Cosmetic shop management system project report.pdfCosmetic shop management system project report.pdf
Cosmetic shop management system project report.pdf
Kamal Acharya
 

Recently uploaded (20)

WATER CRISIS and its solutions-pptx 1234
WATER CRISIS and its solutions-pptx 1234WATER CRISIS and its solutions-pptx 1234
WATER CRISIS and its solutions-pptx 1234
 
Student information management system project report ii.pdf
Student information management system project report ii.pdfStudent information management system project report ii.pdf
Student information management system project report ii.pdf
 
road safety engineering r s e unit 3.pdf
road safety engineering  r s e unit 3.pdfroad safety engineering  r s e unit 3.pdf
road safety engineering r s e unit 3.pdf
 
Planning Of Procurement o different goods and services
Planning Of Procurement o different goods and servicesPlanning Of Procurement o different goods and services
Planning Of Procurement o different goods and services
 
Architectural Portfolio Sean Lockwood
Architectural Portfolio Sean LockwoodArchitectural Portfolio Sean Lockwood
Architectural Portfolio Sean Lockwood
 
Design and Analysis of Algorithms-DP,Backtracking,Graphs,B&B
Design and Analysis of Algorithms-DP,Backtracking,Graphs,B&BDesign and Analysis of Algorithms-DP,Backtracking,Graphs,B&B
Design and Analysis of Algorithms-DP,Backtracking,Graphs,B&B
 
power quality voltage fluctuation UNIT - I.pptx
power quality voltage fluctuation UNIT - I.pptxpower quality voltage fluctuation UNIT - I.pptx
power quality voltage fluctuation UNIT - I.pptx
 
Halogenation process of chemical process industries
Halogenation process of chemical process industriesHalogenation process of chemical process industries
Halogenation process of chemical process industries
 
The role of big data in decision making.
The role of big data in decision making.The role of big data in decision making.
The role of big data in decision making.
 
H.Seo, ICLR 2024, MLILAB, KAIST AI.pdf
H.Seo,  ICLR 2024, MLILAB,  KAIST AI.pdfH.Seo,  ICLR 2024, MLILAB,  KAIST AI.pdf
H.Seo, ICLR 2024, MLILAB, KAIST AI.pdf
 
Standard Reomte Control Interface - Neometrix
Standard Reomte Control Interface - NeometrixStandard Reomte Control Interface - Neometrix
Standard Reomte Control Interface - Neometrix
 
Water Industry Process Automation and Control Monthly - May 2024.pdf
Water Industry Process Automation and Control Monthly - May 2024.pdfWater Industry Process Automation and Control Monthly - May 2024.pdf
Water Industry Process Automation and Control Monthly - May 2024.pdf
 
Vaccine management system project report documentation..pdf
Vaccine management system project report documentation..pdfVaccine management system project report documentation..pdf
Vaccine management system project report documentation..pdf
 
COLLEGE BUS MANAGEMENT SYSTEM PROJECT REPORT.pdf
COLLEGE BUS MANAGEMENT SYSTEM PROJECT REPORT.pdfCOLLEGE BUS MANAGEMENT SYSTEM PROJECT REPORT.pdf
COLLEGE BUS MANAGEMENT SYSTEM PROJECT REPORT.pdf
 
TECHNICAL TRAINING MANUAL GENERAL FAMILIARIZATION COURSE
TECHNICAL TRAINING MANUAL   GENERAL FAMILIARIZATION COURSETECHNICAL TRAINING MANUAL   GENERAL FAMILIARIZATION COURSE
TECHNICAL TRAINING MANUAL GENERAL FAMILIARIZATION COURSE
 
Quality defects in TMT Bars, Possible causes and Potential Solutions.
Quality defects in TMT Bars, Possible causes and Potential Solutions.Quality defects in TMT Bars, Possible causes and Potential Solutions.
Quality defects in TMT Bars, Possible causes and Potential Solutions.
 
Nuclear Power Economics and Structuring 2024
Nuclear Power Economics and Structuring 2024Nuclear Power Economics and Structuring 2024
Nuclear Power Economics and Structuring 2024
 
weather web application report.pdf
weather web application report.pdfweather web application report.pdf
weather web application report.pdf
 
Final project report on grocery store management system..pdf
Final project report on grocery store management system..pdfFinal project report on grocery store management system..pdf
Final project report on grocery store management system..pdf
 
Cosmetic shop management system project report.pdf
Cosmetic shop management system project report.pdfCosmetic shop management system project report.pdf
Cosmetic shop management system project report.pdf
 

Lecture 1 free overfall and ogee

  • 1. Addis Ababa Science and Technology College of Architecture and Civil Engineering HYDRALUCIS STRUCURES I CENG 6605 Mesay Daniel (PhD) Fitsum Tesfaye (PhD)
  • 2. HYDRALUCIS STRUCURES I CENG 6605 Chapter 1: Hydraulic design of overflow structures
  • 3. Spillway • The principal function of a spillway is to pass down the surplus water from the reservoir into the downstream river. • After a spillway control device and its dimensions have been selected, the maximum spillway discharge and the maximum reservoir water level should be determined by flood routing. • Cost estimates of the spillway and the dam should be made. • Comparisons of various combinations of spillway capacity and dam height for an assumed spillway type, and of alternative types of spillways allow selection of an economical spillway type.
  • 4. Comparative costs of spillway-dam combinations
  • 5. Selection of Spillway Size and Type General Considerations • All pertinent factors of hydrology, hydraulics, design, cost, and damage should be considered. • In this connection and when applicable, consideration should be given to such factors as: – the characteristics of the flood hydrograph – the damages that would result if such a flood occurred without the dam – the damages that would result if such a flood occurred with the dam in place – the damages that would occur if the dam or spillway were breached, – the effects of various dam and spillway combinations on the probable damages upstream and downstream of the dam – the relative costs of increasing the capacity of spillway – the use of combined outlet facilities to serve more than one function
  • 7. Design of Ogee Spillways General • The ogee or overflow spillway is the most common type of spillway. • It has a control weir that is ogee or S- shaped. • It is a gravity structure requiring sound foundation and is preferably located in the main river channel, although there are many spillways located on the flanks in excavated channels due to foundation problems. • The structure divides naturally into three zones: the crest, the rear slope, and the toe. • Because of its high discharge efficiency, the nappe-shaped profile is used for most spillway control crests.
  • 8. Design of Ogee Spillways contd. General • The application of the theory of flow through spillways is based largely upon empirical coefficients, so the designer should deal with maximum and minimum values as well as averages, depending upon the design objective. • To be conservative, the designer should generally use maximum loss factors in computing discharge capacity, and minimum loss factors in computing velocities for the design of energy dissipators. • As more model and prototype data become available, the range between maximum and minimum coefficients used in design should be narrowed.
  • 9. Design of Ogee Spillways contd. Basic Considerations • A spillway is sized to provide the required capacity, usually the entire spillway design flood, at a specific reservoir elevation. • This elevation is normally at the maximum operating level or at a surcharge elevation greater than the maximum operating level.
  • 10. Design of Ogee Spillways contd. Hydraulic analysis of a spillway usually involves four conditions of flow: 1. Subcritical flow in the spillway approach, initially at a low velocity, accelerating, however, as it approaches the crest. 2. Critical flow as the water passes over the spillway crest. 3. Supercritical flow in the chute below the crest. 4. Transitional flow at or near the terminus of the chute where the flow must transition back to subcritical.
  • 11. Design of Ogee Spillways contd. Basic Considerations contd. • When a relatively large storage capacity can be obtained above the normal maximum reservoir elevation by increasing the dam height, a portion of the flood volume can be stored in this reservoir surcharge space and the size of the spillway can be reduced. • The use of a surcharge pool for passing the spillway design flood involves an economic analysis that considers the added cost of a dam height compared to the cost of a wider and/or deeper spillway. • When a gated spillway is considered, the added cost of higher and/or additional gates and piers must be compared to the cost of additional dam height.
  • 12. Shape for Uncontrolled Ogee Crest • Crest shapes have been studied extensively in the Bureau of US Reclamation Hydraulics Laboratories. • For most conditions the data can be summarized according to the form shown on in next slide, where the profile is defined as it relates to axis at the apex of the crest.
  • 13. Figure : Elements of nappe-shaped crest profiles
  • 14. Shape for Uncontrolled Ogee Crest contd. • That upstream portion from the origin is defined as either a single curve and a tangent or as a compound circular curve. • The downstream portion is defined by the equation: 𝑦 𝐻 𝑜 = −𝐾 𝑥 𝐻 𝑜 𝑛 in which 𝐾 and 𝑛 are constants whose values depend on the upstream inclination and on the velocity of approach. The following figure gives values of these constants for different conditions.
  • 15.
  • 16. Shape for Uncontrolled Ogee Crest contd. • The approximate profile shape for a crest with a vertical upstream face and negligible velocity of approach is shown in the following figure. • The profile is constructed in the form of a compound circular curve with radii expressed in terms of the design head, 𝐻 𝑜. • This definition avoids the need for solving an exponential equation; furthermore, it is represented in a form easily used by a layman for constructing forms or templates.
  • 17.
  • 18. Shape for Uncontrolled Ogee Crest contd. • For ordinary design conditions for small spillways where 𝑃 ≥ 0.5𝐻 𝑜, this profile is sufficiently accurate to avoid seriously reduced crest pressures and does not materially alter the hydraulic efficiency of the crest. • When the 𝑃 < 0.5𝐻 𝑜 on the crest, the profile should be determined from the given exponential formula.
  • 19. Shape for Uncontrolled Ogee Crest contd • US Army Corps of Engineers, WES (1952) has developed several standard shapes, designated as WES standard spillway shapes, represented on the downstream of the crest axis by the equation: 𝑋 𝑛 = 𝐾𝐻 𝑜 𝑛−1 𝑌 Where 𝑋 and 𝑌 are coordinates of crest profile with origin at the highest point of the crest. 𝐻 𝑜is the design head including velocity head of the approach flow. 𝐾 and 𝑛 are parameters depending on the slope of the upstream face.
  • 21. Shape for Uncontrolled Ogee Crest contd • In the revised procedure developed by WES using the data of USBR, the upstream quadrant was shaped as an ellipse with the equation: 𝑋2 𝐴2 + 𝑌2 𝐵2 = 1 Where 𝐴 = Semi-major axis (functions of the ratio of approach depth to design head) 𝐵 =Semi-minor axis (-do-) • And the downstream profile conformed to the equation 𝑋1.85 = 𝐾𝐻 𝑜 0.85 𝑌 where 𝐾 is a parameter depending on the ratio approach depth and design head.
  • 22. Shape far Uncontrolled Ogee Crest contd • The design curves suggested by WES are reproduced as shown the following slide. • For 𝑃 𝐻 𝑜 = 2, 𝐴 and 𝐵 become constant with values of 0.28𝐻 𝑜 and 0.164 0.16𝐻 𝑜 respectively.
  • 23.
  • 24. Spillway Discharge • The ogee crest spillway is basically a sharp-crested weir with the space below the lower nappe filled with concrete. • The shape of such a profile depends upon the head, the inclination of the upstream face of the overflow section, and the height of the overflow section above the floor of the entrance channel (which influences the velocity of approach to the crest). • The discharge over a spill-way crest is limited by the same parameters as the weir, and determined by the following: 𝑄 = 𝐶𝐿 𝑒 𝐻𝑒 3/2 𝑄= discharge C= Coefficient of discharge 𝐿 𝑒=effective length 𝐻𝑒=Specific energy above the crest center
  • 25. Spillway Discharge contd. • The discharge coefficient is influenced by a number of factors: o Height of spillway above stream bed or depth of approach, o relation of the actual crest shape to the ideal nappe shape, o upstream face slope, o downstream apron interference, o down stream submergence, and o Ratio of actual total head to the design head,
  • 26. Spillway Discharge contd. • The height of spillway, 𝑃 above stream bed or approach channel affects the velocity of approach which in turn affects the coefficient of discharge, 𝐶. • With increase in 𝑃 the velocity of approach decreases and the 𝐶 increases. • Model tests indicate that the 𝐶 becomes fairly constant when P > 3.0𝐻 𝑜, where 𝐻 𝑜 is the design head including the head due to velocity of approach.
  • 27. Pier and Abutment Effects • Where crest piers and abutments are shaped to cause side contractions of the overflow, the effective length, 𝐿 𝑒, is less than the net length of the crest, 𝐿. • The effect of the end contraction may be taken into account by reducing the net crest length as follows: 𝐿 𝑒 = 𝐿 − 2(𝑁𝐾𝑝 + 𝐾𝑎)𝐻𝑒 Where: 𝑁 is number of pier 𝐾𝑝is pier contraction coefficient 𝐾𝑎is abutment contraction coefficient 𝐻𝑒 is actual head on the crust
  • 28. Pier and Abutment Effects contd. • 𝐾 𝑝 is affected by: o the shape and location of the pier nose, o the thickness of the pier, o the design head, and o the approach velocity. • For conditions of design head, 𝐻 𝑜 , o For square-nosed piers with corners rounded on a radius equal to about 0.1 of the pier thickness, 𝐾𝑝 = 0.02 o For round-nosed piers, 𝐾𝑝 = 0.01 o For pointed-nose piers,𝐾 𝑝 = 0.00
  • 29. Pier and Abutment Effects contd. • 𝐾𝑎 is affected by: o the shape of the abutment, o the angle between the upstream approach wall and the axis of the flow, o the head in relation to the design head, and o the approach velocity. • For conditions of design head, 𝐻 𝑜 , o For square abutments with headwall at 90o to direction of flow: , 𝐾 𝑎 = 0.2 o For rounded abutments with headwall at 90oto direction of flow, when 0.15𝐻 𝑜 ≤ 𝑟 ≤ 0.5𝐻 𝑜, 𝐾a = 0.1 o 𝐾 𝑝 = 0.00 o For rounded abutments with radius larger than 0.5𝐻 𝑜and head wall is placed not more than 45o to direction of flow, 𝐾 𝑎 = 0.00
  • 30. Effect of Approach Velocity • Another factor influencing the discharge coefficient of a spillway crest is the depth in the approach channel relative to the design head defined as the ratio 𝑃 𝐻 𝑜, • As 𝑃 decreases relative to the design head, the effect of approach velocity becomes more significant. • These coefficients are valid only when the ogee is formed to the ideal nappe shape; that is, when 𝐻𝑒 𝐻 𝑜 = 1
  • 31.
  • 32.
  • 33. Effect of Heads Different from Design Head • A wider ogee shape will result in positive pressures along the crest contact surface, thereby reducing the discharge. • With a narrower crest shape, negative pressures along the contact surface will occur, resulting in an increased discharge.
  • 34.
  • 35. Effect of Upstream Face Slope Increase in slope increases coefficient Increase in slope variable change in coefficient
  • 36.
  • 37. Effect of D/S Apron Interference and D/S Submergence • When the water level below an overflow weir is high enough to affect the discharge, the weir is said to be submerged. • The vertical distance from the crest of the overflow to the downstream apron and the depth of flow in the downstream channel, as it relates to the head pool level, are factors that alter the discharge coefficient.
  • 38. Effect of D/S Apron Interference and D/S Submergence contd. • Five distinct characteristic flows can occur below an overflow crest, depending on the relative positions of the apron and the downstream water surface: 1. flow can continue at supercritical stage; 2. a partial or incomplete hydraulic jump can occur immediately downstream from the crest; 3. a true hydraulic jump can occur; 4. a drowned jump can occur in which the high-velocity jet will follow the face of the overflow and then continue in an erratic and fluctuating path for a considerable distance under and through the slower water; and 5. no jump may occur-the jet will break away from the face of the overflow and ride along the surface for a short distance and then erratically intermingle with the slow moving water underneath.
  • 39. Ratio of discharge coefficients resulting from apron effects
  • 40. Ratio of discharge coefficients caused by tailwater effects
  • 41. Uncontrolled Ogee Crests Designed for less than Maximum Head • Use of a smaller design head results in increased discharges for the full range of heads. • The increase in capacity makes it possible to achieve economy by reducing either the crest length or the maximum surcharge head. • The subatmospheric pressures on a nappe-shaped crest do not exceed about one-half the design head when the design head is not less than about 75 percent of the maximum head. • For most conditions in the design of spillways, these negative pressures will be small, and they can be tolerated because they will not approach absolute pressures that can induce cavitation. • Care must be taken, however, in forming the surface of the crest where these negative pressures will occur. • The negative pressure on the crest may be resolved into a system of forces acting both upward and downstream. These forces should be considered in analyzing the structural stability of the crest structure.
  • 42. Sub atmospheric crest pressures for 𝐻 𝑜 𝐻 𝑒 = 0.75
  • 43. Sub atmospheric crest pressures All other conditions remaining the same, pressures along the side of the crest piers are always lower than those along the center line of the span. WES suggest that the maximum negative pressure on the crest should be restricted to (-6m) of water and that the crest profile be designed for a head 𝐻 𝑜 = 0.309𝐻𝑒_𝑚𝑎𝑥 1.2186 (in ft units).
  • 44. Determination of Design Head • Hager (1991) has generalized the results of studies of various research workers as follows: • The absolute minimum of crest pressure, 𝑃 𝑚𝑖𝑛 𝑃 𝑚𝑖𝑛 𝐻𝑒 = 𝛾(1 − 𝜒) Where 𝜒 = 𝐻𝑒 𝐻 𝑜 𝐻𝑒 = Operating head 𝐻0 = Design head, and 𝛾 = Coefficient of proportionality = 1 for WES profile with 45 downstream slope = 0.9 for WES profile with 30 downstream slope
  • 45. Determination of Design Head contd. • The location of zero bottom pressure, 𝑋0 from crest axis 𝑋 𝑜 𝐻 𝑜 = 0.9𝑡𝑎𝑛𝛼( 𝐻𝑒 𝐻 𝑜 − 1)0.43 Where 𝛼 is the downstream slope. The coefficient of discharge 𝐶 𝑑 = 2 3 3 1 + 4𝜒 9 + 5𝜒 In the equation 𝑄 = 𝐶 𝑑 ∗ 𝑏(2𝑔𝐻3 )0.5 Or 𝐶 𝑑 = 1 3 1 + 4𝜒 9+5𝜒 in the equation 𝑄 = 2/3𝐶 𝑑 ∗ 𝑏(2𝑔𝐻3 )0.5
  • 46. Determination of Design Head contd. • The limiting operating head, 𝐻𝐿for a given crest profile is governed by the magnitude of the minimum pressure on the crest which could induce cavitation. • Theoretically, this pressure is the vapour pressure, 𝑃𝑣 , Inserting 𝑃𝑣 in place of 𝑃 𝑚𝑖𝑛and 𝐻𝐿in place of 𝐻𝑒in equation slide 52 yields: 𝐻𝐿 = 𝑃𝑣 𝛾(1 − 𝜒)
  • 47. Determination of Design Head contd. • Cavitation is also dependent on the air content and particularly on the local turbulence level and smoothness of the flow surfaces. • Considering the uncertainties of these factors, Abecasis (1970) assumed a minimum pressure of -7.6 m for incipient cavitation.
  • 48. Downstream Slope or Rear Slope • The downstream slope is made tangential to the crest profile with the angle of the slope generally determined by requirement of structural stability. • Slopes are usually in the range of 0.6H:1V to 1.1H:1V. • The rear slope together with sidewalls constitutes the discharge channel leading the flow from the crest to the energy dissipator. • Because of the acceleration of the flow and the gradual increase in the velocity, extreme care is required to ensure that the profile of the discharge channel, both in elevation and plan, strictly conforms to the design profile. • Also, the specified tolerances of surface finish is to be adhered to, as otherwise cavitation damage can be inflicted if flow velocity exceeds 25 m/s.
  • 49. Water Surface Profile • Water surface profiles in the crest region of standard spillway profiles, including the effects of piers and abutments, have been given in WES • The generalized relationship for a freely overflowing spillway without piers, etc. is: 𝑆 = 0.75 𝜒1.1 − 1 6 𝑋 Where S = 𝑠 𝐻 𝑜 𝑠 =Vertically measured flow depth X = 𝑥 𝐻 𝑜 𝑥 =Longitudinal coordinate and −2 < 𝑋 < 2
  • 50. Spillway Toe • The spillway toe is the junction between the discharge channel and can be design as the energy dissipator component. • Its function is to guide the flow passing down the spillway and smoothly in the energy. • A toe curve is made up of a circular arc, tangential to both the rear slope and the apron. • A minimum radius of 3 times the depth of flow entering the toe is recommended.
  • 51. Spillway Toe contd. • The pressures on the floor and sidewalls in the region of the curvature increase due to centrifugal action. • The resulting pressure is the summation of the hydrostatic pressure and the centrifugal pressure, given by: 𝑃 𝛾 = 𝑌(1 + 𝑉2 𝑔𝑅 ) • Where • 𝑌 is the Depth of flow at the toe • 𝑉 is the mean velocity at the toe • 𝑅 is the radius of the toe curvature
  • 52. Gate-Controlled Ogee Crests • Releases for partial gate openings for gated crests occur as orifice flow. • With full head on a gate that is opened a small amount, a free discharging trajectory will follow the path of a jet issuing from an orifice.
  • 53. Gate-Controlled Ogee Crests contd. • Releases for partial gate openings for gated crests occur as orifice flow. • With full head on a gate that is opened a small amount, a free discharging trajectory will follow the path of a jet issuing from an orifice. • For a vertical orifice the path of the jet can be expressed by the parabolic equation: −𝑦 = 𝑥𝑡𝑎𝑛𝜃 + 𝑥2 4𝐻𝑐𝑜𝑠2 𝜃 where 𝐻 is the head on the center of the opening.
  • 54. Gate-Controlled Ogee Crests contd. • If subatmospheric pressures are to be avoided along the crest contact, the shape of the ogee downstream from the gate sill must conform to the trajectory profile. • Gates operated with small openings under high heads produce negative pressures along the crest in the region immediately below the gate if the ogee profile drops below the trajectory profile. • Tests showed the subatmospheric pressures would be equal to about one-tenth of the design head when the gate is operated at small openings and the ogee is shaped to the ideal nappe profile for maximum head 𝐻𝑜.
  • 55.
  • 56. Gate-Controlled Ogee Crests contd. • The trajectory profile (rather than the nappe) may be adopted to avoid subatmospheric pressure zones along the crest. • Where the ogee is shaped to the ideal nappe profile for maximum head, the subatmospheric pressure area can be minimized by placing the gate sill downstream from the crest of the ogee.
  • 57. Discharge Over Gate-Controlled Ogee Crests • The discharge for a gated ogee crest at partial gate openings will be similar to flow through an orifice and may be computed by the equation: 𝑄 = 𝐶𝐷𝐿 2𝑔𝐻 where: 𝐻 = head to the center of the gate opening (including the velocity head of approach), 𝐷 = shortest distance from the gate lip to the crest curve, and 𝐿 = crest width.
  • 58.
  • 59.
  • 60. Reading Assignment • Design of small dams (USBR), page 365-376
  • 61. Deign of Overfall Spillway • An overfall spillway can be gated or ungated and provided for flow over an arch or buttress dam.
  • 62. Deign of Overfall Spillway contd. • The main concern in the design of free jet spillways is either the deep scour just downstream of the dam (as in the case of a deflected jet) or impact forces on the stilling basin floor at the foot of the dam (with a free falling jet). • The free jet falls from straight drop spillway also known as the box inlet drop spillway which is simply a rectangular box.
  • 63. Deign of Overfall Spillway contd. Design Considerations • The choice of the type of discharge structure— whether to have a free over-fall over a crest or a deep-seated bottom outlet—depends largely on the volume of flood to be disposed, width of the gorge, and the characteristics of the rock forming the gorge and riverbed. • With free over-fall over the top, the jet would fall very near the base of the dam where a concrete- lined stilling basin would be necessary to prevent undermining.
  • 64. Deign of Overfall Spillway contd. • The hydraulic characteristics are defined as follows: o The crest structure and discharge rating are similar to those for the overflow spillway. o The flow normally leaves this structure shortly below the crest. o The exit structure is normally some variation of a flip-bucket. o The flip-bucket radius, 𝑅 for an overfall spillway is at least 5𝑑, where 𝑑 is the flow depth at the bottom of the bucket.
  • 65. Deign of Overfall Spillway contd. Overflow Crest • Overflow crest profiles on the top of arch dams have to be adjusted with overhangs either on the upstream, downstream, or on both sides, since the width available at the top is seldom adequate to base an overflow profile. • A standard ogee profile or parabolic profile is suitable with the required overhang. • Generally, three types of profiles are used:
  • 66. Profiles terminating such that the overflow jet is directed to fall on the concrete apron for the entire range of discharges. Overflow profile ( Beznar dam, Granada)
  • 67. Overflow profile with nappe splitters (Palawan dam, Rhodesia). Profiles with nappe splitters to effect aeration of the jet and spreading over larger area.
  • 68. Profiles with ski jump buckets to deflect the jet far away.
  • 69. Deign of Overfall Spillway contd. • The radius is usually undersized to minimize the size of the overhang, which can destabilize the top of a thin-arch dam. • However, the radius should be sufficient to fully—deflect a significant flood. • The bucket exit angle is selected to throw the jet to a suitable location in the tailrace. • The trajectory can be estimated by: 𝑦 = 𝑥𝑡𝑎𝑛𝜃 − 𝑥2 3.6𝐻𝑐𝑜𝑠2 𝜃 where: 𝑦 = 𝑣𝑒𝑟𝑡𝑖𝑐𝑎𝑙 𝑑𝑖𝑠𝑡𝑎𝑛𝑐𝑒 𝑓𝑟𝑜𝑚 𝑡ℎ𝑒 𝑏𝑢𝑐𝑘𝑒𝑡 𝑙𝑖𝑝 𝑥 = ℎ𝑜𝑟𝑖𝑧𝑜𝑛𝑡𝑎𝑙 𝑑𝑖𝑠𝑡𝑎𝑛𝑐𝑒 𝑓𝑟𝑜𝑚 𝑡ℎ𝑒 𝑏𝑢𝑐𝑘𝑒𝑡 𝑙𝑖𝑝 𝜃 = 𝑏𝑢𝑐𝑘𝑒𝑡 𝑒𝑥𝑖𝑡 𝑎𝑛𝑔𝑙𝑒, and 𝐻 = 𝑑𝑒𝑝𝑡ℎ + 𝑣𝑒𝑙𝑜𝑐𝑖𝑡𝑦 ℎ𝑒𝑎𝑑 𝑎𝑡 𝑡ℎ𝑒 𝑏𝑢𝑐𝑘𝑒𝑡 𝑙𝑖p.
  • 70. Kariba dam spillway, Zimbabwe (after ICOLD, 1987)
  • 71. Deign of Overfall Spillway contd. • The energy from an overfall spillway is normally dissipated by a plunge pool, which can be lined or unlined. • If unlined, the scour and the scour rate will be based on both flow and geology. • The scour hole development is usually indeterminate. • However, the terminal scour depth for a uniformly erodible material can be estimated from the following empirical formula (Coleman, 1982; USBR, 1987)
  • 72. Deign of Overfall Spillway contd

Editor's Notes

  1. illustrates the comparative costs for different combinations of spillway and dam, and indicates a combination that results in the least total cost. To do such comparison it needs so many flood routing tasks, spillway layouts and spillway and dam estimates. Cost of ungated spillway is higher than gated spillway until the maximum reservoir water surface reaches about 3004 feet . After that point the cost is less that the cost of gated spillway.
  2. The maximum water surface from the ogee crest and the gate crest are compared here. The discharge capacity is compared when the gates are opened
  3. Ho=He
  4. Show in the separate file
  5. Show the reproduced curves
  6. Discharge coefficients for vertical-faced ogee crest. Design of small dams page 370
  7. The statements are correct.
  8. Correct the discharge equation
  9. Where He_ max is the maximum operating head.
  10. Arch dams of height exceeding 200 m are not unusual and some dams while in planning or construction will be about 300 m in height