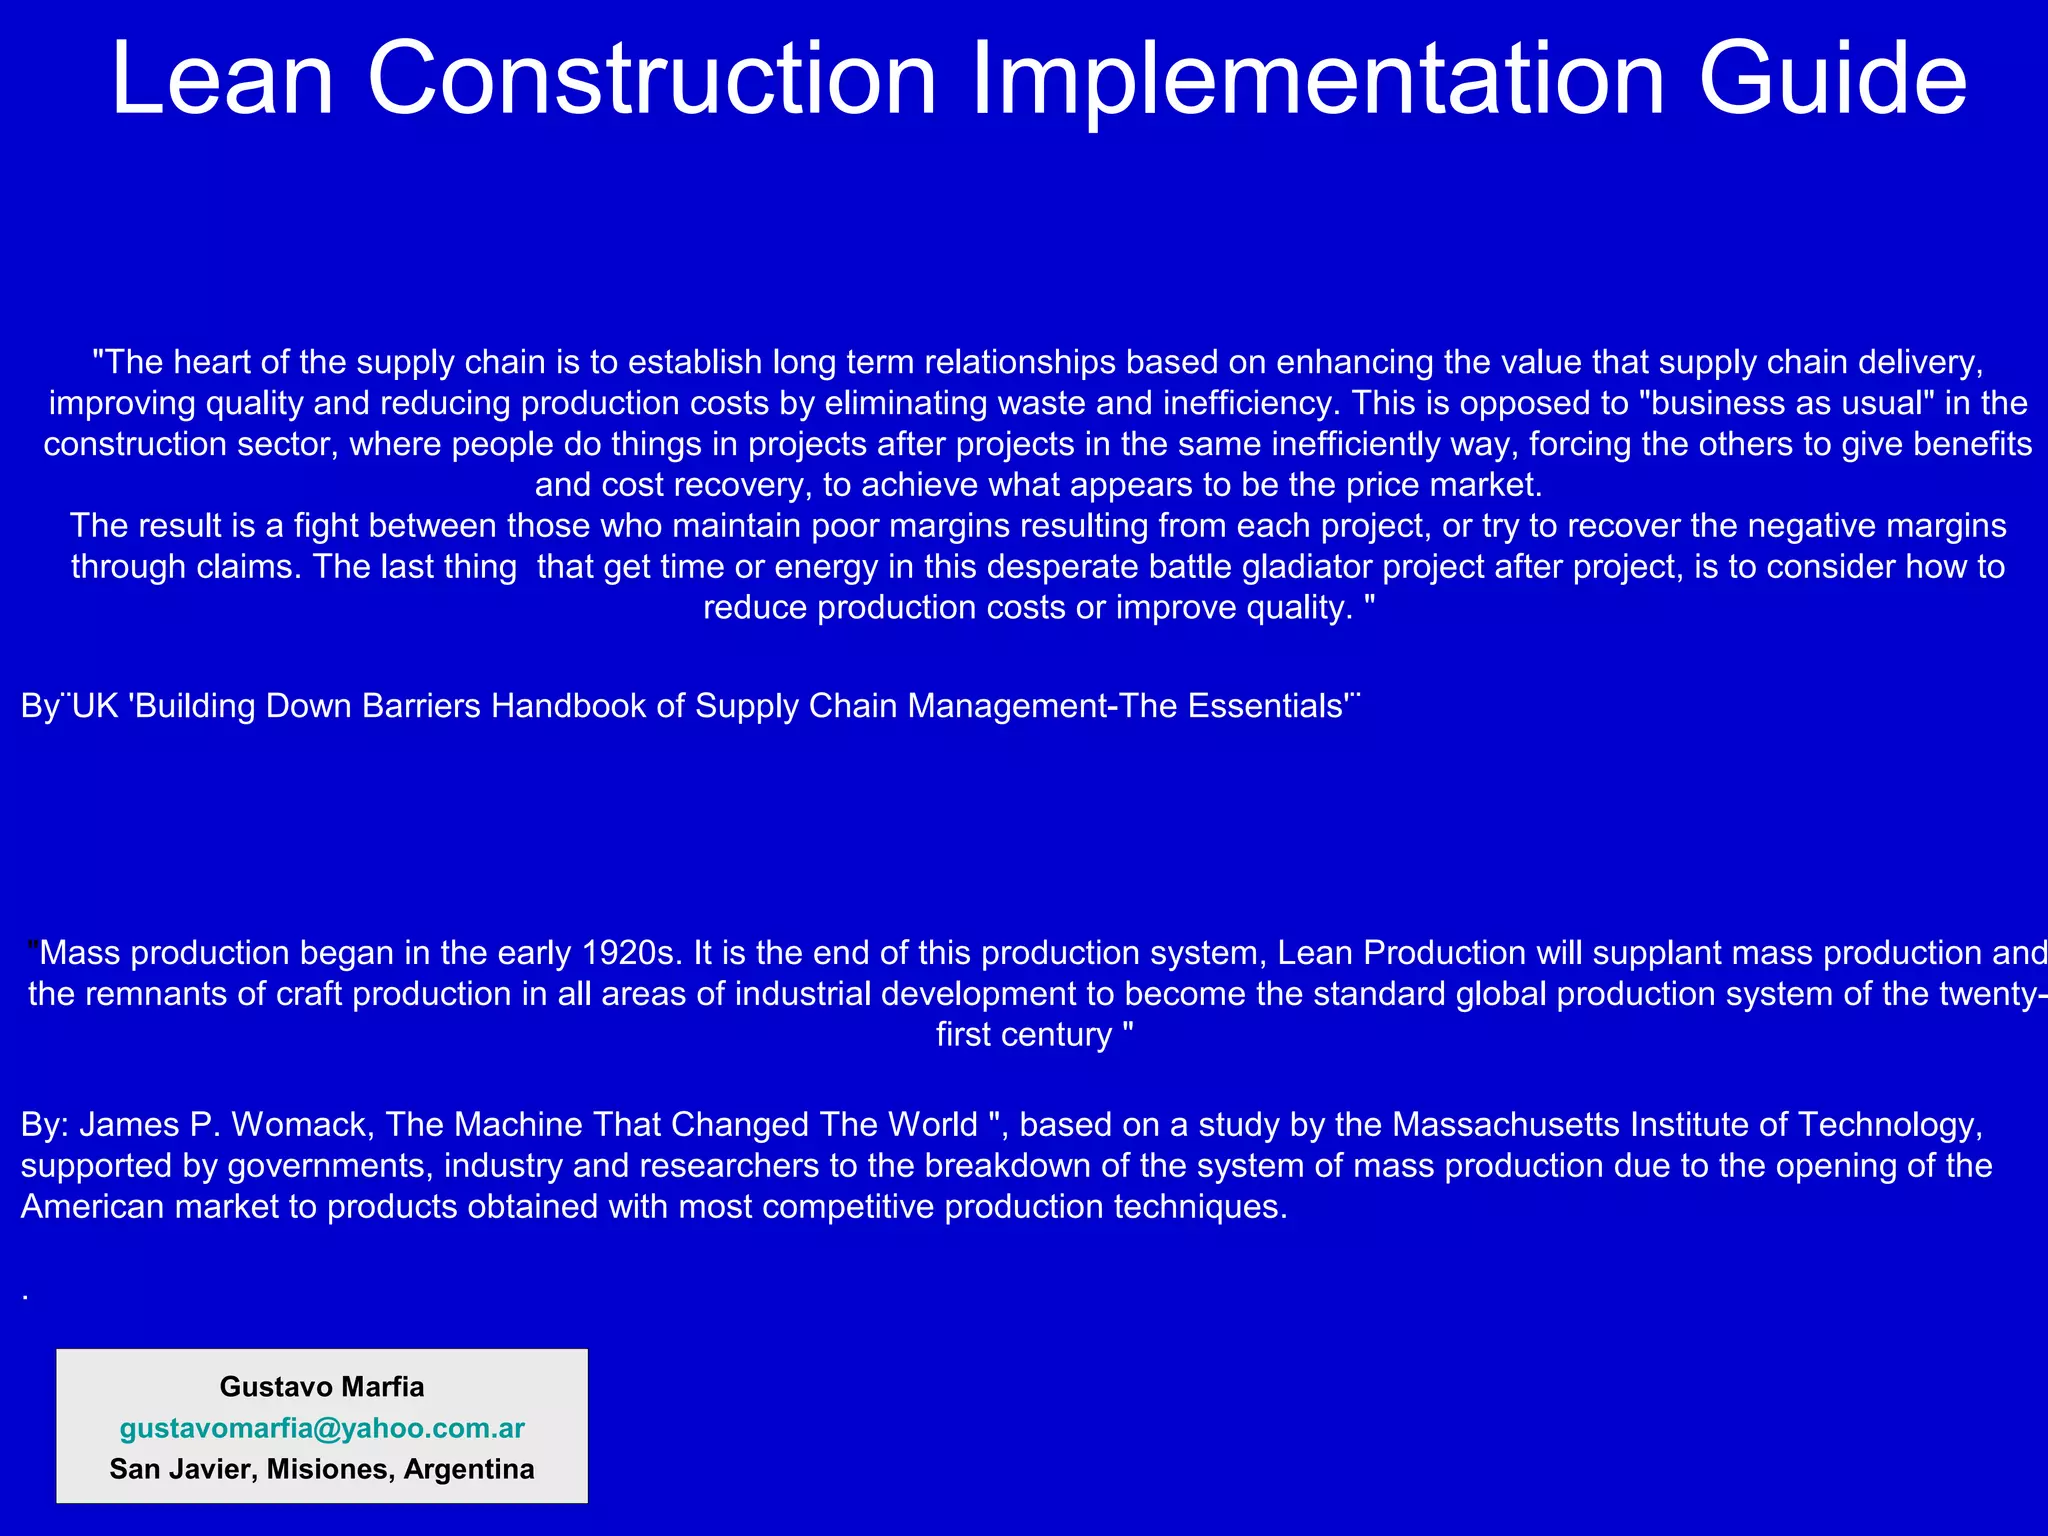
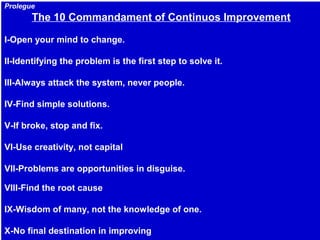
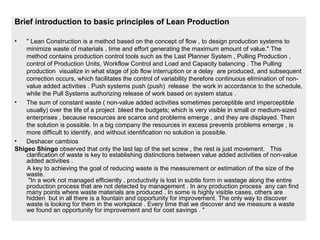
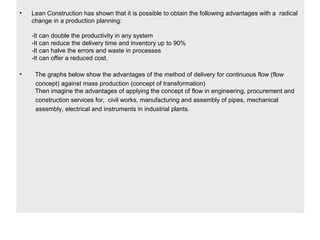
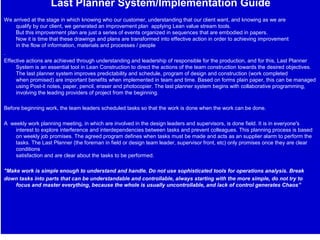
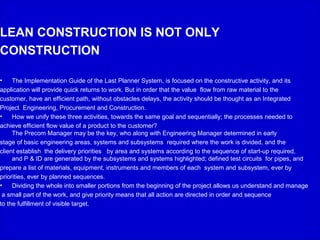
The sum of constant waste ( non-value added activities sometimes perceptible and imperceptible usually) over the life of a project bleed the budgets; which is very visible in small or medium-sized enterprises , because resources are scarce and problems emerge , and they are displayed. Then the solution is possible. In a big company the resources in excess prevents problems emerge , is more difficult to identify, and without identification no solution is possible.
The document discusses lean manufacturing and one-piece flow manufacturing. It defines key lean terms like takt time, kanban, jidoka, and heijunka. It then summarizes how United Electric Controls implemented one-piece flow manufacturing through techniques like reducing lot sizes to one piece, pulling production based on customer demand, and using a kanban card system to signal production. This enabled United Electric Controls to reduce lead times from 4-5 weeks to an average of 2 weeks while improving quality and flexibility.
This document provides an overview of Just-in-Time (JIT) production systems. It discusses that JIT aims to produce what customers want, in the quantity and time they want, while minimizing waste. Key aspects of JIT include inventory reduction, pull-based production triggered by customer demand, small lot sizes and quick setups, uniform plant loading, and flexible resources. The goals are to eliminate disruptions and waste through continuous improvement. JIT requires employee participation, quality control, and developing close supplier relationships.
Lean production focuses on eliminating waste to improve processes. It aims to reduce costs and lead times while understanding customer needs. Lean production was developed by Toyota and focuses on just-in-time production and automation with human touch to stop defective products. It eliminates waste and non-value added activities to streamline production and reduce inventory through continuous flow and pull systems.
This document provides an overview of just-in-time (JIT) and lean operations. It defines JIT and discusses its goals of eliminating waste and achieving smooth, rapid material flow. Key aspects covered include JIT building blocks like product design, process design and personnel elements. Benefits include reduced inventory, flexibility and increased productivity. The document also compares JIT to traditional systems and outlines steps to transition to JIT.
Inputs such as students, patients, or customers enter a service system. The service system then provides a conversion process like knowledge transmission, health care, or food preparation. The desired output is educated people, healthy patients, or satisfied customers. Operations management is concerned with planning and controlling this input-conversion-output process to efficiently and effectively deliver services.
Lean manufacturing is a systematic approach to identifying and eliminating waste from the value stream. The goal of lean is to remove all forms of waste, including cycle time, labor, materials, and energy. Common sources of waste that lean aims to reduce include overproduction, waiting time, transportation, unnecessary inventory, and defects. Taiichi Ohno at Toyota developed the Toyota Production System, which pioneered lean principles like just-in-time production and was inspired by the work of Henry Ford and ideas from American supermarkets.
Operations management transforms inputs like people, materials, and money into outputs like goods and services. Production management specifically deals with producing goods and services by managing resources and distributing finished products. Over time, operations management has evolved from individual artisans to large factories using specialized labor and automation. Frederick Taylor introduced scientific management approaches to minimize costs. Later studies showed the importance of psychological factors in worker motivation. Today, operations management utilizes quantitative models, statistics, information technology, and computer systems to efficiently manage complex operations.
This document discusses production and operations management. It begins with definitions of production management and operations management. It then provides a historical overview of the evolution of the field from Adam Smith's specialization of labor to more modern contributions. The rest of the document defines concepts related to production systems including inputs, transformation processes, outputs, and classifications like job shop, batch, mass, and continuous production.
The document provides details about an internship at Stanley Tools in Dallas, TX. It discusses:
1) Stanley Tools manufactures industrial tools under various brand names.
2) As a maintenance intern, the author's duties included implementing preventative maintenance programs, monitoring equipment performance, and identifying productivity improvements.
3) The author applied concepts from industrial engineering coursework including lean manufacturing, productivity analysis, and quality control during the internship.
Lean production aims to maximize customer value while minimizing waste. It originated from Toyota and focuses on eliminating sources of waste. Just-in-time (JIT) is a key element of lean production that seeks to provide the right part at the right place at the right time with zero inventory. JIT was developed by Toyota in Japan in the 1970s and has since spread worldwide. Bisleri uses JIT in its production process by reducing stocks and using a kanban signaling system between production line workers.
This presentation provides an overview of Just-In-Time (JIT) manufacturing. It defines JIT, discusses its history and goals of eliminating waste. The key principles of JIT are described as total quality management, production management, supplier management, inventory management and human resource management. Benefits of JIT include reduced costs, inventory and lead times while improving quality, flexibility and productivity.
1) The document introduces production systems and industrial engineering. It discusses how industrial engineering designs, improves, and installs integrated systems using specialized knowledge from various fields.
2) It then outlines the topics to be covered in the lecture, including capacity planning, operation scheduling, assembly line design, push and pull systems, theory of constraints, and more.
3) Finally, it provides a list of references for additional reading on topics related to production systems and industrial engineering.
Lean manufacturing is a systematic method for eliminating waste within the manufacturing process. It aims to maximize customer value and minimize waste. Some key tools of lean manufacturing include 5S, continuous flow, just-in-time production, kaizen, value stream mapping, total productive maintenance, and standard work. The ultimate goal of lean is to produce only what is needed, when it is needed, and in the amount needed to eliminate waste and reduce costs.
This document outlines improvements made at a production line using the SMED (Single Minute Exchange of Die) method. It summarizes changes made to reduce time during tool exchanges, including drilling changes, color changes, and mold changes. Parallel operations were implemented, internal activities were transformed into external activities, and quick connection systems were designed to reduce mold exchange times by over 80%. Diagrams and time studies were used to identify improvements that reduced waste and improved efficiency of the production line exchanges.
Lean manufacturing and the toyota production systemGrace Falcis
Lean manufacturing aims to eliminate waste using tools like just-in-time production and jidoka. The Toyota Production System, created by Taiichi Ohno, is built on two pillars: just-in-time production, which supplies the right quantity at the right time and location, and jidoka, which uses people and machines together with fool-proofing and visual status displays to self-regulate quality. Lean manufacturing and the Toyota Production System seek to reduce costs through the absolute elimination of waste while maintaining a strong focus on quality.
Lean system and innovation in strategic Cost ManagementYash Maheshwari
This provides detailed discussion of Lean system and techniques to deal with it such as just in time, six sigma, TPM, Business Process Re-engineering etc.
Just-in-time (JIT) manufacturing aims to eliminate waste by producing the right goods, in the right quantities, at the right time. This minimizes inventory and improves efficiency. JIT was developed in Japan in the 1970s at Toyota and focuses on continuous improvement. It requires close coordination between all parts of the production process and supply chain. While very effective, JIT provides less buffering against disruptions and requires more stable demand than traditional approaches.
From you and to you
You helped me complete my presentation
Here I am offering it to you as a gratitude.
Who doesn't thank people doesn't thank God.
thank you
IRJET- Implementing Lean Manufacturing Principle in Fabrication Process- A...IRJET Journal
This document summarizes a case study on implementing lean manufacturing principles to reduce cycle time in a fabrication process. It identifies various wastes in the current welding process, including long setup times, waiting times, and defects. Tools like value stream mapping, 5S, and single minute exchange of dies were used to analyze causes of waste and propose improvements. The changes reduced average welding time from 426 to 325 seconds. Control charts show the reduced process is now stable and in control. A return on investment calculation found the changes would save over 140 hours per year and yield a 252% return, showing the lean improvements are feasible and valid.
Just-in-Time (JIT) Manufacturing is a philosophy of continuous improvement that emphasizes prevention over correction and demands company-wide quality focus. It originated in post-World War II Japan to address declining market share in automobiles. The key principles of JIT include total quality management, production management using a pull system with reduced inventories, close supplier relationships, and human resource management promoting problem-solving and employee empowerment.
Lean manufacturing aims to eliminate waste in production processes. It was pioneered by Toyota, which employs over 320,000 people worldwide and is the largest vehicle manufacturer. Toyota's production system, called TPS, uses "just in time" processes to make vehicles as quickly and efficiently as possible for customers. Lean manufacturing provides advantages like increased efficiency and reduced staffing needs, but also disadvantages such as high costs of implementation and maintenance. While focusing on eliminating waste, it could overlook other concerns like employee well-being. Overall, lean manufacturing is useful for improving productivity and profits if implemented properly.
The document defines and describes the components of a production system. A production system combines various inputs like materials, labor, machines, and information and transforms them through a process to produce finished goods and services. The key components are facilities, which include the factory, equipment, and layout, and manufacturing support systems, which encompass how work and machines are organized. The aim of a production system is to provide the right products, in the proper quantities, at the needed time and location, and at a reasonable cost.
The document discusses process design. It defines a process as transforming inputs into outputs through a set of activities. Process design determines the workflow, equipment needs, and implementation requirements for a particular process. It typically uses tools like flowcharting and process simulation software. The key aspects of process design discussed are process planning, documentation, design considerations, and serial vs parallel processes. Process planning involves defining requirements, building a team, planning and implementing, auditing, and retiring processes. Documentation includes block flow diagrams, process flow diagrams, piping and instrumentation diagrams, and equipment specifications. Design considerations are objectives like throughput and constraints like costs. Serial processes have activities that occur one after another, while parallel processes can occur simultaneously to reduce flow time or
Productivity improvement is the one of the basic need of every manufacturing industry, so that Just in Time (JIT) is one of the quality tools that are help to improve the productivity. Just in Time (JIT) has been very popular strategy partly because of its success in Japanese manufacturing, Automobile industries. Analysis of wastages is one of the needs of every industry, so we are using the value mapping analysis to check each value-added and non-value-added activity. Just in Time (JIT) is a system that focuses on inventory control, set up time reduction, waste reduction and continuous improvement to achieve operational excellence. In this paper a single case study is doing in the manufacturing company (Towers making). The main objective of this paper to checking each and every activity to achieve the manufacturing time is less than customer order time. Take a pad and pencil and go out on the shop floor. Pick a product and follow it through the entire manufacturing process from raw materials to shipping. Note every activity performed on the product. Do not get a routing slip to see how the process is supposed to go, but accurately record the process including delays, transportation, inspection, storage, etc. After recording time to calculate Available operating time, performance factor, quality rate and overall equipment efficiency. After calculating overall equipment efficiency to compare with international standard and get suggestions to the case company.
The document discusses lean manufacturing and one-piece flow manufacturing. It defines key lean concepts like takt time, kanban, jidoka, and heijunka. It then summarizes how United Electric Controls implemented one-piece flow manufacturing through techniques like reducing lot sizes to one piece and pulling production through the process at the customer demand rate. This enabled them to reduce lead times from 4-5 weeks to an average of 2 weeks while improving quality and flexibility.
The document discusses lean manufacturing and one-piece flow manufacturing. Some key points:
1) Lean manufacturing aims to eliminate waste and optimize flow through continuous improvement. This includes reducing batch sizes, setup times, and lead times.
2) One-piece flow manufacturing produces low volumes of varied products through techniques like takt time, pull systems, and single-piece lot sizes to reduce lead times.
3) A company implemented one-piece flow and reduced lead time from 4-5 weeks to an average of 2 weeks, with same-day response for some orders. This was done through techniques like kanban cards, heijunka boxes, and autonomation.
The document discusses lean manufacturing and one-piece flow manufacturing. Some key points:
1) Lean manufacturing aims to eliminate waste and optimize flow through continuous improvement. This includes reducing batch sizes, setup times, and implementing pull systems.
2) One-piece flow manufacturing is well-suited for low-volume, high-variety production. It involves producing only what is needed when it is needed through techniques like takt time, kanban cards, and one-piece workflows.
3) A company implemented these methods and was able to reduce lead times from 4-5 weeks to an average of 2 weeks while improving flexibility.
Manufacturing Lead Time Reduction in Monoblock (SWJ) Pump Industry [irjet-v4 ...PERUMALSAMY M
Manufacturing lead time is the time required to produce product from its raw materials to final product.A company has to fulfill its customer needs to sustain in this competitive world. Lean has served the manufacturing sector with speed and quality. This project aims at lead time reduction in pump manufacturing company. Value Stream Map(VSM) served as an initiative for identifying bottlenecks process and waste in the manufacturing line; current state map is drawn by the observation made on the shop floor. The takt time is calculated for the demand to find out the bottleneck operations. After identifying the bottleneck operations line balancing is done. The Work In Process (WIP) inventory is reduced by balancing the workstation. Future state map is developed in the perspective of reduction of lead time and to match the takt time with bottleneck process. After line balancing implementation, the lead time for assembly of the SWJ pump is reduced 32 percent and work in process inventory is reduced 25 percent.
Manufacturing Lead Time Reduction in Monoblock (SWJ) Pump IndustryIRJET Journal
This document discusses reducing manufacturing lead time in a pump manufacturing company through lean manufacturing techniques. It begins with an introduction to lean manufacturing and value stream mapping. A current state value stream map is created to identify bottlenecks and waste in the production process. A time study is conducted to calculate takt time. Line balancing is then performed to match process times to takt time and reduce work in process inventory. The key findings are that after implementing line balancing, the lead time for pump assembly was reduced by 32% and work in process inventory was reduced by 25%.
The document discusses lean production and the Toyota Production System. It defines lean production as using minimal inventories of raw materials, work in process, and finished goods while eliminating waste. The Toyota Production System is based on eliminating waste and respecting people. The seven types of waste are identified as overproduction, waiting time, transportation, processing, inventory, motion, and defects. Key aspects of lean implementation include value stream mapping, pull systems using kanban, continuous improvement, and respect for employees.
This document provides an overview of lean manufacturing principles. It defines lean manufacturing and the lean enterprise as philosophies focused on minimizing waste and meeting customer needs. The key aspects of lean covered include identifying the seven types of waste, implementing 5S techniques, designing cellular manufacturing layouts, using just-in-time processes, and value stream mapping to optimize workflow. The goals of lean are to continuously improve processes, reduce costs and lead times, and increase quality and efficiency.
Toyota Production System or Lean Manufacturing has become an imperative to sustain the current hyper competitive scenario . This presentation looks at the basic tenets of Lean Manufacturing as a philosophy as well as a practicing regime.
This document provides an overview of an upcoming training on industry preparedness for engineering graduates and new hires. The training will cover topics to help participants gain basic knowledge and awareness of manufacturing industry practices, terms, and expectations. It will include sections on general operational guidelines, common terms used, manufacturing tools, the industrial revolution, market demands, industry 4.0 and product design, management systems, industry expectations of freshers, self-awareness, interview basics, and resume building. The goal is to help individuals be minimally aware of industry requirements and contribute efficiently with a faster ability to learn on the job.
Production & operations management.Aadil Yousuf
The document discusses operations and production management. It covers several topics:
1. Module I discusses production management concepts like types of manufacturing systems and plant location factors.
2. Module II covers inventory management concepts like inventory types and control techniques.
3. Module III discusses production planning and control techniques as well as quality control tools.
The document provides an overview of the key topics that will be covered in an operations and production management course. It outlines the modules and some of the main concepts that will be discussed in each module.
PRODUCTION PLANNING AND CONTROL PPC NOTES.pptxshishirrathod1
To understand the various components and functions of production planning and control
To know the recent trends like manufacturing requirement Planning (MRP) and Enterprise
Resource planning (ERP).
To know the importance of selection of material, machines, methods and manpower
This document discusses manufacturing systems and product design and development. It defines manufacturing systems as the methods and processes used to take inputs, process them, and deliver outputs. It describes two types of manufacturing systems - intermittent and continuous. Intermittent systems produce goods in small batches based on customer orders while continuous systems constantly produce goods on a large scale based on demand forecasts. The document also discusses factors that influence product design like customer needs and costs. It lists requirements for good product design such as performing its function, being durable and easy to produce. Product development is defined as creating or improving products to meet user needs through innovation and continuous enhancement.
The document provides an overview of Lean Construction principles and techniques. It discusses how Lean aims to eliminate waste and optimize workflow. Specific Lean tools are explained, like 5S, visual controls, pull systems, and Last Planner System. Case studies show Lean reducing costs by 15-30% by improving coordination, reliability, and reducing waste. Customers now expect Lean approaches to manage risk and improve outcomes.
Lean manufacturing is a production method that aims to eliminate waste and improve efficiency. It identifies value from the customer's perspective and removes activities that do not create value. The core principles are to continuously improve processes by removing inefficiencies, creating smooth product flow, and producing only to meet demand. Toyota pioneered this approach through its Toyota Production System of stopping production when issues arise and making only what is needed. Key tools to implement lean include value stream mapping, kanban boards, and 5S for organizing the workplace. The overall goal is to maximize value for the customer while minimizing waste and costs.
Kingsleys Power Point Presentation on Operations Management.pptxKingsley Aduma
The document discusses key concepts in operations management. It defines operations management as the business function responsible for planning, coordinating, and controlling resources needed to produce products and services. An operations manager is responsible for transforming inputs like materials, labor, and capital into outputs like goods and services. The document outlines various operations management strategies, process types, facility layouts, and techniques for scheduling production, monitoring performance, and controlling processes. It also discusses ways to identify and eliminate waste, manage inventory, and increase productivity in operations.
The new trend to Project Management: Lean construction. A methodology to miti...IRJET Journal
This document discusses the application of Lean principles to construction project management. It begins with an introduction to Lean philosophy and its origins at Toyota. The core Lean principles of specifying value, mapping the value stream, making value flow, and pursuing continuous improvement are described. The paper then explores how these Lean concepts can be applied to the construction industry through tools like A3 thinking, value stream mapping, choosing by advantage, poka-yoke, 5S, just-in-time, Kanban, and last planner. Implementing these Lean techniques in construction projects can help reduce waste, improve workflow efficiency, increase quality, and maximize value for customers. The goal is to realize the same benefits from Lean that have been achieved in manufacturing
This document provides an overview of Module 5 which covers Production Planning and Maintenance Management. It discusses key topics like production planning and control in different systems, product selection, positioning, design and development, process selection, and production scheduling. It also discusses maintenance management including maintenance systems and activities under maintenance management. The document then goes into more detail on topics like production planning, scheduling techniques, and maintenance systems and activities.
This document provides an overview of lean manufacturing. It defines lean manufacturing as a method to minimize waste and improve efficiency in manufacturing without reducing productivity. The objectives of lean manufacturing are outlined as eliminating non-value-added activities, minimizing work-in-process inventory, meeting customer demand on time, and creating flexibility. Key lean principles and methodologies are also summarized, including identifying value, mapping the value stream, establishing flow and pull, and seeking perfection. Common types of waste and tools such as 5S, standard work, and just-in-time production are also briefly described.
The focus of the approach is on cost reduction through eliminating non value added activities via applying a management philosophy which focused on identifying and eliminating waste from each step in the production chain respective of energy, time, motion and
resources alike throughout a product’s value stream, known as lean. The lean system was developed with reduced non value added activities so that greatly reduces the seven Mudas. People work with a greater confidence, with greater ease, and with greater peace than the typical
manufacturing facility. The study of current state map shows the areas for improvement and identifying the different types of wastes. The present and future state of value stream map are constructed to improve the production process by minimizing the non-value added activities
which are identified from the VSM. Before Current State Value Stream Mapping (CSVSM) tool used in panel manufacturing industry by
focusing both on processes and their cycle times for a product Power Control Centre (PCC) & Motor Control Centre (MCC) in present scenario.
This presentation was provided by Steph Pollock of The American Psychological Association’s Journals Program, and Damita Snow, of The American Society of Civil Engineers (ASCE), for the initial session of NISO's 2024 Training Series "DEIA in the Scholarly Landscape." Session One: 'Setting Expectations: a DEIA Primer,' was held June 6, 2024.
LAND USE LAND COVER AND NDVI OF MIRZAPUR DISTRICT, UPRAHUL
This Dissertation explores the particular circumstances of Mirzapur, a region located in the
core of India. Mirzapur, with its varied terrains and abundant biodiversity, offers an optimal
environment for investigating the changes in vegetation cover dynamics. Our study utilizes
advanced technologies such as GIS (Geographic Information Systems) and Remote sensing to
analyze the transformations that have taken place over the course of a decade.
The complex relationship between human activities and the environment has been the focus
of extensive research and worry. As the global community grapples with swift urbanization,
population expansion, and economic progress, the effects on natural ecosystems are becoming
more evident. A crucial element of this impact is the alteration of vegetation cover, which plays a
significant role in maintaining the ecological equilibrium of our planet.Land serves as the foundation for all human activities and provides the necessary materials for
these activities. As the most crucial natural resource, its utilization by humans results in different
'Land uses,' which are determined by both human activities and the physical characteristics of the
land.
The utilization of land is impacted by human needs and environmental factors. In countries
like India, rapid population growth and the emphasis on extensive resource exploitation can lead
to significant land degradation, adversely affecting the region's land cover.
Therefore, human intervention has significantly influenced land use patterns over many
centuries, evolving its structure over time and space. In the present era, these changes have
accelerated due to factors such as agriculture and urbanization. Information regarding land use and
cover is essential for various planning and management tasks related to the Earth's surface,
providing crucial environmental data for scientific, resource management, policy purposes, and
diverse human activities.
Accurate understanding of land use and cover is imperative for the development planning
of any area. Consequently, a wide range of professionals, including earth system scientists, land
and water managers, and urban planners, are interested in obtaining data on land use and cover
changes, conversion trends, and other related patterns. The spatial dimensions of land use and
cover support policymakers and scientists in making well-informed decisions, as alterations in
these patterns indicate shifts in economic and social conditions. Monitoring such changes with the
help of Advanced technologies like Remote Sensing and Geographic Information Systems is
crucial for coordinated efforts across different administrative levels. Advanced technologies like
Remote Sensing and Geographic Information Systems
9
Changes in vegetation cover refer to variations in the distribution, composition, and overall
structure of plant communities across different temporal and spatial scales. These changes can
occur natural.
How to Setup Warehouse & Location in Odoo 17 InventoryCeline George
In this slide, we'll explore how to set up warehouses and locations in Odoo 17 Inventory. This will help us manage our stock effectively, track inventory levels, and streamline warehouse operations.
ISO/IEC 27001, ISO/IEC 42001, and GDPR: Best Practices for Implementation and...PECB
Denis is a dynamic and results-driven Chief Information Officer (CIO) with a distinguished career spanning information systems analysis and technical project management. With a proven track record of spearheading the design and delivery of cutting-edge Information Management solutions, he has consistently elevated business operations, streamlined reporting functions, and maximized process efficiency.
Certified as an ISO/IEC 27001: Information Security Management Systems (ISMS) Lead Implementer, Data Protection Officer, and Cyber Risks Analyst, Denis brings a heightened focus on data security, privacy, and cyber resilience to every endeavor.
His expertise extends across a diverse spectrum of reporting, database, and web development applications, underpinned by an exceptional grasp of data storage and virtualization technologies. His proficiency in application testing, database administration, and data cleansing ensures seamless execution of complex projects.
What sets Denis apart is his comprehensive understanding of Business and Systems Analysis technologies, honed through involvement in all phases of the Software Development Lifecycle (SDLC). From meticulous requirements gathering to precise analysis, innovative design, rigorous development, thorough testing, and successful implementation, he has consistently delivered exceptional results.
Throughout his career, he has taken on multifaceted roles, from leading technical project management teams to owning solutions that drive operational excellence. His conscientious and proactive approach is unwavering, whether he is working independently or collaboratively within a team. His ability to connect with colleagues on a personal level underscores his commitment to fostering a harmonious and productive workplace environment.
Date: May 29, 2024
Tags: Information Security, ISO/IEC 27001, ISO/IEC 42001, Artificial Intelligence, GDPR
-------------------------------------------------------------------------------
Find out more about ISO training and certification services
Training: ISO/IEC 27001 Information Security Management System - EN | PECB
ISO/IEC 42001 Artificial Intelligence Management System - EN | PECB
General Data Protection Regulation (GDPR) - Training Courses - EN | PECB
Webinars: https://pecb.com/webinars
Article: https://pecb.com/article
-------------------------------------------------------------------------------
For more information about PECB:
Website: https://pecb.com/
LinkedIn: https://www.linkedin.com/company/pecb/
Facebook: https://www.facebook.com/PECBInternational/
Slideshare: http://www.slideshare.net/PECBCERTIFICATION
How to Add Chatter in the odoo 17 ERP ModuleCeline George
In Odoo, the chatter is like a chat tool that helps you work together on records. You can leave notes and track things, making it easier to talk with your team and partners. Inside chatter, all communication history, activity, and changes will be displayed.
How to Manage Your Lost Opportunities in Odoo 17 CRMCeline George
Odoo 17 CRM allows us to track why we lose sales opportunities with "Lost Reasons." This helps analyze our sales process and identify areas for improvement. Here's how to configure lost reasons in Odoo 17 CRM
The simplified electron and muon model, Oscillating Spacetime: The Foundation...RitikBhardwaj56
Discover the Simplified Electron and Muon Model: A New Wave-Based Approach to Understanding Particles delves into a groundbreaking theory that presents electrons and muons as rotating soliton waves within oscillating spacetime. Geared towards students, researchers, and science buffs, this book breaks down complex ideas into simple explanations. It covers topics such as electron waves, temporal dynamics, and the implications of this model on particle physics. With clear illustrations and easy-to-follow explanations, readers will gain a new outlook on the universe's fundamental nature.
This presentation includes basic of PCOS their pathology and treatment and also Ayurveda correlation of PCOS and Ayurvedic line of treatment mentioned in classics.
it describes the bony anatomy including the femoral head , acetabulum, labrum . also discusses the capsule , ligaments . muscle that act on the hip joint and the range of motion are outlined. factors affecting hip joint stability and weight transmission through the joint are summarized.
How to Make a Field Mandatory in Odoo 17Celine George
In Odoo, making a field required can be done through both Python code and XML views. When you set the required attribute to True in Python code, it makes the field required across all views where it's used. Conversely, when you set the required attribute in XML views, it makes the field required only in the context of that particular view.
1. Lean Construction Implementation Guide
"The heart of the supply chain is to establish long term relationships based on enhancing the value that supply chain delivery,
improving quality and reducing production costs by eliminating waste and inefficiency. This is opposed to "business as usual" in the
construction sector, where people do things in projects after projects in the same inefficiently way, forcing the others to give benefits
and cost recovery, to achieve what appears to be the price market.
The result is a fight between those who maintain poor margins resulting from each project, or try to recover the negative margins
through claims. The last thing that get time or energy in this desperate battle gladiator project after project, is to consider how to
reduce production costs or improve quality. "
By¨UK 'Building Down Barriers Handbook of Supply Chain Management-The Essentials'¨
"Mass production began in the early 1920s. It is the end of this production system, Lean Production will supplant mass production and
the remnants of craft production in all areas of industrial development to become the standard global production system of the twenty-
first century "
By: James P. Womack, The Machine That Changed The World ", based on a study by the Massachusetts Institute of Technology,
supported by governments, industry and researchers to the breakdown of the system of mass production due to the opening of the
American market to products obtained with most competitive production techniques.
.
Gustavo Marfia
gustavomarfia@yahoo.com.ar
San Javier, Misiones, Argentina
2. Prolegue
The 10 Commandament of Continuos Improvement
I-Open your mind to change.
II-Identifying the problem is the first step to solve it.
III-Always attack the system, never people.
IV-Find simple solutions.
V-If broke, stop and fix.
VI-Use creativity, not capital
VII-Problems are opportunities in disguise.
VIII-Find the root cause
IX-Wisdom of many, not the knowledge of one.
X-No final destination in improving
3. Brief introduction to basic principles of Lean Production
• " Lean Construction is a method based on the concept of flow , to design production systems to
minimize waste of materials , time and effort generating the maximum amount of value." The
method contains production control tools such as the Last Planner System , Pulling Production ,
control of Production Units, Workflow Control and Load and Capacity balancing . The Pulling
production visualize in what stage of job flow interruption or a delay are produced, and subsequent
correction occurs, which facilitates the control of variability therefore continuous elimination of non-
value added activities . Push systems push (push) release the work in accordance to the schedule,
while the Pull Systems authorizing release of work based on system status .
• The sum of constant waste ( non-value added activities sometimes perceptible and imperceptible
usually) over the life of a project bleed the budgets; which is very visible in small or medium-sized
enterprises , because resources are scarce and problems emerge , and they are displayed. Then
the solution is possible. In a big company the resources in excess prevents problems emerge , is
more difficult to identify, and without identification no solution is possible.
• Deshacer cambios
Shigeo Shingo observed that only the last lap of the set screw , the rest is just movement. This
clarification of waste is key to establishing distinctions between value added activities of non-value
added activities .
A key to achieving the goal of reducing waste is the measurement or estimation of the size of the
waste.
"In a work not managed efficiently , productivity is lost in subtle form in wastage along the entire
production process that are not detected by management . In any production process any can find
many points where waste materials are produced . In some is highly visible cases, others are
hidden but in all there is a fountain and opportunity for improvement. The only way to discover
waste is looking for them in the workplace . Every time that we discover and we measure a waste
we found an opportunity for improvement and for cost savings . "
4. • Lean Construction has shown that it is possible to obtain the following advantages with a radical
change in a production planning:
-It can double the productivity in any system
-It can reduce the delivery time and inventory up to 90%
-It can halve the errors and waste in processes
-It can offer a reduced cost.
• The graphs below show the advantages of the method of delivery for continuous flow (flow
concept) against mass production (concept of transformation)
Then imagine the advantages of applying the concept of flow in engineering, procurement and
construction services for, civil works, manufacturing and assembly of pipes, mechanical
assembly, electrical and instruments in industrial plants.
5. ESTATION
1
MASSIVE PRODUCTION: 10 pieces Batch X 1 minutes X piece=10 minutes X workstation
PRODUCE 10
MOVES 10
I-TIME TO DELIVER
CUSTOMER THE FIRST PART
21 MINUTES
II-TIME TO COMPLETE THE BATCH
30 MINUTES
1-Need for inventories
2-Push Production
ESTATION
2
ESTATION
3
CONTINUOUS FLOW: Flow of 1 Piece X workstation (process time 1 min)= 1 minute X workstation
ESTACION
1
ESTACION
2
ESTACION
3
1-No Inventories
2-Pull Production
I-TIME TO DELIVER
CUSTOMER THE FIRST PART
3 MINUTES
II-TIME TO COMPLETE THE BATCH
12 MINUTES
PRODUCE 10
MOVES 10
PRODUCE 10
MOVES 10
PRODUCE 1
MOVES 1
PRODUCE 1
MOVES 1
PRODUCE 1
MOVES 1
6. Lean Objective: the elimination of the
original seven industrial waste (muda)
1-Transportation (moving products that are not immediately required to perform processing. Avoid
unnecessary travel)
2-Inventory (all components, work in process and finished product not being processed, they are a
financial and storage cost. Should be minimized)
3-Motion (people or equipment moving or walking more than is required to perform the processing.
Resources needed by the worker must be within reach of the hand)
4-Waiting Times (waiting for the next stage of production, lack of planning, communication or delay
in providing information or materials)
5-Overproduction (producing more of what the customer wants or do it before work takes time and
valuable resources that could be used to respond to customer demand)
6-Over-processing (processing more than required by the client)
7-Defects (time and resources in repairing defects multiply costs and working time)
7. 3 key question’s to enter to construction project in time to start or in
process, and implement the Lean production system.
I-Who is the customer?
Name, backgrounds.
Know about him, will allow us to understand him
II-Customer requirements?
The most convincing way to meet your desire is to study the contract.
How he want to receive the plant, which areas and systems has been prioritized .
Precom deadline
commissioning dealine
Start Up deadline
Performace Test deadline
Demobilization deadline
Knowing what he customer wants, will not allow us absorbed in the construction as a only purpose of the
organization, if not, in construction as a tool for customer satisfaction
III- How client evaluate to us ?
verify:
Customer Evaluation indicators : compliance with planning and control, according to the weekly schedule
compliance , compliance with the schedule of purchases and acquisitions, efficiency indices in developing
engineering , compliance inspections of quality , quality indicators product . SMS Indicators and Environmental
Control.
Service orders , daily work report , communication or document internal customer to supplier.
Customer Inspections to management systems , inspection results and analysis of the items that do not meet
customer
Weekly, monthly client reports , coordination meetings , management meetings
Thus we have a objective view of our strengths and weaknesses from the perspective of a client , which will allow
us to analyze and correct the root of each of the weaknesses cause.
8. Arriving at Work
I-Basic Contacts
1-Contact the project manager to arrange work method(PM)
2-Contact in site with the PM, site manager and department heads to explain and
agree action.
3-Contact customer representatives for submission and agreement of methodology.
4-Contact with subcontractors to agree working methods
II-PyC
1-Status verification of plan, schedule for engineering, procurement and construction.
2-Checking the execution status of the areas, systems and subsystems in the plant.
It has been approved by the client this division?
What are the priority areas or systems required by the customer?
Status of critical equipment to the completion of priority systems?
III-Walking the field and implementation of value stream mapping and value stream plan
1-Field Verification of different value streams.
Usually we will observe in a massive construction work, a multitude of different value streams,
which move in different sectors of the areas of a plant. We will see operating units, working as
isolated
islands, whether the same specialty.
2-Map of current state value stream identification inventories, processes, people, machines
equipment, obstacles, mass production, isolated islands, level of resources
against Works level; etc.
9. 3-Map of future state value stream to identify the main production flows, determine
takt time based in systems to be deliver, determine the pace maker process ; introduction
continuum flow where possible, introduce demand using pulling systems, reduce inventories, level
load and capacity, measuring OEE, 5S events, decomposition of complex systems in loops.
Waste and its sources
4- Annual Value Flow Plan; set goals for improvement in a specific time, determine the responsible
In charge
5-Value Stream Review; documented verification of compliance with the objectives
identified in the value stream plan.
VII-Communication
It should define the communication tool with stakeholders and include them in the communication
plan. Is propose (with PM authorization), communication Lean tools
With the client.
With the PM and the headquarters of all areas.
With key personnel.
With subcontractors.
Visual communication tools : Value Stream maps with directions in order to improve flow of
materials and information and to improvements in processes and people .
Year value stream plan: revisions to the flow plan.
Potential Assignments Program for the next 3 to 12 weeks ( lookahead )
Meetings to coordinate the Weekly Work Plan (WWP) in which supervisors planned weekly
assignments and commit to its implementation
Analysis of constraints, with supervisors in each work to be done to determine what must be done so
that the work is executed
Measuring the success of the Last Planner System Using PPC , percentage of plan fulfilled by
Supervisors
Verifying the revision of the value stream plan beginning to focus on the items X (Not Successful ) ,
then Δ ( limited success ) items. The construction manager should ask " what you need to meet
10. WHY THE VALUE STREAM MAP IS AN ESSENTIAL
TOOL?
. Helps visualize more than a simple process, eg. Assembly, welding, etc.., In production. You can see all the flow.
. Help to see more than waste. Mapping helps you to see the sources of waste in your value stream.
. Provides a common language for talking about manufacturing processes and construction.
. Produce decisions on the apparent flow, so you can discuss them. Otherwise many details and decisions on the ground
floor workshop will pass by default.
.Join all lean concepts and techniques, which helps prevent the compulsive use of Lean tools
. Creates the basis of an implementation plan. This helps to design how must operate the flow from process to process - a
forgotten part in many efforts Lean in the Value Stream Value is creating a model for implementing lean. Imagine trying to
build a house without a model.
.Describes the linkage between the information flow and the flow of materials. no other tool accomplishes this.
. is much more useful than quantitative tools and develops diagrams that produce a detailed overview of the steps that do
not add value, the total process time, distance performed, amount of inventory, and others. The value stream map is a
Qualitative tool in which you describe in detail how your company should operate to create flow. The numbers are good for
creating a sense of urgency or previous or later measurements . The value stream map is good to describe what you are
doing currently to affect those numbers
11. VALUE STREAM MAP
CURRENT STATUS
(Normal visual example in mass production manufacture shops and assembly operations and processes )
1- Piping Spool Manufacturing Shop :
The mass production system creating inventories in excess is observed.
Since the entry of the raw material to the first process to delivery to the customer (assembly processes) are
observed a total production time (L / T lead time) of 25 days, while the time of the actions that
add value is 34 minutes.
2-Piping installing until reinstatement process.
The mass production system creating inventories in excess is observed
1-Massive piping spools are installed on all possible areas
2-Excessive transport, movements and inventories
3-Spaghetti Diagram
4- mass-mobilization from piping storage to the installing areas
5-Excessive operating units and equipment
6- The power of operating units is consumed independently
7-The circuits are delivered massively in the final stage
8-Very difficult to coordinate efficiently
9-No display or clear sense of the pace of production to supply customer processes.
From the entrance of the piping spool to storage yard spool up to delivery to Precom going through the
processes and operations of assembly) a total production time (L / T lead time) of 36 days is observed, while the
time of the actions that add value is 83 minutes.
12. 550 inch
Piping spool
By day
90 dias
49,500 pulg
DELIVERY
550”XDAY
AVERAGE
300”X TRUCK
I
3 day
SAND B+PINT/PRNDTRT (25%)WELDER #1ASSEMBLYCUT/BEVEL
I
3 day
I
3 day
I
3 day
I
3 day
I
Piping
10 DAYS
5500”Uptime: 100%
C/T: 30 seg/in
C/O:
Tur:28,800 sec
Uptime:
C/T:
C/O: 20 min
Proces/mec
Tur: 28,800 seg
Uptime: 100%
C/T360seg/in
C/O: 10 min
Proces/man
Uptime: 100%
C/T:720seg/in
C/O: 10 min
Tur: 28,800seg
Uptime:
C/T:
C/O: 10 min
Proces/man
Tur: 28,800seg
Uptime: 100%
C/T:205seg/in
C/O: Ø
Proces/man
Tur: 28,800seg
Uptime: 100%
C/T: 720 seg
C/O: Ø
Proces/mec
Row material.
Piping, accesor.
Valves , paint MRP
Tues+ Thurs
PRODUCTION
CONTROL
3 week’s
Fprecast
Weekly Fax
Line List
Daily order
Especial Requerim
Weekly Schedulle
Schedulle for
Daily delivery
MASS PRODUCTION /SPOOL PIPING MANUFACTURING
current state map of prefabricated pipes
Product family without PWHT. CS and Alloys
total production time:
8 working hrs + 30 min + 30 min lunch break
Total Production
Time
25 dias
Process
Time
2, 035 seg/34 min
10 day
30 seconds
3 day
360 seconds
3 day
720seconds
3 day
205 seconds
3 day
720 seconds
3 day
14 weld
14 Help
Client: assembly
process
1cuter+1help
2 grinder
travel:
0.5 day
2Xday
720 seg /inch
(Standar X Welder).
40”X day manual proceesl)
720sX40”÷60s÷60s=8hrs
40”X14 sold: 560”X day
1 oper
1 help
2 Master
4 help
7 cassemb
7 helper
13. REINSTATEMNDT RT (25%)WELDINGFIT UP/ASSEM
I
4 days
I
3days
I
3 days
I
Spools
20 days
Uptime: 100%
C/T: 900 s
C/O:15 min
14 canistas
C/T:1800 seg
C/O: 15 min
Uptime: 100%
28 soldadores
Uptime: 100%
C/O: 15m-1h
C/T: 231s/p
C/T: maq 30s
1 operador
Uptime: 100%
C/O 10 m
5 canistas
C/T:900 seg/p
Piping Spool
Manufacting
SITE PRODUCTION
CONTROL
Order
Approval
Procurr/iEngin
Construction
Approval
Daily Priorities
Total Production
Time
36days
Value Added time
4962 seg/83 min
20 days
231 seconds
3 days
900 seconds
3 days
1800 seconds
3 days
231seconds
3 days
900 seconds
4 days
14 assam
14 help
To area
Supervisor
INSTALLING
I
3 days
Cliente
EPC Proyect
49,500”X90 days
2Xday
Travel:
0.5 dia
MASSS PRODUCTION / ASSEMBLY OF PIPING
Map the current state of processes and operations
Mounting pipes
Product family without PWHT. AC and Alloys
Working 10 hours + 60 min lunch
550”X day
Uptime: 100%
C/T:oper 231s/p
1800 seg/inch
Estándar site welder
20”X day process/manual)
1800sX20”÷60s÷60s=10hrs
20”X28 sold: 560”X dia
I I
3 days
Gruas: 2 X 45
C/O: 10-60min
Gruas: 1X75
Uptime: 100%
C/T: 900s/p
C/O:15 min
HT/FLUSH
28 weld
28 help
4 oper
4rigger
1 oper
1 labor
3 help
2 assamb
8 help
14 assamb
14 help
Gruas: 1X25
4 cranes serve to fit up,
Hydrotes and
Reinstatement
Uptime: 100%
28 soldadores 15 ayudantes
900 seg
Reinstatement
Manufact
ay
14. VALUE STREAM MAP
FUTURE STATE
"Let it flow manage the process, not administrators to manage the flow" (Taiichi Ohono)
(Examples of improved visual flow Kaizen, flow of information and materials on the current state map
in Lean production piping spool manufacturing and installing operations)
1-Piping Spool Manufacturing Shop:
Continuous flow system and pulling in the production line is observed which decreases inventory, therefore the
total production time (lead time).
Since the entry of the raw material to the first process to delivery to the process customer (cut/bebeling processes) are
observed a total production time (L / T lead time) 5 days, while the time of the actions add value is 52 sec/inch. No improvements
are observed Processes / people; (Kaizen). These observations are highlighted in "lights Explosion Kaizen "for consideration in the
annual flow plan value.
2 – Piping installing until Precom in Field.
Continuous flow system and pulling in the production line is observed which decreases inventory, therefore the
total production time (lead time).
The piping spool are installed according to an established sequence of assembly set by client processes, in this case, Precom
activate the production demands of the piping spool in manufacturing through a signal of production Kanban to Production
Control Department, who will be informed of the piping spool entry to the plant through withdrawal Kanban ; signal that the installing
process sent.
Lean system produces only what you need, therefore, is eliminated or drastically reduced movements and thus a diagram
Spaguetti is not produced in the production movement’s.
Operating Units of the different processes are dependent, therefore its energy is used more rationally.
Are aligned through continuous flow systems , with a cell named " peacemaker process," which marks to the other processes the
rate
of production the customer demand . They are also aligned through inventory systems controlled between processes using
inventory control tools like "Supermarket " and " FIFO lane .“
Communication systems between processes is through the withdrawal and production Kanban and therefore all units display and
have a clear sense of the pace of production to meet customer demand.
From the entrance in storage yard of piping spool up delivery to Precom going through the installing processes and operations) a
total production time ( L / T lead time ) of 5 days is observed , while the time of the actions that add value is 65 secinch. No
improvements are observed in Processes / people (Kaizen). These observations are highlighted in " Kaizen explosion lights " to be
15. 550 inch
Manufactured
By day
90 Days
ASSEMBLY
DELIVERYSAND B+PAINT
Tur: 28,800 sec
Uptime: 100%
C/T:52eg/inc
C/O: 10 min
Cut:1cuter+2 grinders
Tur: 28,800sec
Uptime: 100%
C/T: 52 seg/in
C/O: Ø
Process/mecc
Row Material
Piping, accesor,
Valves, Paint
Daily
PRODUCTION
CONTROL
Requisition of
Material only
for isometrics
Required by
Installing
Process
1 week
Forecast
Daily Requeriment
E-mail
Production Kanbam
“Please make 550”
Lines 4”-LH-2022
6”-PD-2043
16”-FL-2912
LEAN PRODUCTION /SPOOL PIPING MANUFACTURING
current state map of prefabricated pipes
Product family without PWHT. CS and Alloys
total production time:
8 working hrs + 30 min + 30 min lunch break
Total Production
Time
5 dias + 156 seg
Added Value Time
156 seg/inch
3 days
52 sec/inch
Install Process
Client
Travel:
0.5 dia
2Xday
CUT-BEVELING-FIT UP
WELDING-NDT-UT
Fit up: 7 craftman+ 7 helper
Sold.: 7 weld seminautomatic
UT NDT: 1 Operat+ 1help
FIFO
Craftman+1 help
550 inchs
Material for1650 inchs
Supermarket
2 craft2help14 craft+7Help
(7pipe fitter+7soldad) Cargo Area
Virtual Track
Max 300 inch
≤ 1 day
FIFO
550 inchs
2 ofic+2ay/d
Pipe
Accesories
Valves
Studs
Paitn
≤ 1 day
•The cycle time does not improve
but was reduced from 14 to 7 the
welder s using semiautomatic process
•and separating welding helpers
and assigned them other duties
that add value
•Standard productivity
Using semiautomatica process
80 inches every 8 hours in
Manufacturing
•In this case a significant improvement is produced in
processes and cycle time (C / T). Is obtained a
total processing time much lower that mass production
introducing in the system continuous flow tools
•and pull production that eliminate or reduce inventories
C/T: 52 seg/s
C/O: Ø C/T: 52 seg/s
Tur: 28,800ses
Painter+helper
2 Assambler
2 Helper/deliver
Material movements between
Processes are conducted with
Material manipulators
49,500 Inchs
Takt Time:1” every
52 seconds
Pacemaker
process
Process
Improvement
Process
Improvement
Process
Improvement
Pacemaker Cell
52 sec/inch 52 sec/inch
16. REINSTATEMENT
PIPING, E&I
INSULAT/TRACING
HIDROTEST
FLUSHING
Tur: 36,000 sec
Uptime: 100%
C/T:65seg/in
C/O: 10 min
Cut:1cuter+2 grinders
Tur: 36,000sec
Uptime: 100%
C/O: Ø
Proces/mec
PRODUCTION
CONTROL
Requisition of
Material only
for isometrics
Required by
Installing
Process
1 week
Forecast
Daily Order
priority systems
order changes
claims, etc.Production Kanban
“Please make 550”
Lines 4”-LH-2022,
6”-PD-2043 y 6”-FL-2912
Total production
Time
5 days + 260 sec
Value Added
Time
260 sec
3 days
65 seconds
FIT UP
WELDING-NDT UT
Fit up: 7 assembler+ 7 helper
Weld.: 7 semiautom welder
UT NDT: 1 Operator+ 1help
FIFO
Average: 10 H/F
C/T: 65s/In
550 inchs
1650 inch. of Spool
Supermarket
5 Assembler
15 Helper
14 assembler
28 welders
14 helpers
≤ 1 day
FIFO
550 inchs
2 Assembler
4 Helper
1 E&I
2 Helper
≤ 1 day
65seconds
C/T: 65 seg/p
C/T: 65seg/s
C/T: 720 seg/p
Tur: 36,000seg
2 canistas
2 ayud/delivery
movements between processes
be conducted with material
manipulators
celula
pacemaker
Takt Time:1” every
65 sec/welder
Pacemaker
process
LEAN PRODUCTION / ASSEMBLY OF PIPING
Map the current state of processes and
operations
Mounting pipes
Product family without PWHT. AC and Alloys
Working 10 hours + 60 min lunch
EPC Proyect
49,500”X90 days
550”X day
Manufact
ay
2Xday
Travel:
12 Hrs
SPOOLL INST
IN PRIORITY
SYSTEM
550 Inch. of Spool
Supermarket
65 seconds65seconds
PRECOM
≤ 1 day
FIFO
Reinstament
Lines
C/O: 10-60min
Uptime: 100%
1Crane25 T
•Each spool comes with withdrawal kanban
which flow direct to Production Control
one time the piping spool is consumed by
the installing process
Each line reinstated
with internal precom
approved generates a
Production kamban
Which is directed to the
Production Control Depart
Improve
Welding
And Fit Up
Optimize
Reinstatement
optimize
VIRTUAL
DOWNLOAD
AREA Improve
Install
Pacemaker
Process
Spool piping
Manufacturing
2Crane 45T
1 Crane 75T
4 oper
4 rigger
17. Use of the Takt Time
Client Demand: 49, 500 inch in 90 days = 550 inchs of welding by day
The takt time calculation starts with the available working time for one shifth in Spool Piping Manufacturing Shop, which is 28,000
seconds (8 hours). From this you subtract any non-working time, which is two 30 minutes breaks. The costumer demand is t 550
inch's of welding per shift, is the divided into the available working time to give a takt of 52 seconds.
Available Working Time: 32,400 – 3600 = 28, 800 seconds per shift
available Working Time
= 28, 800 sec / 550 inch per shift = 52,3 seconds per inch of welding
Customer demand
Takt Time = 52 seconds per inch's of welding
What the takt time number mean is that to meet customer demand within its available work time, Spool Piping Manufacturing Shop,
Needs to produce 1 inch of welding finished (include all process) every 52 seconds. This number include no time for equipment
downtime, changeover , or for producing scrap. The manufacturing shop decide to cycle faster that takt, if it cannot immediately
eliminate the downtime problems for example, but the takt time is a reference number defined by customer and cannot be changed
by Spool Piping Manufacturing Shop.
Note: Try to cycle your pacemaker process as close as possible to takt time.
A significant gap between takt time and cycle time indicates the existence of production problems that cause unplanned
downtime.
When you compensate for production problems by cycling much faster that takt, the incentive to eliminate those
Problems evaporates.
If you cycle faster than takt there should be a plan for closing the gap
(Same for LEAN PRODUCTION / ASSEMBLY )OF PIPING
18. DECOMPOSITION IN LOOPS OF
VALUE STREAM MAPS OF FUTURE STATE
The map is decomposed into Loops of process to facilitate the understanding and implementation of steps
for effective improvement, focusing and attacking the actions that do not add value, starting with the most
easy, for which we are sure we can dominate.
VALUE STREAM ANNUAL PLAN
Show us where we want to go through a deployment plan in improvements sequences.
VALUE STREAM REVISION
Allow us to evaluate the effectiveness in the implementation of improvements in manufacturing and installing, biweekly, monthly,
or bimonthly.
19. 550 inch
Manufactured
By day
90 Days
ASSEMBLY
DELIVERYSAND B+PAINT
Tur: 28,800 sec
Uptime: 100%
C/T:52eg/inc
C/O: 10 min
Cut:1cuter+2 grinders
Tur: 28,800sec
Uptime: 100%
C/T: 52 seg/in
C/O: Ø
Process/mecc
Row Material
Piping, accesor,
Valves, Paint
Daily
PRODUCTION
CONTROL
Requisition of
Material only
for isometrics
Required by
Installing
Process
1 week
Forecast
Daily Requeriment
E-mail
Production Kanbam
“Please make 550”
Lines 4”-LH-2022
6”-PD-2043
16”-FL-2912
MASS PRODUCTION /SPOOL PIPING MANUFACTURING
current state map of prefabricated pipes
Product family without PWHT. CS and Alloys
total production time:
8 working hrs + 30 min + 30 min lunch break
Total Production
Time
5 dias + 156 seg
Added Value Time
156 seg/inch
3 days
52 sec/inch
Install Process
Client
Travel:
0.5 dia
2Xday
CUT-BEVELING-FIT UP
WELDING-NDT-UT
Fit up: 7 craftman+ 7 helper
Sold.: 7 weld seminautomatic
UT NDT: 1 Operat+ 1help
FIFO
Craftman+1 help
550 inchs
Material for1650 inchs
Supermarket
2 craft2help14 craft+7Help
(7pipe fitter+7soldad) Cargo Area
Virtual Track
Max 300 inch
≤ 1 day
FIFO
550 inchs
2 ofic+2ay/d
Pipe
Accesories
Valves
Studs
Paitn
≤ 1 day
•The cycle time does not improve
but was reduced from 14 to 7 the
welder s using semiautomatic process
•and separating welding helpers
and assigned them other duties
that add value
•Standard productivity
Using semiautomatica process
80 inches every 8 hours in
Manufacturing
•In this case a significant improvement is produced in
processes and cycle time (C / T). Is obtained a
total processing time much lower that mass production
introducing in the system continuous flow tools
•and pull production that eliminate or reduce inventories
C/T: 52 seg/s
C/O: Ø C/T: 52 seg/s
Tur: 28,800ses
Painter+helper
2 Assambler
2 Helper/deliver
Material movements between
Processes are conducted with
Material manipulators
49,500 Inchs
Takt Time:1” every
52 seconds
Pacemaker
process
Process
Improvement
Process
Improvement
Process
Improvement
Pacemaker Cell
•Loop 2
•Loop 1
Loop 3
52 sec/inch 52 sec/inch
20. REINSTATEMENT
PIPING, E&I
INSULAT/TRACING
HIDROTEST
FLUSHING
Tur: 36,000 sec
Uptime: 100%
C/T:65seg/in
C/O: 10 min
Cut:1cuter+2 grinders
Tur: 36,000sec
Uptime: 100%
C/O: Ø
Proces/mec
PRODUCTION
CONTROL
Requisition of
Material only
for isometrics
Required by
Installing
Process
1 week
Forecast
Daily Order
priority systems
order changes
claims, etc.Production Kanban
“Please make 550”
Lines 4”-LH-2022,
6”-PD-2043 y 6”-FL-2912
Total production
Time
5 days +260 sec
Value Added
Time
260seg/inch
3 days
FIT UP
WELDING-NDT UT
Fit up: 7 assembler+ 7 helper
Weld.: 14 semiautom welder
UT NDT: 1 Operator+ 1help
FIFO
Average: 10 H/F
C/T65s/In
550 inchs
1650 inch. of Spool
Supermarket
5 Assembler
15 Helper
14 assembler
14welders
14 helpers
≤ 1 day
FIFO
550 inchs
2 Assembler
4 Helper
1 E&I
2 Helper
≤ 1 day
65 sec/inch
C/T65seg/p
C/T: 65 seg/s
C/T: 52 seg/p
Tur: 36,000seg
2 canistas
2 ayud/delivery
movements between processes
be conducted with material
manipulators
celula
pacemaker
Takt Time:1” every
65 sec
Pacemaker
process
MASSS PRODUCTION / ASSEMBLY OF PIPING
Map the current state of processes and
operations
Mounting pipes
Product family without PWHT. AC and Alloys
Working 10 hours + 60 min lunch
EPC Proyect
49,500”X90 days
550”X day
Manufact
ay
2Xday
Travel:
12 Hrs
SPOOLL INST
IN PRIORITY
SYSTEM
550 Inch. of Spool
Supermarket
1800 seconds
PRECOM
≤ 1 day
FIFO
Reinstament
Lines
C/O: 10-60min
Uptime: 100%
1Crane25 T
•Each spool comes with withdrawal kanban
which flow direct to Production Control
one time the piping spool is consumed by
the installing process
Each line reinstated
with internal precom
approved generates a
Production kamban
Which is directed to the
Production Control Depart
Improve
Welding
And Fit Up
Optimize
Reinstatement
optimize
VIRTUAL
DOWNLOAD
AREA Improve
Install
Pacemaker
Process
Spool piping
Manufacturing
2Crane 45T
1 Crane 75T
4 oper
4 rigger
Loop 1
Loop 2
Loop 3
65 sec/inch 65 sec/inch 65 sec/inch
Using
semiautomatic
Welding process
40 inches every
10 hours in
Field by welder
21. Value Stream Manager
Date
Operation Manager
Jan 2, 2014
Barb Smith
Paul Doe
VALUE STREAM ANNUAL PLAN
(Spool Piping Manufacturing)
Product Family
Bussines Objetive
FV
Loop
Improve
Profitability
in the
Manufacture
of the
Piping
Spool's
3
Delivery
2
Procure
1
Procces
*Continuos Flow from
Cut/fit up/Weld/NDT
*Kaizen Weld 52sec/inch
*Replace Manual Welding
By Semiautomatic
*Reduce to 4 Welders
* FIFO lane to sand/paint.
To assembly/delibery
*fix other process or
Incrase welding speed.
Objetives of
Value Stream
*Acquire. compounds
only of comodity code
From lines required by
Installing Operations
*Require supplier
sent daily
*analyze possibility
Manufacturing in situ
implementation
Cero WIP
=52,3s sec
≥140”day
560’/dia
2 days
bien/ter
Program
Pulling
3 days
Inventary
560 inch
day
Transport
Elimination
Goals
(Measurable) Monthly Program2014
1 2 3 4 5 6 7 8 9 10 11 12
Plant
Manager
Union Engeniner Mantenan
SIGNATURE
Familia de Productos: Piping Spool’s
Person
in
Charged
Dtos &
People
Program
Revision
DataRevisor
Dtos &
People
22. Value Stream Manager
Date
Construction Manager
Jan 2, 2014
Barb Smith
Paul Doe
VALUE STREAM ANNUAL PLAN
(Field Piping Installing)
Product Family
Bussines Objetive
FV
Loop
Improve
Profitability
in the
Installing
of the
Piping
Spool's
In Field
3
Recep-
cion
2
Field
Install
Process
And
Operation
1
Pace
Maker
Process
HT/Flush
Reinst/
E&I
*Continuos Flow from
Cut/fit up/Weld/NDT
*Kaizen Weld 65sec/inch
*Replace Manual Welding
By Semiautomatic
*Reduce to 14 Welders
* FIFO lane to HT/Flush
and Reinstatement/E&I
*Match othoer process to
Welding speed productiv.
Objetives of
Value Stream
*Reduce to 3 cranes
3 operator
3 rigger
75/45/25 ton
Working in the same
area
*Adjusst pace
All install process/oper
To pacemaker
process
Cero WIP
= 65,4s/inch
≥40”dia
560’/day
2 day
Program
pulling
560”Inch
Installed
daily.
Atend
HT/flush
Reinstat
560 inch
day
Transport
Elimination
and
inventary
Monthly Program2014
1 2 3 4 5 6 7 8 9 10 11 12
Field
Manager
Union Engeen Mantenan
Signatures
Familia de Productos: Piping Precom
DateRevisor
*analyze possibility
Manufacturing in situ
implementation
Goals
(Measurable)
Person
in
Charged
Dtos &
People
Program
Revision
23. Value Stream Manager
Operation Manager
Date: Signatures
Value Stream Revision
Product:
X
Success Limited Success No Success
Goal to field level
F.V
Loop
Progress
Status
Evaluation Remaining Problems
Points and ideas for
annual objectives
24. Last Planner System/Implementation Guide
We arrived at the stage in which knowing who our customer, understanding that our client want, and knowing as we are
qualify by our client, we generated an improvement plan applying Lean value stream tools.
But this improvement plan are just a series of events organized in sequences that are embodied in papers.
Now it is time that these drawings and plans are transformed into effective action in order to achieving improvement
in the flow of information, materials and processes / people
.
Effective actions are achieved through understanding and leadership of responsible for the production, and for this, Last Planner
System is an essential tool in Lean Construction to direct the actions of the team construction towards the desired objectives.
The last planner system improves predictability and schedule, program of design and construction (work completed
when promised) are important benefits when implemented in team and time. Based on forms plain paper, this can be managed
using Post-it notes, paper, pencil, eraser and photocopier. The last planner system begins with collaborative programming,
involving the leading providers of project from the beginning.
Before beginning work, the team leaders scheduled tasks so that the work is done when the work can be done.
A weekly work planning meeting, in which are involved in the design leaders and supervisors, is done field. It is in everyone's
interest to explore interference and interdependencies between tasks and prevent colleagues. This planning process is based
on weekly job promises. The agreed program defines when tasks must be made and acts as an supplier alarm to perform the
tasks. The Last Planner (the foreman in field or design team leader, supervisor front, etc) only promises once they are clear
conditions
satisfaction and are clear about the tasks to be performed.
"Make work is simple enough to understand and handle. Do not use sophisticated tools for operations analysis. Break
down tasks into parts that can be understandable and controllable, always starting with the more simple, do not try to
focus and master everything, because the whole is usually uncontrollable, and lack of control generates Chaos”
25. Last Planner System Implementation Guide
N°
Activity Description Implem
Date
Responsi-
ble
Reviser Date Result.
1
Generate master schedule Total decomposition of activities,
programming them and aligning them
according to customer needs.
PyC
2
Decomposing master schedule
activities into packages of work
and operations.
Planning “lookahead" resulting from
exploration activities of the master program,
showing the resulting tasks before allowing it
to enter the window of lookahead or move
inside the window, and implement the
necessary actions to have ready tasks to be
assigned where scheduled
PyC
3
Create a program of potential
assignments for the next 3 to 12
weeks (lookahead)
program potential assignations for the next
3-12 weeks. The number of weeks in which
the process of lookahead extending is
decided based on the project characteristics,
reliability planning system , and execution
times to acquire information, materials, labor
and equipment.
The scheduling of lookahead is not a simple
extraction of the master program.
Before entering the window of lookahead,
the master schedule is explored at a level of
detail appropriate to the assignment of
weekly work plans, which typically have
multiple assignments for each activity.
PyC
26. Guía de Implementación del Sistema del Ultimo Planificador
N°
Activity Description Implem
Date.
Responsa
ble
Reviser Date Result.
4
Coordinate meetings for the
weekly work plan
supervisors plan the weekly tasks and
are committed to its implementation, to
control the flow of work and to produce
lists assignments through proactive
procurement of materials and design
information needed, and monitoring and
expediting the completion of the
prerequisites.
PyC
5
Assignments promised for
Last Planner
Supervisors decide they physical or
specific work will be done this week.
These types of plans are called
"assignments".
Supervis.
De
campo
6
Restriction analysis Once assignments are identified, these
are subject to a constraint analysis.
Different types of assignments have
different restrictions, eg, lack of tools,
personnel, equipment, HSE
requirements, QA / QC, engineering,
etc..
The constraints analysis requires give to
the coordinator early warning of
problems and provided with sufficient
time to plan.
PyC
Superv.
SMS
QC
7
Measuring the success of the
Last Planner System Using
PPC, percentage plan
compliment by supervisors
The Percent Plan Compliance measures
the extent to which the supervisor
commitment was effective. The PPC
measurements are central. PPC: amount
of compliments on time / amount of
promised plans X100
You must set the standard PPC to work.
An acceptance range PPC in
construction works is between 70% to
85%
PyC
27. Last Planner System Implementation Guide
N°
Activity Description Implem
Date
Responsa
ble
Reviser Date Result.
8
Pareto Chart The reasons for failing plans are followed
and analyzed.
The analysis of nonconformities due to
failure of the plan allow to find the root
causes, so that improvements can be
made in the future implementation. The
Pareto analysis is a statistical technique
that allows decisions selecting a limited
number of tasks that produce significant
effects on total
QA/QC
9
Control of the Production Unit a) The assignment is well defined.
It means that it is ready and completion
can be determined unambiguously.
b) The correct sequence of work is
selected
Refers to whether the sequence is
consistent with the internal logic of the
work itself, the project goals and
implementation strategies.
c) The correct amount of work is
selected
Refers to the amount it is judged that the
production unit is able to finish after
examining the specific work to be
performed.
d) The selected job is enrolled and
may be performed.
It means that all prerequisites are met
and all the resources are available.
Supervisor
PyC
28. Last Planner System Implementation Guide
N°
Activity Description Implem
Date
Responsa
ble
Reviser Date Result.
10
Work flow Control Coordinates the designed flow, supply,
and installation through production units.
Makes work move between production
units in the sequence and desired speed.
Coordin
Lean
11
5S classification, order, cleanliness,
standardization and sustainability: based
on 5 simple principles in order to achieve
better organized work places, more
orderly and cleaner permanently for
higher productivity and a better work
environment management.
Organization and rational jobs
Define sort rules
Achieving visual control
Coordin
12
Total Productive Maintenance The operator of the machine running the
most and sometimes all routine
maintenance himself. This auto
maintenance ensures that appropriate
and effective efforts are made because
the machine is completely domain and
responsibility of a person or team.
Cordind
lean
29. Last Planner System Implementation Guide
N°
Activity Description Implem
Date
Responsa
ble
Reviser Date Result.
13
OEE: OVERALL
EQUIPMENT EFFICIENCY
The OEE is the best measure available
to optimize production processes and is
directly related to operating costs.
The value of OEE can classify one
or more production lines, or an entire
plant, with respect to the best of his
class that have already reached the level
of excellence and can be applied to
any branch of industrial activity
OEE <65% Unacceptable. Significant
economic losses. Very low
competitiveness.
65% <OEE <75% Fair. Acceptable only if
it is in the process of improvement.
Economic losses. Low competitiveness.
75% <OEE <85% acceptable. Continue
improvement to exceed 85% and move
towards World Class. slight losses
economic. Slightly low competitiveness.
85% <OEE <95% Good. Enters World
Class Value. Good competitiveness.
OEE> 95% Excellence. World Class
Value. Excellent competitiveness.
Coordin
Lean
30. Last Planner System Implementation Guide
N°
Activity Description Implem
Date
Responsa
ble
Reviser Date Result.
14
Warning of the Last Planner
the promised task
has been performed
Once the task is completed the Last
Planner is responsible for reporting the
completion of the tasks such that P & C
and the construction manager can
ensure that the work is done according to
the applicable standard
Supervisor
31. Ejemplo
PROYECTO: PILOTO 5 5 WK LOOKAHEAD
ACTIVIDAD 13/1/2010
L M M J V S D
13/1/2010
L M M J V S D
13/1/2010
L M M J V S D
13/1/2010
L M M J V S D
NECESIDADES
Equipo Ramirez
Mont. Cañ K-01
X X X X X X X X X X X X X X X X X X X X X Generador 225
KVA
PH y Flush X X Bomba 2500 PSI
Equipo Pierri
Tableros CR
X X X X X Grúa 20 TON
Cableado Shelter X X X X Material el lugar
Instal. PSV flare X Contrastacion
Equipo Lisionni
Mont. interV-31
X X X X X X X X X APR espacio
confinado
Montaje T-05A X X GRUA 200 TON
Montaje T-05B X X GRUA 200 TON
Montaje T-05C X X GRUA 200 TON
Montaje E-02 X X X X X X GRUA 45 TON
Equipo Rossi
Pintura Cañ K-01
X X X X X X X Data sheet
aprobar
Pintura contr. roon X X X X X X X X X X X X X X X X X X X X X Material en lugar
32. TIE IN 231 CATEGORIA: N FECHA : HORA: HOJA 1
ANALISIS DE RESTRICCIONES N.A: NO APLICA OK : APROBADO F: FALTA
Num TAREAS SMS QC CONST OT OBS
1 APR
2 PT (permiso de trabajo)
3 Matafuegos
4 Señalización ó equipo anti-incendio
5 Vallado
6 Reportes de calidad prefabricado aprobados
7 Procedimientos de soldadura aprobados
8 Calificación de soldadores aprobados
Ejemplo
33. TIE IN 231 CATEGORIA: N FECHA : HORA: HOJA 2
ANALISIS DE RESTRICCIONES N.A: NO APLICA OK : APROBADO F: FALTA
Num TAREAS SMS QC CONST OT OBS
9 Servicio Radiografía
10 Servicio tintas penetrantes ó MT
11 Servicio de tratamiento térmico post soldadura
12 Materiales
13 Equipo izaje
14 Iluminación
15 Energía
16 Andamios
17 Lona ignifuga
18 Soldadora
19 oxicorte
20 Amoladora
21 Llaves-caja de herramientas
22 Llave de impacto
23 Separador de bridas
Ejemplo
34. LEAN CONSTRUCTION IS NOT ONLY
CONSTRUCTION
• The Implementation Guide of the Last Planner System, is focused on the constructive activity, and its
application will provide quick returns to work. But in order that the value flow from raw material to the
customer, have an efficient path, without obstacles delays, the activity should be thought as an Integrated
Project Engineering, Procurement and Construction.
• How we unify these three activities, towards the same goal and sequentially; the processes needed to
achieve efficient flow value of a product to the customer?
The Precom Manager may be the key, who along with Engineering Manager determined in early
stage of basic engineering areas, systems and subsystems required where the work is divided, and the
client establish the delivery priorities by area and systems according to the sequence of start-up required,
and P & ID are generated by the subsystems and systems highlighted; defined test circuits for pipes, and
prepare a list of materials, equipment, instruments and members of each system and subsystem, ever by
priorities, ever by planned sequences.
• Dividing the whole into smaller portions from the beginning of the project allows us understand and manage
a small part of the work, and give priority means that all action are directed in order and sequence
to the fulfillment of visible target.
35. ICONS FOR THE VALUE STREAM MAP
• The icons and symbols to the map of the current and future state fall into three categories
Material Flow, Information Flow, and General Icons
• There are 24 icons which we use 15 in the implementation of value stream maps in construction
These 15 icons are easy to memorize and we will provide a common language to talk about the construction process
.
36. The icons and symbols for current- and future-state mapping fall into three categories:
Material flow, Information, and General Icons
Material Icons Represents Notes
ASSEMBLY
Manufacturing Process
Una process box equals an area of
flow. All processes shoud be labeled.
Also used for departments, such as
Production Control
XYZ
Corporation
Outside Sources
Used to show customer , suppliers,
and outside manufacturing processes
C/T: 45 sec
C/O: 30 min
3 Shifts
2% Scrap
Data Box
Used to record information concerning
a manufacturing process, department,
customer, etc
37. Iconos de Material Representa Notas
Inventory Count and time should be noted
Truck Shipment
Material that is produced and moved
Forward before the next process
Needs it; usually based on a schedulle
Movement of production
Material by PUSH
A controlled inventory of parts that is
Used to shcedule production at an
Upstream process
I
300 pieces
1 day
Mon
+Wed
Note frequency of shipments
Movement of finished
Good to the customer
Supermarket
38. Material Icons Represents Notes
withdrawal
Pull of materials, usually from a
supermarket
Transfer of controlled quantities
of material between process in
“First-in, Firs-Out”
sequence
For example: production schedule or
shipping schedulleManual information flow
Describes an information flow
Indicates a divice to limit quantity
and ensure FIFO flow of material
between processes. Maximum
quantity should be noted
.
Electronic information flow
Information
FIFO
Information Icons Represents Notes
For example: via electronic data
interchange.
Programa
semanal
Max. 20 piecess
39. Information Icons Represents Notes
Production Kanban
(dotted line indicates
Kanban path)
The “one-per-container” Kanban.
card or device that tells a process
how many of what can be produced
and gives permission to do so
Withdrawal Kanban
The “one-per-batch” kanban.
Signal when a reorder point is
reached and another batch need to
re produced. Used where supplying
rrocess must produce in batches
because changeover are required.
Kanban Signal
Card or device that instruct the material
handler to get and transfer parts
(i.e., from a supermarket to the
consuming process)
40. Information Icons Represents Notes
Sequenced-Pull Ball
Gives instruction to immediately
produce a predetermined type and
quantity, typically one unit. A pull
system for subassembly processes
without using a supermarket
Post Kanban
Tool to intercep batches of kanban
and level the volume and mix of
them over a period of time
Kanaban arriving in batches
Place where kanban are collected
and held for conveyance
OXOX Load Leveling
“Go See” Production
Scheduling
Adjusting schedules based on
checking inventory levels
41. Iconos Generales Representa Notas
“Kaisen Lightning Burst”
Highlights improvement need at
Specific processes that are critical
To achieving the value-stream
Vision. Can be used to plan Kaiser
Workshops
Buffer o Safety Stock
Represents a person viwed from
above
“Buffer” or “ safety stock”
Must be noted
Operator
Weld
Changeover
Welder
Uptime
42. LEAN Y LA VARIABILIDAD
Variability is not just a harmless word for construction. The variability are the multiple action invaluable or not
valued correctly producing obstacles in efforts to produce value. They produce deviations of actions planned
for undetermined actions or not displayed. Variability is the most unseen enemy of production, and usually
we see this when the damage occurred. Variability is the mortal enemy of improvisation, and can produce
huge damages in the projects
But although the variability can not be dominated, it can be partially controlled, so the damage that may
occur will be absorbed by the budget of the project without great losses. Variability is like a thief trying to
steal unawares. Then we must reduce the possibility that this act against our objectives. The variability can
be controlled through the implementation of a proper Risk Plan, supply and logistics plan, health plan and
plan of social relations, that value all activities to be done, properly.
• All good Lean coordinator , must begin with a thorough study of the terrain, climate and local people, to
foresee the actions necessary for efficient and safe execution of supplies and logistics. Meet recurrent
disease location and times of rain, or wind, to foresee the actions to mitigate these adverse weather
conditions and reduce the damaged in field by the declining of production. You will also must perceive from
the field the delivery reliability of engineering and external suppliers. There are clear signs of improvisation
in a supplier, which can be detected at an early stage, and it should work firmly on this detour. Do not allow
them to grow as might become indomitable and the damage of unpredictable consequences.